Chose Amazon QuickSight
Mixpanel

| Product | Rating | Most Used By | Product Summary | Starting Price |
|---|---|---|---|---|
 Amazon QuickSight | N/A | N/A | $3 per month per user | |
 SAS Visual Analytics | Enterprise companies (1,001+ employees) | SAS Visual Analytics provides a complete platform for analytics visualization, enabling users to identify patterns and relationships in data that weren't initially evident. Interactive, self-service BI and reporting capabilities are combined with out-of-the-box advanced analytics so everyone can discover insights from any size and type of data, including text. | N/A |
| Amazon QuickSight | SAS Visual Analytics | |||||||||||||||
|---|---|---|---|---|---|---|---|---|---|---|---|---|---|---|---|---|
| Editions & Modules |
|
| ||||||||||||||
| Offerings |
| |||||||||||||||
| Entry-level Setup Fee | No setup fee | No setup fee | ||||||||||||||
| Additional Details | Prospective buyers can also purchase a set number of sessions or questions in lieu of a monthly subscription. | SAS Visual Statistics and SAS Office Analytics are also available as add-ons. | ||||||||||||||
| More Pricing Information | ||||||||||||||||
| Amazon QuickSight | SAS Visual Analytics | |
|---|---|---|
| Considered Both Products | Amazon QuickSight  Lakhan Suri Senior System Engineer Chose Amazon QuickSight As per our requirement, the Amazon Eco System leads us to use the Amazon Quick Sight platform. It works well with Redshift datasources.  Megan Sullivan Marketing Director Chose Amazon QuickSight All of the other reporting platforms my organization has used previously were within our CRM and not a standalone program. In that we were very limited in being able to slice and dice the data the way that we wanted to. | SAS Visual Analytics  Raman Ahuja Associate Consultant Chose SAS Visual Analytics Visual Studio IDE  Tapan Jain Data Analyst Chose SAS Visual Analytics Tableau Desktop  Mike Narumiya Director, Data and Information Systems Chose SAS Visual Analytics Price and features we looked at seemed consistent. We chose this product because our staff already knew the product, plus users at the state had recommended it as it is what they use.  suva sahu Project Lead Chose SAS Visual Analytics SAS visual analytics has high sped LASR servers mounted on Hadoop filesystems which makes it more powrful for analytics.  Alex Rubin Sr. SAS Programmer (consultant) Chose SAS Visual Analytics Never used or evaluated other similar products  Erik Larsen Consultant SAS Business Intelligence Architect and Analyst Chose SAS Visual Analytics There is no contest. SAS is easier maintain and has much more in the way of analytics than MicroStrategy has. It can pull from more than one data source and when the underlying architecture changes, it is much easier to maintain. More savvy analysts can perform more with SAS … |
| Amazon QuickSight | SAS Visual Analytics | |||||||||||||||||||||
|---|---|---|---|---|---|---|---|---|---|---|---|---|---|---|---|---|---|---|---|---|---|---|
| BI Standard Reporting |
| |||||||||||||||||||||
| Ad-hoc Reporting |
| |||||||||||||||||||||
| Report Output and Scheduling |
| |||||||||||||||||||||
| Data Discovery and Visualization |
| |||||||||||||||||||||
| Access Control and Security |
| |||||||||||||||||||||
| Mobile Capabilities |
| |||||||||||||||||||||
| Application Program Interfaces (APIs) / Embedding |
|
| Amazon QuickSight | SAS Visual Analytics | |
|---|---|---|
| Small Businesses |  BrightGauge Score 9.1 out of 10 | BrightGauge Score 9.1 out of 10 |
| Medium-sized Companies |  Reveal Score 10.0 out of 10 | Reveal Score 10.0 out of 10 |
| Enterprises |  Kyvos Semantic Intelligence Layer Score 9.9 out of 10 | Kyvos Semantic Intelligence Layer Score 9.9 out of 10 |
| All Alternatives | View all alternatives | View all alternatives |
| Amazon QuickSight | SAS Visual Analytics | |
|---|---|---|
| Likelihood to Recommend | 9.0 (0 ratings) | 9.0 (0 ratings) |
| Likelihood to Renew | - (0 ratings) | 9.3 (0 ratings) |
| Usability | 7.0 (0 ratings) | 6.0 (0 ratings) |
| Support Rating | 9.0 (0 ratings) | 8.0 (0 ratings) |
| Amazon QuickSight | SAS Visual Analytics | |
|---|---|---|
| Likelihood to Recommend |
|
Raman Ahuja Associate Consultant |
| Pros |
|
Tapan Jain Data Analyst |
| Cons |
Megan Sullivan Marketing Director |
|
| Likelihood to Renew | No answers on this topic |
Erik Larsen Consultant SAS Business Intelligence Architect and Analyst |
| Usability |
Lakhan Suri Senior System Engineer |
Raman Ahuja Associate Consultant |
| Support Rating |
Lakhan Suri Senior System Engineer |
 Nicole Jagusztyn Institutional Research Officer |
| Alternatives Considered |
Lakhan Suri Senior System Engineer |
|
| Return on Investment |
|
suva sahu Project Lead |
| ScreenShots | SAS Visual Analytics Screenshots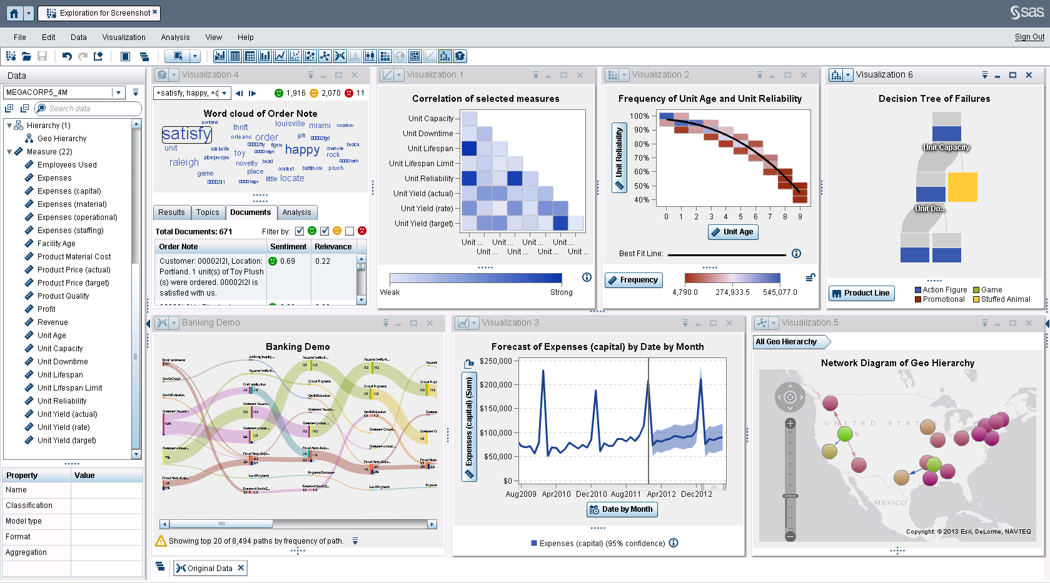 |