D3.js vs. Ignite UI

Overview
ProductRatingMost Used ByProduct SummaryStarting Price
D3.js
Score 8.9 out of 10
N/A
D3.js is a JavaScript library for manipulating documents based on data.N/A
Ignite UI
Score 7.0 out of 10
N/A
New Jersey based Infragistics offers .NET controls.N/A
Pricing
D3.jsIgnite UI
Editions & Modules
No answers on this topic
Offerings
Pricing Offerings
D3.jsIgnite UI
Free Trial
NoYes
Free/Freemium Version
NoNo
Premium Consulting/Integration Services
NoNo
Entry-level Setup FeeNo setup feeNo setup fee
Additional Details
More Pricing Information
Community Pulse
D3.jsIgnite UI
Considered Both Products
D3.js
Chose D3.js
D3.js gives a better aesthetic feel on the charts and as a developer, it gives more options to customize on the charts.

Chose D3.js
Protoviz does not require as much knowledge of programming to build visualizations as with D3.js or Google Charts. Highcharts or AnyChart are other alternatives that are more specific to building charts only.
Ignite UI
Chose Ignite UI
We tried DevExpress when we started a project a couple of years ago. At the time, the documentation and ease of use went to Infragistics. When trying new or updated tools, the documentation and samples are everything. Having minimal documentation or documentation that seems to …
Best Alternatives
D3.jsIgnite UI
Small Businesses
Syncfusion® Essential Studio®
Score 6.1 out of 10
Syncfusion® Essential Studio®
Score 6.1 out of 10
Medium-sized Companies
React
React
Score 9.3 out of 10
React
React
Score 9.3 out of 10
Enterprises
React
React
Score 9.3 out of 10
React
React
Score 9.3 out of 10
All AlternativesView all alternativesView all alternatives
User Ratings
D3.jsIgnite UI
Likelihood to Recommend
8.9
(0 ratings)
10.0
(0 ratings)
Support Rating
8.0
(0 ratings)
-
(0 ratings)
User Testimonials
D3.jsIgnite UI
Likelihood to Recommend
D3.js is great for visualizing with medium and small size datasets. It's also great for prototyping visualizations quickly and sharing on the web so others can view it without having to install any software on their machines
Read full review
Angular is our framework of choice for a number of reasons. Business data is almost always displayed in a grid format. It makes sense to start with a strong widget that is powerful and fast when building applications. Ignite UI provides a complete toolset of widgets for other frameworks, but Angular is our focus. Ignite UI is helping us deliver a great UX/UI.
Read full review
Pros
  • Wide variety of visualization collections.
  • Easy to customize existing visualization collections and add extended functionality.
  • It takes some learning curve, but after that, it's easy to reuse across multiple similar problems with little changes.
Read full review
  • The examples are great and close enough to real-life usage to be truly helpful
  • The OOB configuration and themes are good. They are very configurable.
  • The touch support and response web are built in, allowing the same code to work well on desktop and phone.
Read full review
Cons
  • Has a steep initial learning curve.
  • It is slow when dealing with really large datasets.
  • Not great for making maps.
Read full review
  • I would like to see examples with security tokens. It really isn't an Ignite UI issue, but would be helpful.
  • Some of the examples are over-simplified, not how the products would be used in real life.
Read full review
Support Rating
Support can be improved by providing more educational videos.
Read full review
No answers on this topic
Alternatives Considered
D3.js gives a better aesthetic feel on the charts and as a developer, it gives more options to customize on the charts.
Read full review
We tried DevExpress when we started a project a couple of years ago. At the time, the documentation and ease of use went to Infragistics. When trying new or updated tools, the documentation and samples are everything. Having minimal documentation or documentation that seems to be written for people that already know how to use the product is just plain frustrating. Samples need to be something close to the real-life usage of the product.
Read full review
Return on Investment
  • Rapid Development using templates helps faster delivery of the project.
  • Documentation requires a lot of time to study.
  • D3 creates high-quality visual effects which can be used over large screens.
Read full review
  • There is a learning curve, of course, but the comparisons between the projects with and without Ignite UI are worth it.
  • The time savings on development is very real. The built-in functionality is amazing.
  • We are able to focus on features rather than getting the look and feel of our deliverable.
Read full review
ScreenShots

Ignite UI Screenshots

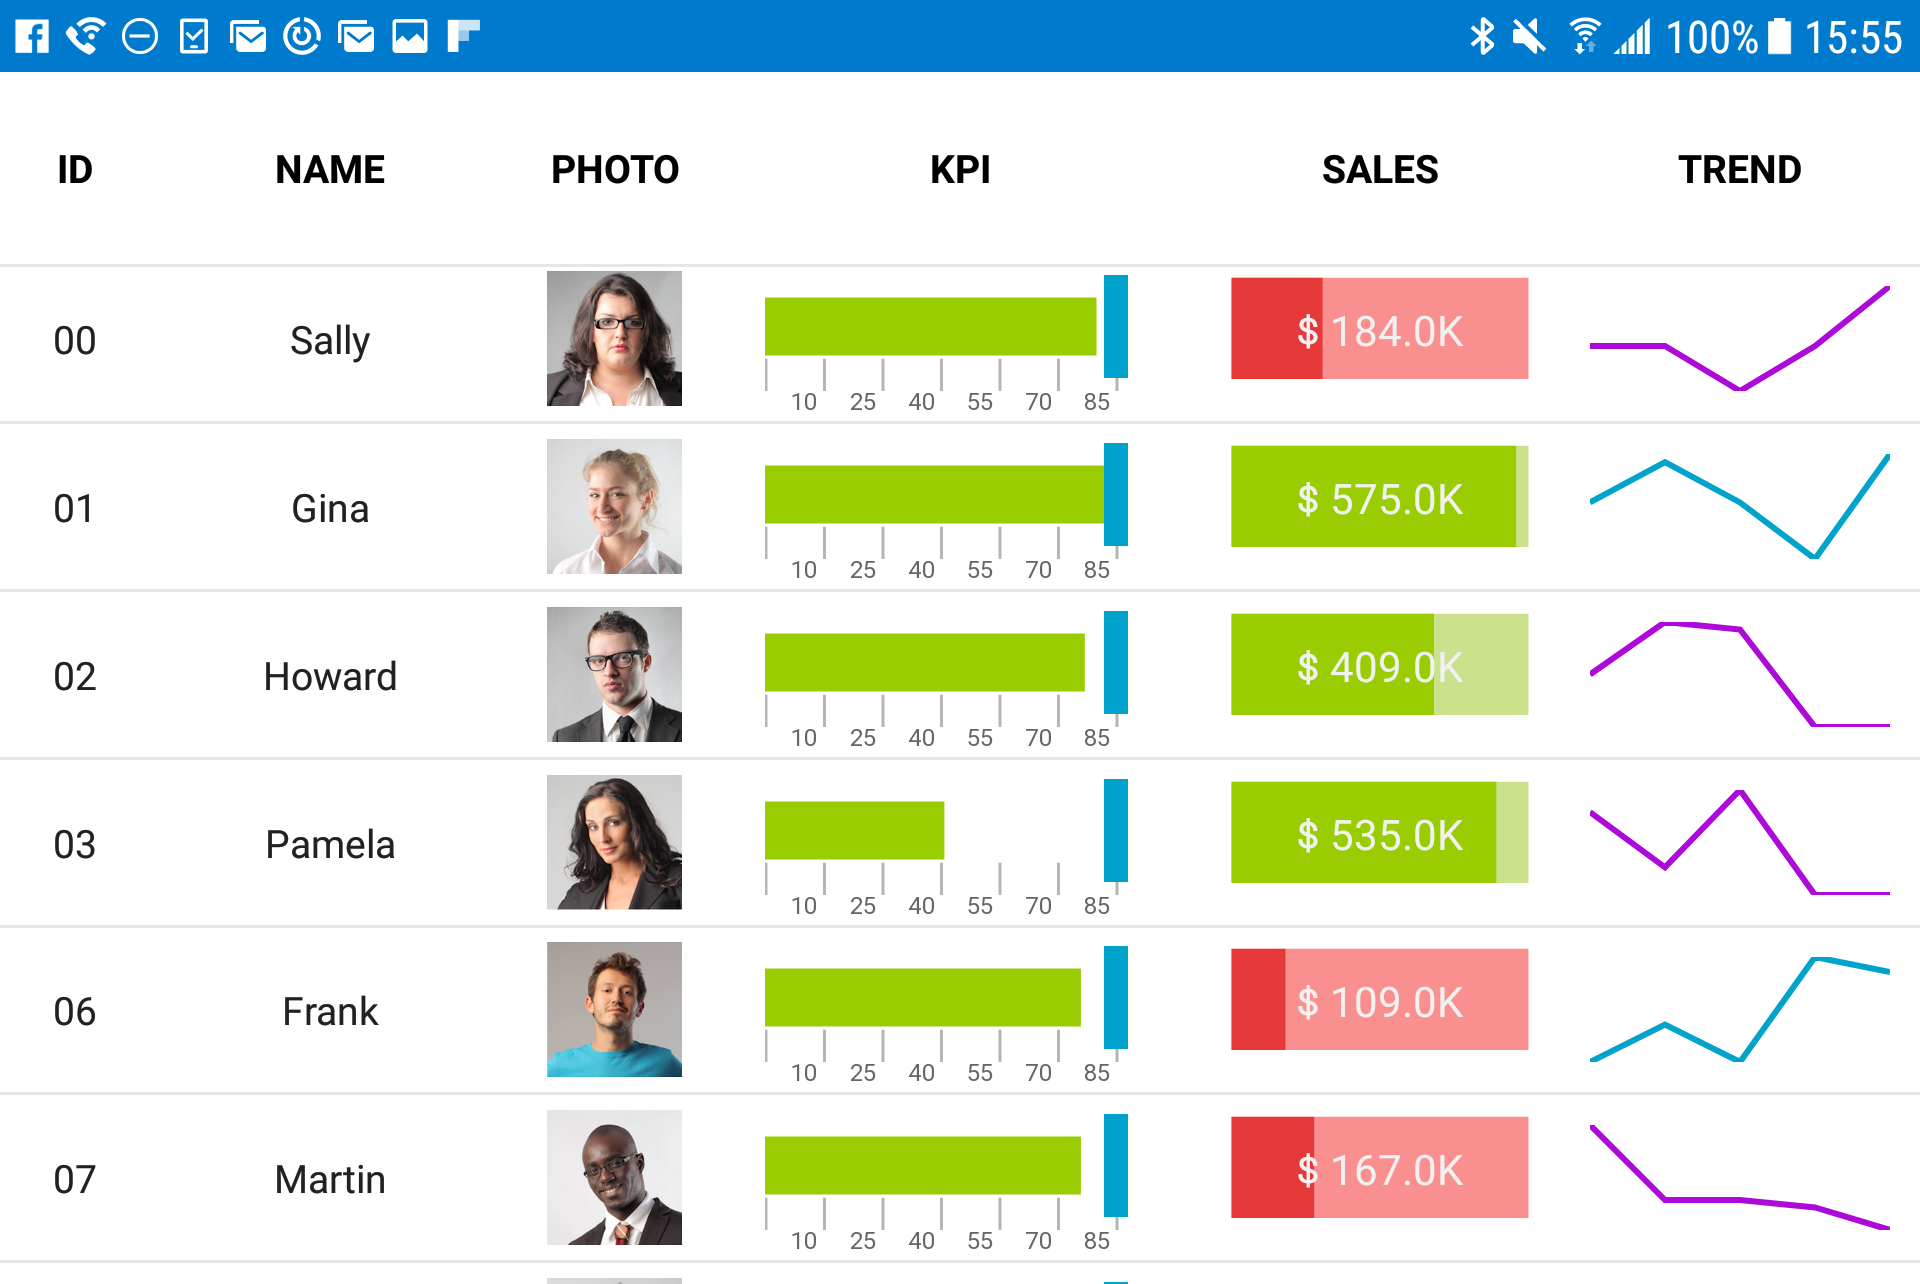
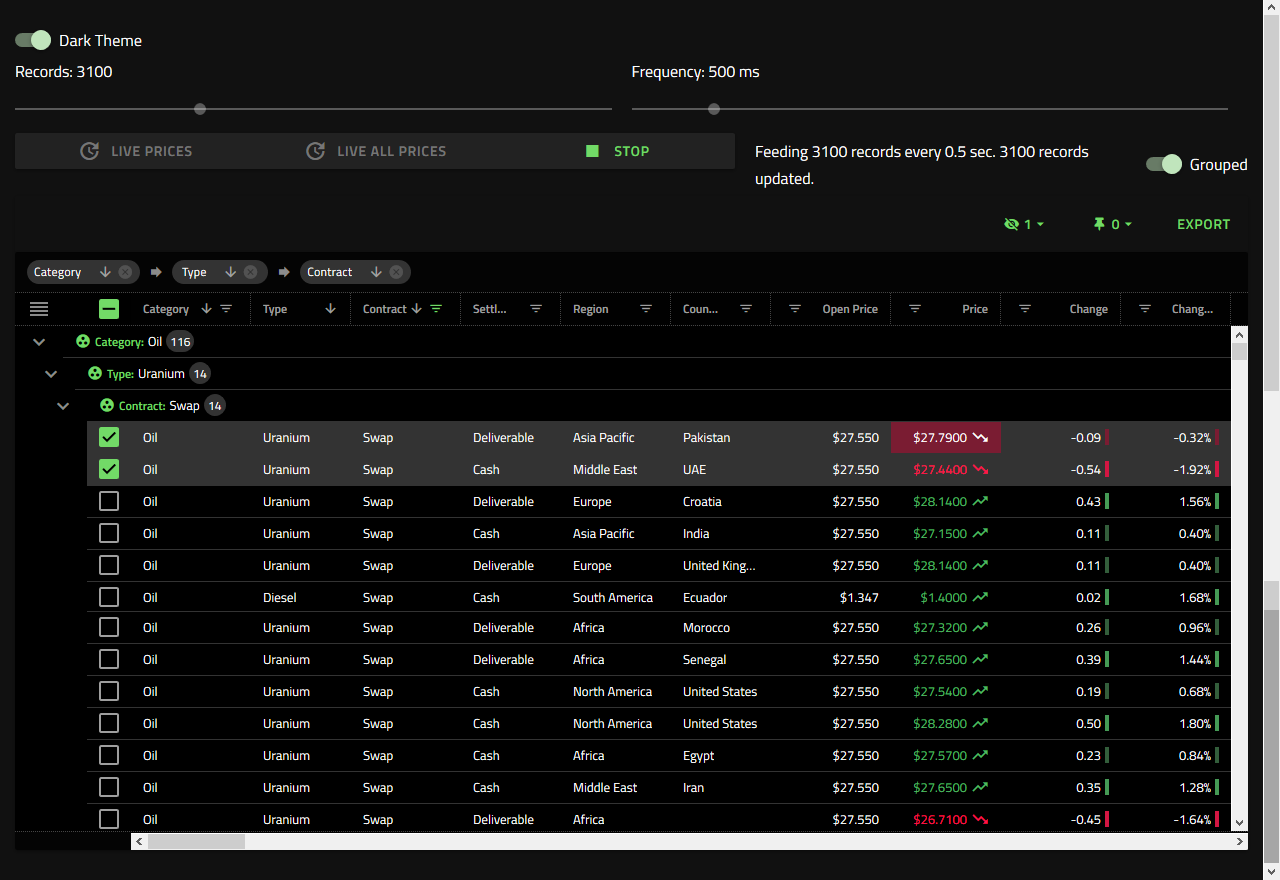
Screenshot of Visualize industry, business, or scientific data in real-time interactive charts.Screenshot of Fast grids, providing line of business features, touch support, and responsive web design features. Works with popular open-source libraries and data sources.Screenshot of Improve usability and ensure accessibility for all users, regardless of how they are navigating pages.