Datadog is a monitoring service for IT, Dev and Ops teams who write and run applications at scale, and want to turn the massive amounts of data produced by their apps, tools and services into actionable insight.
$1.27
per month (billed annually) per host
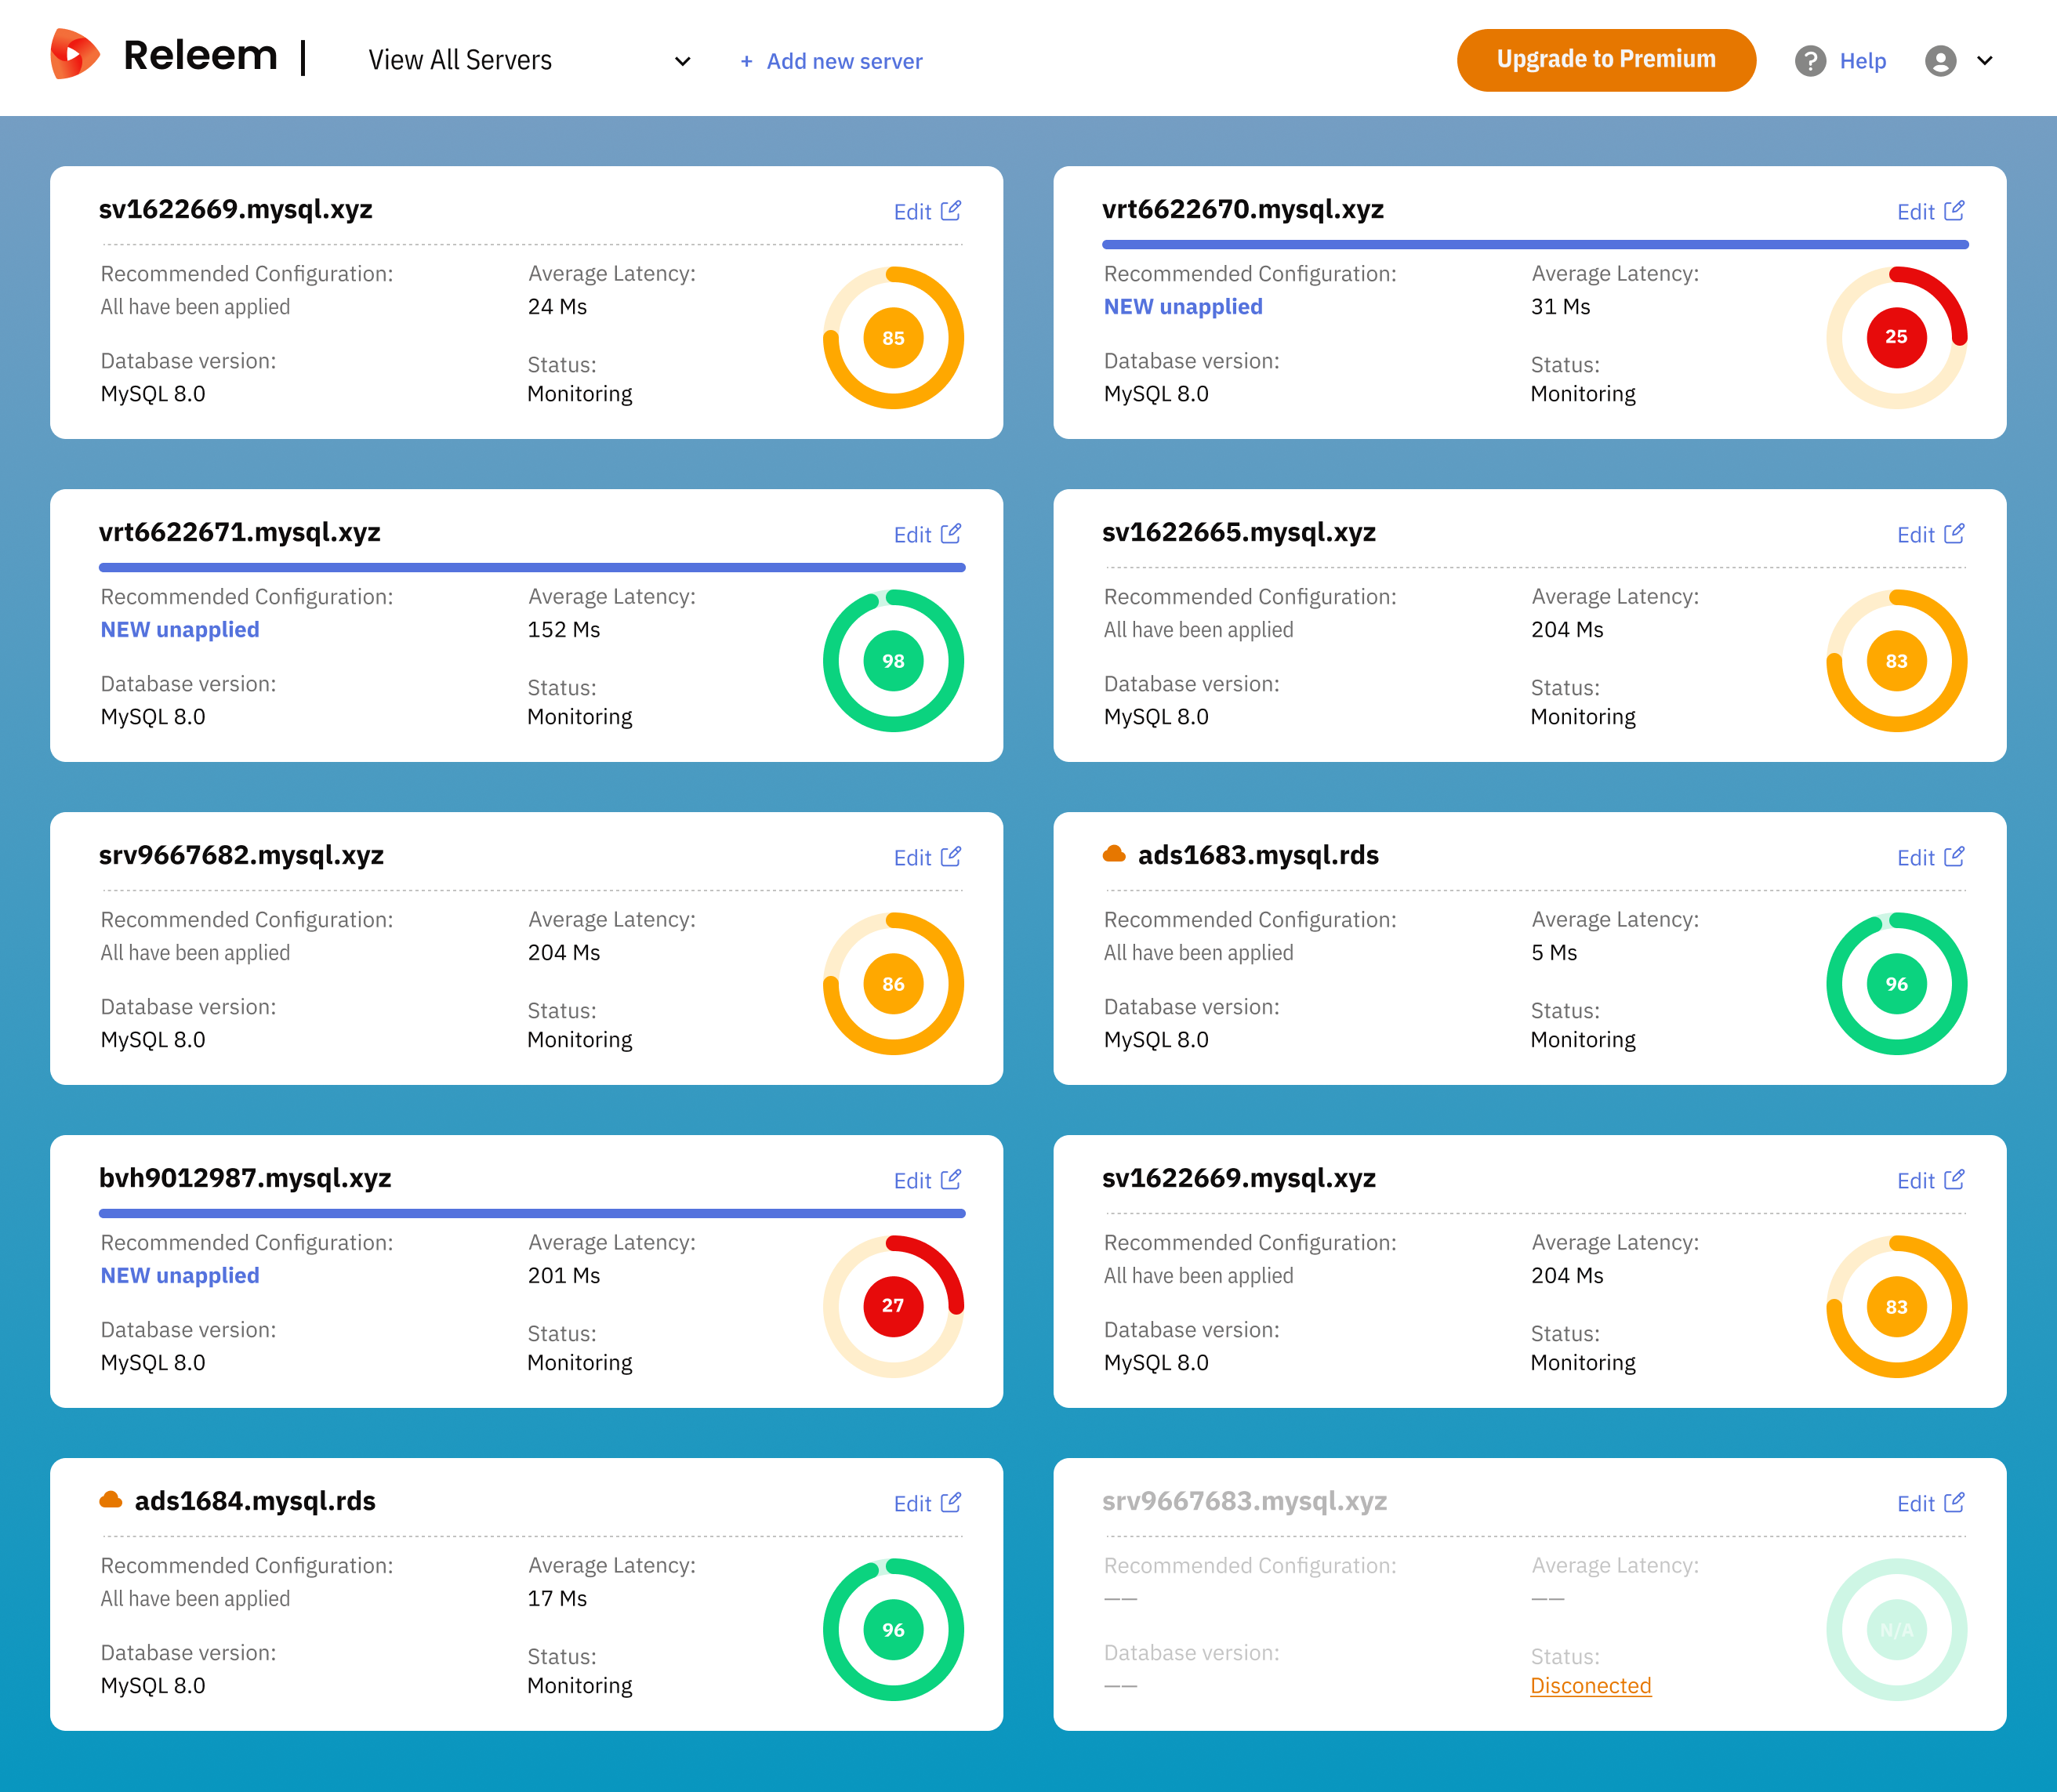
Releem
Score 0.0 out of 10
N/A
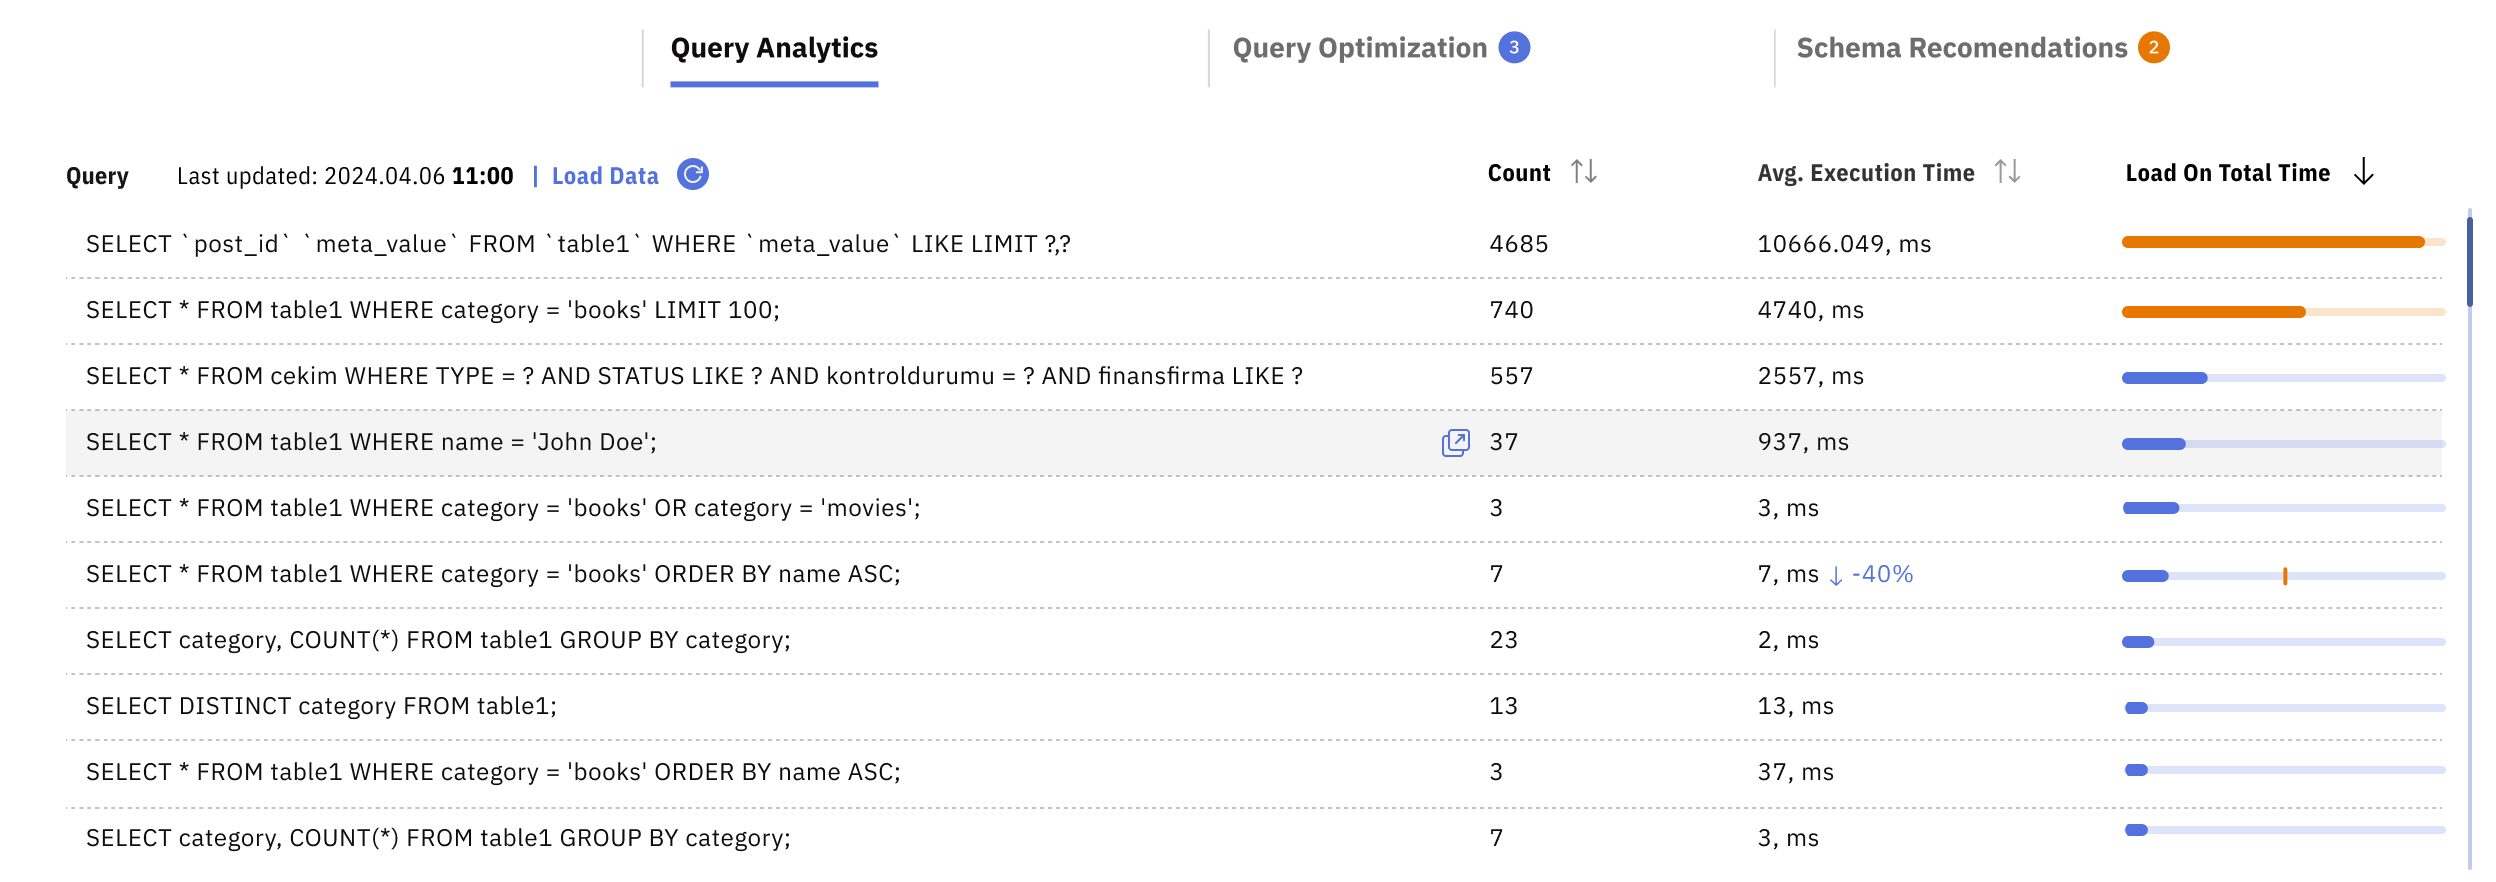
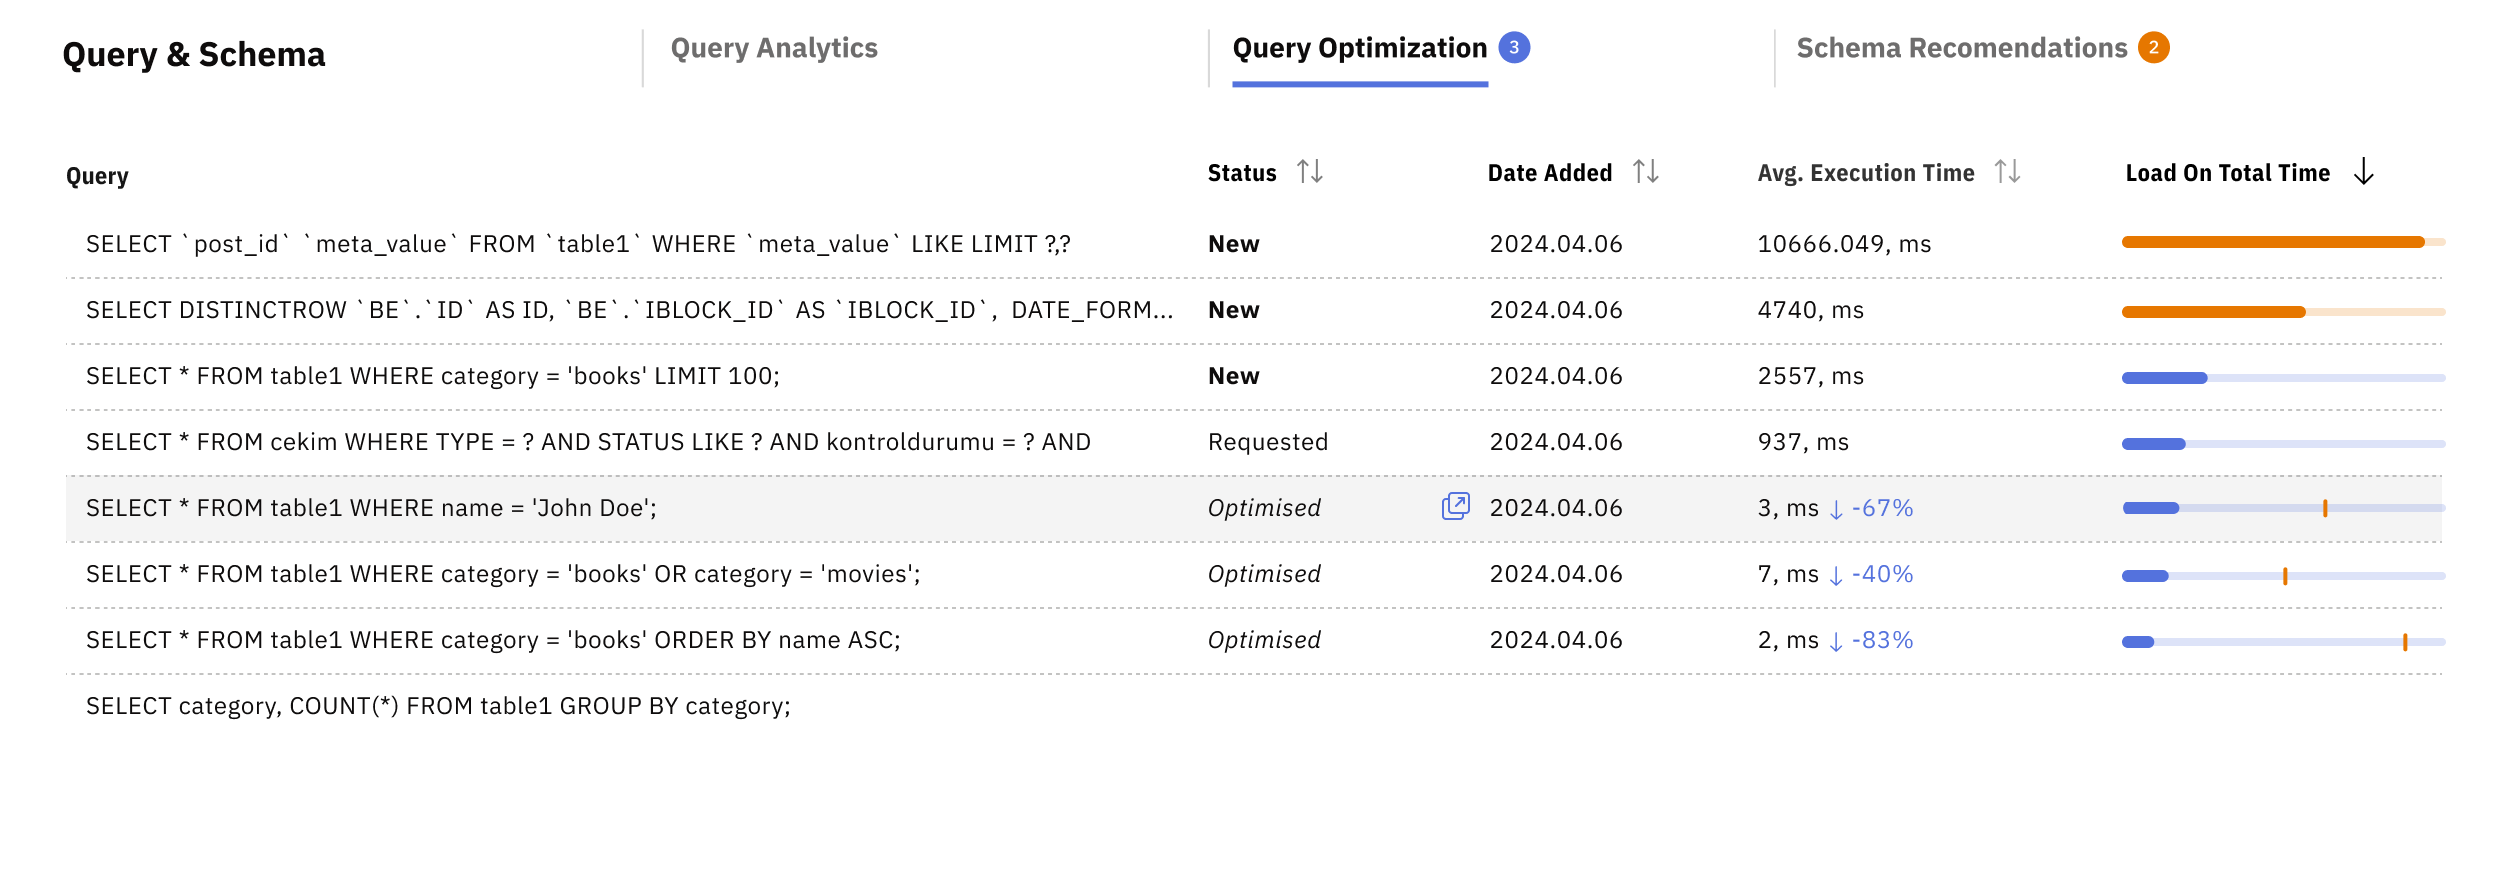
Database performance management was a major pain point for developers: sifting through endless metrics and alerts, calculating variables, dealing with tons of documentation, query optimization, and index management.
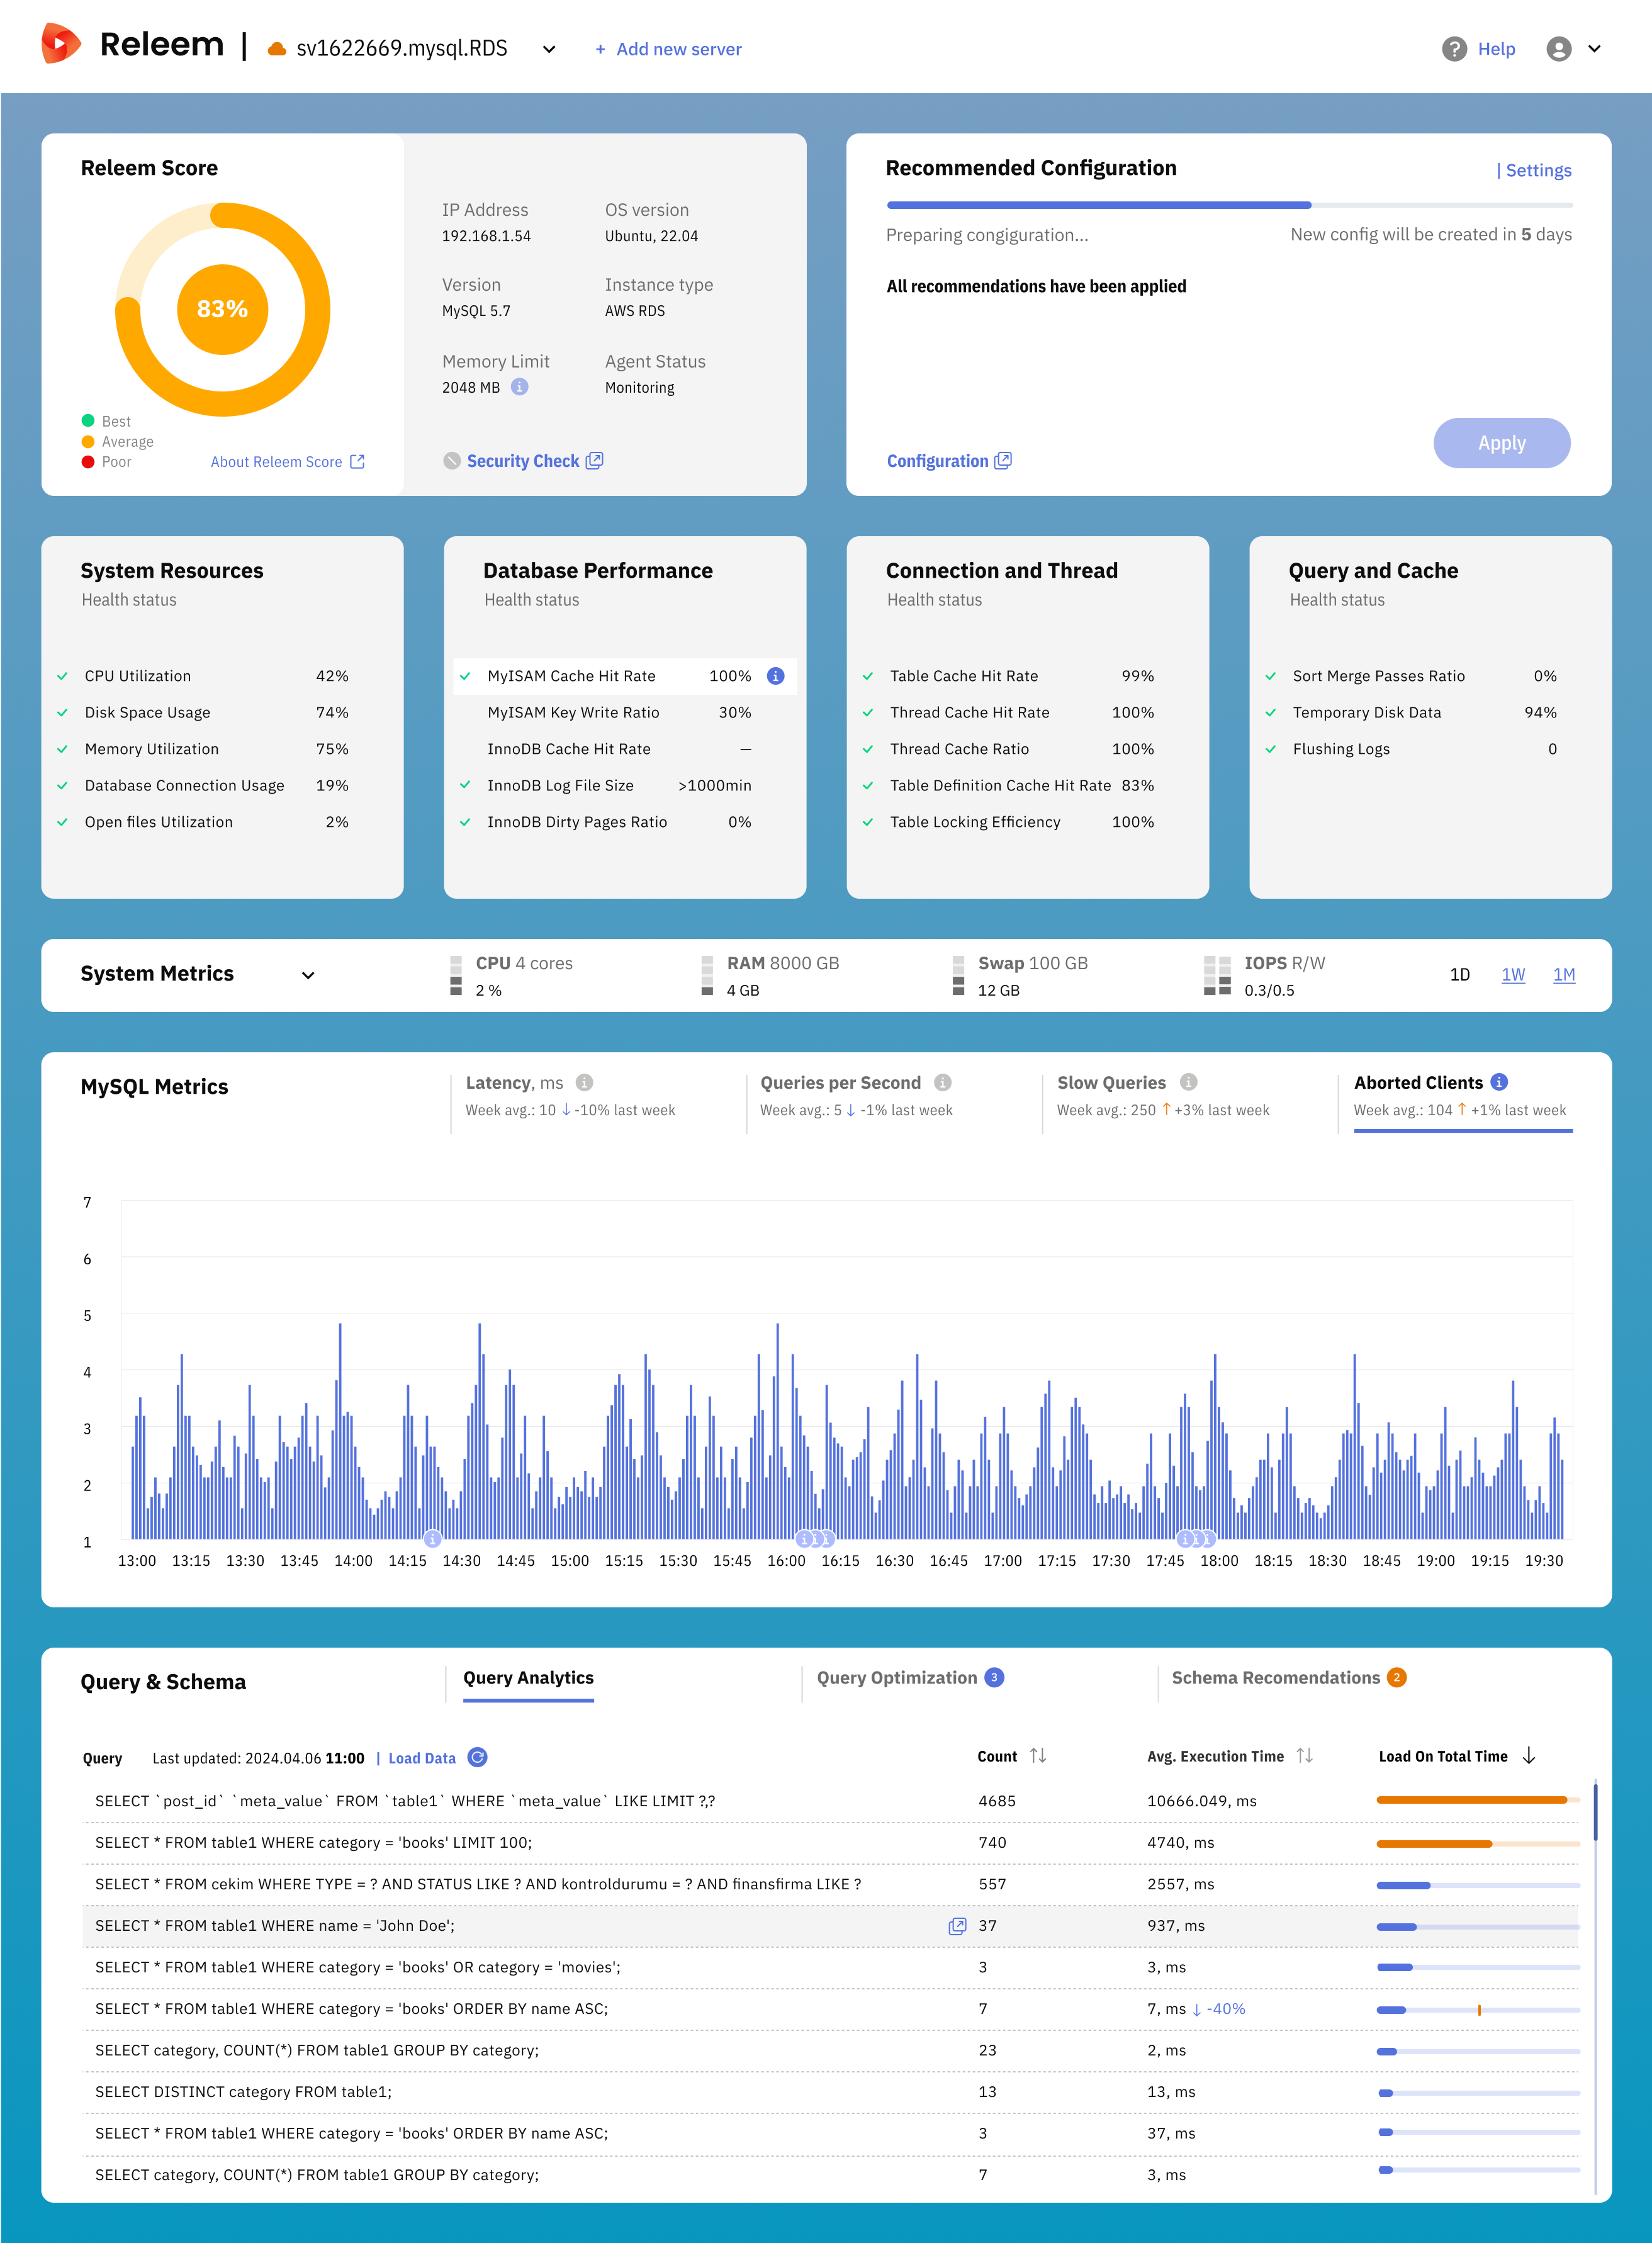
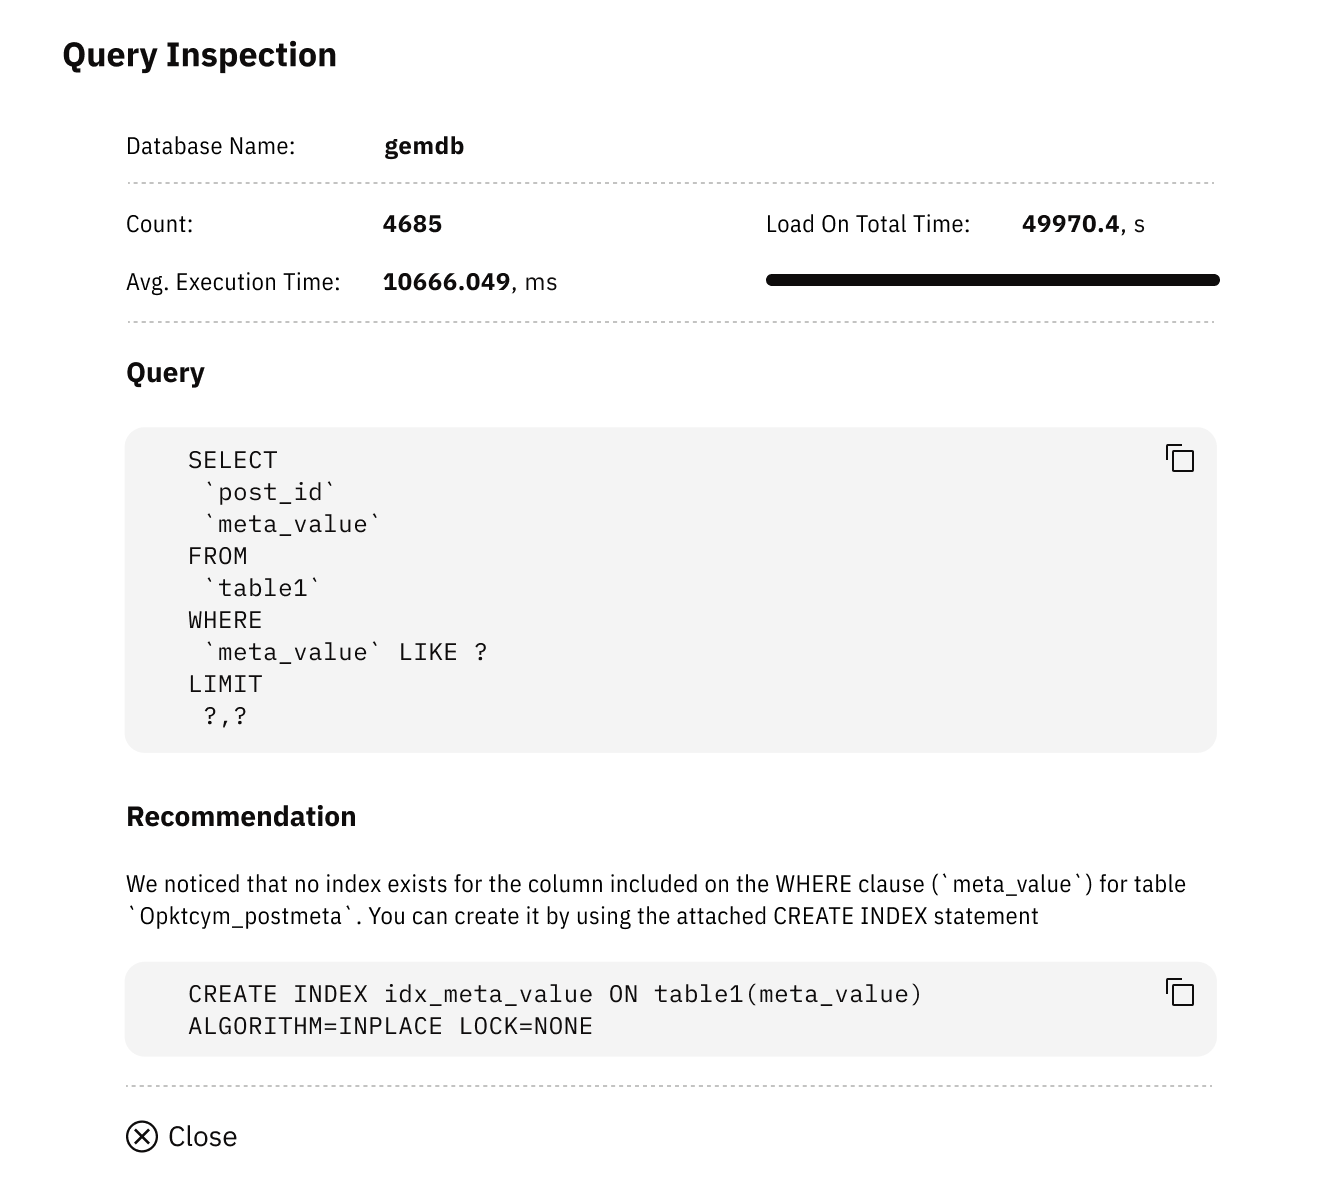
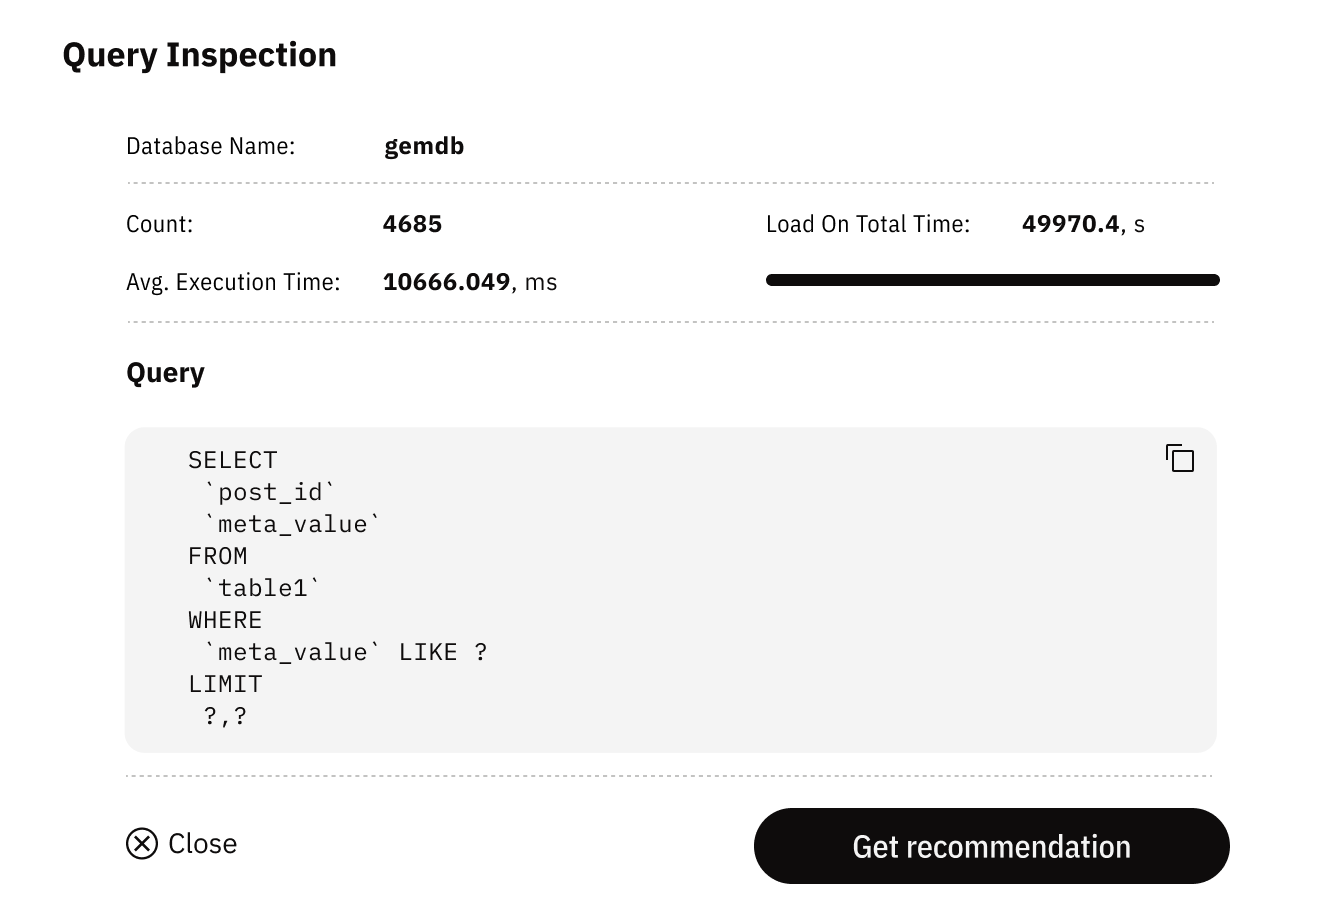
Releem is an AI-powered MySQL performance monitoring tool that helps keep database servers fast, secure and reliable.
According to the vendor, its features beyond database performance monitoring and management include:
📊 Quick and simple to use with all the…
$0
per month 1 DB instance
Pricing
Datadog
Releem
Editions & Modules
Log Management
$1.27
per month (billed annually) per host
Infrastructure
$15.00
per month (billed annually) per host
Standard
$18
per month per host
Enterprise
$27
per month per host
DevSecOps Pro
$27
per month per host
APM
$31.00
per month (billed annually) per host
DevSecOps Enterprise
$41
per month per host
Free
$0
per month 1 DB instance
Premium
$79
per database/month Upgrade up to 9 DB instances
BUSINESS
Contact Sales
> 4 DB instances
BUSINESS
Contact us
> 4 DB instances
Offerings
Pricing Offerings
Datadog
Releem
Free Trial
Yes
Yes
Free/Freemium Version
Yes
Yes
Premium Consulting/Integration Services
No
No
Entry-level Setup Fee
Optional
Optional
Additional Details
Discount available for annual pricing. Multi-Year/Volume discounts available (500+ hosts/mo).
25% discount for annual plan.
More Pricing Information
Community Pulse
Datadog
Releem
Considered Both Products
Datadog
Verified User
Anonymous
Chose Datadog
In terms of usability, I’ve found Datadog significantly more approachable and powerful compared to Elasticsearch, especially for day-to-day operational monitoring. Datadog offers a much more cohesive, user-friendly interface out of the box, with built-in support for metrics, …
Datadog is an all in one solution. It has everything in one place so you don't have to go from application to application and try to figure out what exactly happened. No more stitching database errors from one third party to backend errors in another to front end errors in …
Datadog crushed the competition on price and offering more solutions in one product cutting down on implementation time and effort while ensuring that the "integration" between one of their offerings was completely compatible with any of the others. I'm sure it's not the case …
We've completely replaced New Relic with Datadog and find it easier to use and more comprehensive. Our AWS and Sentry usage will continue for now. But Datadog gives us a much broader coverage - we can monitor our AWS services and many other services that interact with them. …
Dynatrace was cheaper but, in my opinion, its setup, features, and overall user experience do not come close to what Datadog can offer, making it more of a pain to use and not worth the cheaper cost over Datadog (especially if migrating away from Datadog to dynatrace).
The first reason for selecting Datadog was of course it's pricing which is quite better in terms of competitor like Appdynamics and splunk. Second thing is versatile services which they are offering on one platform which means entire end to end services can be monitor at one …
It's a one-stop solution for all our needs whereas in other open-source tools, we have an operational overhead to keep and manage the uptime of these tools as well and also manage their versioning, upgrade, and patching cycle. Also if there are any bugs then we have to raise an …
One of the most important reason is single agent configuration for all kinds of monitoring. It also proved an auto upgrade feature of agents that reduces the overhead. It also provides range of options when it comes to data visualization and dashboards. It also provide tagging …
Kubernetes with Prometheus and other open-source options. It is prone to more toil to set up but the stack can be largely replicated in open source technologies.
New Relic was a good tool but had really pushy salespeople. They also released a product called infrastructure recently, and it was worse than their previous product (servers). The previous product was also free! Needless to say, we will not be going back to New Relic any time …
Easier to set up and integrate with other auxiliary tools. The cost was also a benefit along with self-service capabilities. We could set up Data Dog by ourselves, versus needing to bring additional consulting efforts to setup Dynatrace. Reliability of results (less false …
Ultimately, Datadog had the most already-built bridges into our existing infrastructure -- third parties that we're using for certain services are far more likely to work with Datadog than other systems. This means that, while expensive, Datadog has done a tremendous amount of …
Datadog has been harder to setup out-of-the-box compared to its alternatives, although it's graphs and dashboards have been more useful. Other tools handle individual tasks better. For example, Splunk has been the best logging tool I've used, and New Relic is great for CPU and …
It has been easier to work with Datadog for all our business needs and get things on their roadmap if we found it lacking. Currently we use a mix of various tools as they were existing prior to Datadog came. We are evaluating new offering like Datadog's latest log management to …
I am listing how Datadog is better than below chosen NotSensu - Datadog has more integrations and easy to use UI. Prometheus - Datadog Integration are more in number than, simple installation process
We are still trying other products, but people still like Datadog. After setting up a dashboard, it's great for monitoring instances on Datadog. Also, the DevOps team had a good time setting up Datadog. It means Datadog was way easier to set up compared to those others.
Geckoboard has nice dashboard options, however their third party system support isn't as strong as Datadog. Geckoboard did not support all the various server and development systems we use, whereas Datadog did. Also, Datadog has better alerting and monitoring options than …
Datadog empowers us to create dashboards and visualize the state of our infrastructure in real time. It gives us control over what we want to view and how. The graphs provide deep insight into trends and anamoly detectives. These features are lacking in some of the other …
A one-stop solution for everything you need. Multiple functionalities are tailored to meet specific business needs. Logs are essential for any business, and Datadog manages logs effectively. Rum sessions are something new to me and have given us a new perspective on how to reverse engineer issues that we see for our customers.
Alert windows cause lag in notifications (e.g. if the alert window is X errors in 1 hour, we won't get alerted until the end of the 1 hour range)
I would appreciate more supportive examples for how to filter and view metrics in the explorer
I would like a more clear interface for metrics that are missing in a time frame, rather than only showing tags/etc. for metrics that were collected within the currently viewed time frame
Datadog's user interface is quite friendly and easy to navigate. With menus clearly categorized, and ability to bookmark important dashboards, one can easily find what they're looking for. For dashboards, ability to move and resize visualizations and group them, is really helpful to organize dashboards. Automatic suggestions from Datadog for important visualizations based on the metrics and logs would provide another level of ease of use.
The support team usually gets it right. We did have a rather complicate issue setting up monitoring on a domain controller. However, they are usually responsive and helpful over chat. The downside would be I don’t think they have any phone support. If that is important to you this might not be a good fit.
I selected Datadog because of its features and the wide range of integration support. As I already told it supports more that 600+ integrations which helps and organization to keep everything in a single place and also its AI feature which is reducing the time for root cause analysis. Its custom dashboards features which helps us to visualize the data in a more attractive way.