Chose Entrinsik Informer
N/A

| Product | Rating | Most Used By | Product Summary | Starting Price |
|---|---|---|---|---|
 Entrinsik Informer | N/A | Entrinsik Informer is a web-based reporting and business intelligence application popular in the higher education vertical market. It helps organizations transform real-time data into actionable information by delivering ad-hoc reporting, data analysis, and interactive dashboards. | N/A | |
 SAP Analytics Cloud | N/A | The SAP Analytics Cloud solution brings together analytics and planning with integration to SAP applications and access to heterogenous data sources. As the analytics and planning solution within SAP Business Technology Platform, SAP Analytics Cloud supports trusted insights and integrated planning processes enterprise-wide to help make decisions without doubt. | $36 per month per user |
| Entrinsik Informer | SAP Analytics Cloud | |||||||||||||||
|---|---|---|---|---|---|---|---|---|---|---|---|---|---|---|---|---|
| Editions & Modules | No answers on this topic |
| ||||||||||||||
| Offerings |
| |||||||||||||||
| Entry-level Setup Fee | No setup fee | No setup fee | ||||||||||||||
| Additional Details | — | A 30-day trial with SAP Analytics Cloud is available, supporting analytics enterprise-wide. A trial can be extended up to 90 days on request. | ||||||||||||||
| More Pricing Information | ||||||||||||||||
| Entrinsik Informer | SAP Analytics Cloud | |
|---|---|---|
| Considered Both Products | Entrinsik Informer  Karen Brenneman Director of Technical Information Resources Chose Entrinsik Informer I really liked using the Query Builder that was once part of our Colleague system; however, it really relied on power users to provide the information to the campus. As Query Builder was phased out, our campus moved to Informer. The switch over was very successful. For most end …  Brian Pollitt Programmer/Database Administrator Chose Entrinsik Informer We needed to implement a new reporting tool due to Query Builder being eliminated. We went with Entrinsik Informer because it was already being used at some other Colleges that were also using Datatel/Ellucian Colleague, and the reviews from those Colleges were very positive. A …  Ed McClusky Manager of Administrative Computing Chose Entrinsik Informer Entrinsik Informer was chosen because of it's real-time reporting capability from Unidata.  Kate Goldberg Director of Advancement Services Chose Entrinsik Informer My OIT office hasn't provided any other similar tool. Prior to Intrinsik, we typed script into the interface! Any reports were custom programmed by the programmers in OIT.  Kristyn Lederer Database Administrator Chose Entrinsik Informer Infomaker,Crystal Reports,Microsoft Query Analyzer  Timothy Smalarz Associate Registrar Chose Entrinsik Informer Easily Informer is one the most valuable reporting tools available in higher education.  Christopher Jones Director- IT Solutions Consulting and Information Management Chose Entrinsik Informer We use Informer with Ellucian Colleague instead of Ellucian's solutions which were substandard when we implemented Informer and remain unattractive for a variety of reasons with the standouts being cost and support. Informer is a fraction of the cost and the admin …  Sarah Gaither Accountant Chose Entrinsik Informer The closet thing we had to Informer before was something called Query Builder. However, unless you were really good at coding and technology, it was like reading greek to the basic user of our system. Informer provides such an easy user experience that most people who were …  Amanda Curran Business Application Specialist Chose Entrinsik Informer Informer is more cost effective and easier to teach end users to write their own reports, but it still provides just as much functionality as the other products I've used. Informer is easy to manage and administer with a small number of IT employees per number of end users.  Bryan Horstman Information Systems Administrator and DBA Chose Entrinsik Informer We have not evaluated any other products. Previously we simply used Unidata to create report.  Donald Beck Director, Information Technology Services Chose Entrinsik Informer Crystal Reports with UniDATA ODBC. This works quite well but is cumbersome to set up and maintain. This required several steps outside the UniDATA database as well as setting up security views and a variety of processes that have to be monitored more closely. No other systems …  Florante Roa Director, Systems Management & MIS Operations Chose Entrinsik Informer Informer is a complete solution. |  SAP Analytics Cloud  Sandesh Pasari Marketing manager Chose SAP Analytics Cloud SAP Analytics Cloud stacks better with SAP ERP and this has improved its workability and accuracy.  Amit Goregaonkar Project Manager SAP Chose SAP Analytics Cloud SAP Analytics Cloud and Power BI are both tools that help businesses understand their data, but they have some differences. SAC, made by SAP, works well if your company already uses other SAP products. It's in the cloud, easy to use, and has features for analyzing data, getting …  Breno Fukuda de Almeida CUSTOMER DEVELOPMENT MANAGER Chose SAP Analytics Cloud It was a corporate decision that will serve all hubs in the world to gain scalability. Once a gain, one fits all.  Rajender Singh Senior PLM engineer Chose SAP Analytics Cloud SAP Analytics Cloud has the largest user base in the manufacturing field because of its service.  Anne Helin Senior Manager, RTR Chose SAP Analytics Cloud Data models are familiar and no additional reconciliations needed  Syed Fahad Hussain IT Busniess Partner_HR Chose SAP Analytics Cloud We select SAP Analytics Cloud due to meet our all dashboards need, data integration, enrich option of modern data visualization, instant & enhance user experience. Agile supply chain planning and forecast easily doable from SAP Analytics Cloud. finally these all aspect make us … |
| Entrinsik Informer | SAP Analytics Cloud | ||||||||||||||||||
|---|---|---|---|---|---|---|---|---|---|---|---|---|---|---|---|---|---|---|---|
| BI Standard Reporting |
| ||||||||||||||||||
| Ad-hoc Reporting |
| ||||||||||||||||||
| Report Output and Scheduling |
| ||||||||||||||||||
| Data Discovery and Visualization |
| ||||||||||||||||||
| Access Control and Security |
| ||||||||||||||||||
| Mobile Capabilities |
| ||||||||||||||||||
| Application Program Interfaces (APIs) / Embedding |
|
| Entrinsik Informer | SAP Analytics Cloud | |
|---|---|---|
| Small Businesses |  BrightGauge Score 9.1 out of 10 | BrightGauge Score 9.1 out of 10 |
| Medium-sized Companies |  Reveal Score 10.0 out of 10 | Reveal Score 10.0 out of 10 |
| Enterprises |  Kyvos Semantic Intelligence Layer Score 9.9 out of 10 | Kyvos Semantic Intelligence Layer Score 9.9 out of 10 |
| All Alternatives | View all alternatives | View all alternatives |
| Entrinsik Informer | SAP Analytics Cloud | |
|---|---|---|
| Likelihood to Recommend | 10.0 (0 ratings) | 8.2 (0 ratings) |
| Likelihood to Renew | 8.7 (0 ratings) | 7.8 (0 ratings) |
| Usability | 9.1 (0 ratings) | 8.0 (0 ratings) |
| Availability | 9.1 (0 ratings) | - (0 ratings) |
| Performance | 8.3 (0 ratings) | - (0 ratings) |
| Support Rating | 10.0 (0 ratings) | 5.6 (0 ratings) |
| In-Person Training | - (0 ratings) | 9.0 (0 ratings) |
| Online Training | 7.3 (0 ratings) | - (0 ratings) |
| Implementation Rating | 9.0 (0 ratings) | 2.0 (0 ratings) |
| Product Scalability | 7.1 (0 ratings) | - (0 ratings) |
| Entrinsik Informer | SAP Analytics Cloud | |
|---|---|---|
| Likelihood to Recommend |
|
|
| Pros |
Brian Pollitt Programmer/Database Administrator |
|
| Cons |
|
|
| Likelihood to Renew |
|
|
| Usability |
|
|
| Reliability and Availability |
|
|
| Performance | No answers on this topic |
|
| Support Rating |
Ed McClusky Manager of Administrative Computing |
 Gauri Hiremath Consultant |
| In-Person Training | No answers on this topic |
 Dharmesh Shah Senior BI Architect |
| Online Training | No answers on this topic |
|
| Implementation Rating |
|
 Pablo Ugalde Otero Copilot |
| Alternatives Considered |
|
Amit Goregaonkar Project Manager SAP |
| Scalability | No answers on this topic |
|
| Return on Investment |
Amanda Curran Business Application Specialist |
|
| ScreenShots | Entrinsik Informer Screenshots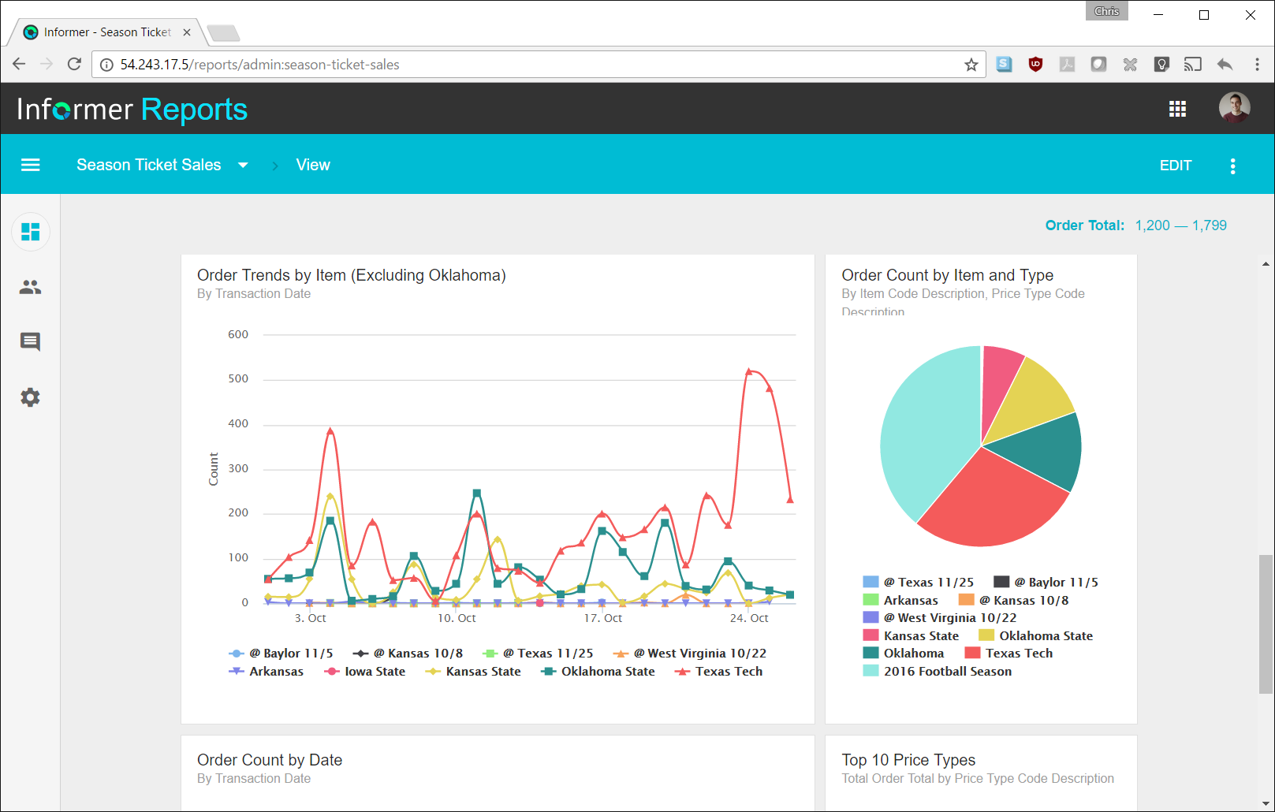   |