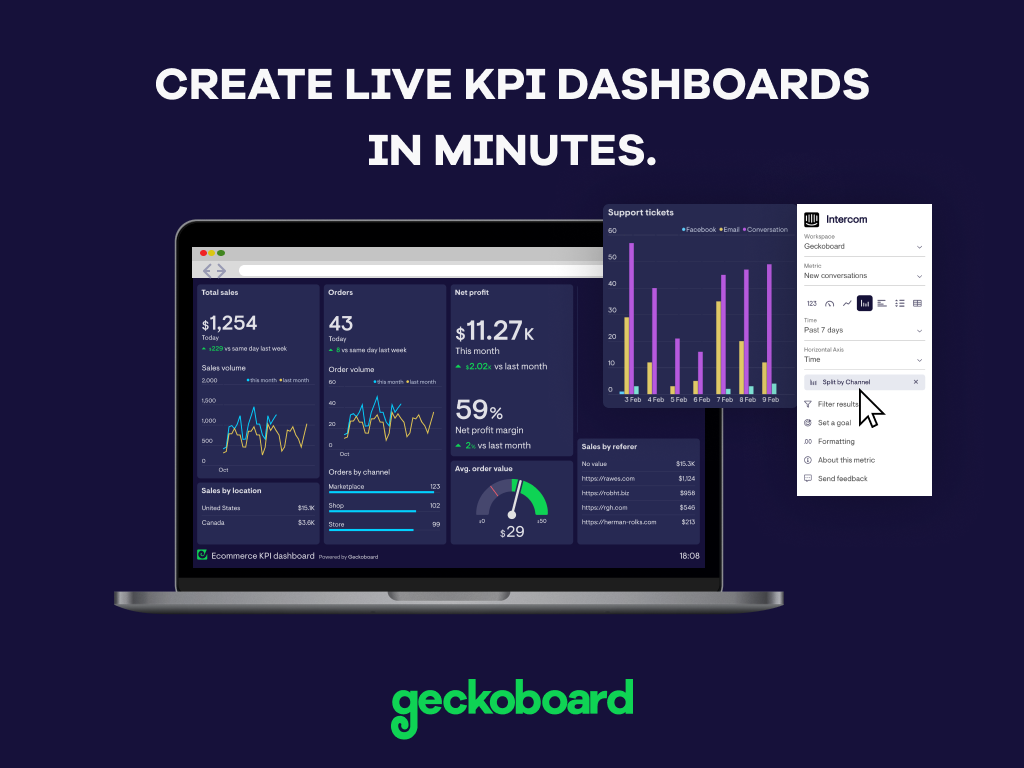
Geckoboard enables users to create real time dashboards using data from over 80 cloud services. It integrates with other products such as: AWeber, Basecamp, Campaign Monitor and HubSpot.
$35
per month
Grafana
Score 8.7 out of 10
N/A
Grafana is a data visualization tool developed by Grafana Labs in New York. It is available open source, managed (Grafana Cloud), or via an enterprise edition with enhanced features. Grafana has pluggable data source model and comes bundled with support for popular time series databases like Graphite. It also has built-in support for cloud monitoring vendors like Amazon Cloudwatch, Microsoft Azure and SQL databases like MySQL. Grafana can combine data from many places into a single dashboard.
$8
per month up to 1 active user
Pricing
Geckoboard
Grafana
Editions & Modules
Starter
$35
per month
Team
$159
per month
Team Plus
$275
per month
Company
$599
per month
Grafana Cloud - Pro
$8
per month up to 1 active user
Grafana Cloud - Free
Free
10k metrics + 50GB logs + 50GB traces up to 3 active users
Grafana Cloud - Advanced
Volume Discounts
custom data usage custom active users
Grafana - Enterprise Stack
Custom Pricing
Offerings
Pricing Offerings
Geckoboard
Grafana
Free Trial
Yes
Yes
Free/Freemium Version
Yes
Yes
Premium Consulting/Integration Services
No
No
Entry-level Setup Fee
No setup fee
No setup fee
Additional Details
—
—
More Pricing Information
Community Pulse
Geckoboard
Grafana
Considered Both Products
Geckoboard
Verified User
Anonymous
Chose Geckoboard
We are a Google shop and our Analytics and Reporting team have and use GDS. However, Geckoboard can output some of the same types of data (albeit maybe not as granular) and can be used by a wide swath of our users (including project managers, account execs, developers, etc.). …
I find Geckoboard and Klipfolio to be in parallel in terms of performance and presentation. I will say that Klipfolio pulls slightly ahead as it allows for custom branding (great when sharing data with external stakeholders) and having access/edit control based on roles.
Business Analyst (Business Development/Market Valuation)
Chose Geckoboard
Geckoboard is a great dashboard that offers value and simplicity. It is easy to train and use right away. The other systems are more expensive but offer more details.
Grafana is more flexible, readily adopts other tools frameworks instead of forcing you to use their agent, doesn't force you into Vendor lock-in, and embraces open source, self-hosted, and Enterprise. Similar companies would like you to use their specific tooling and don't …
Grafana gives more flexibility to explore its features. A new user can explore experiment and work with free Grafana account and find if it is suitable for them.Other platforms don't have the features in their freemium version that Grafana has. It lets us try features of …
Grafana has a direct plugin to Icinga monitoring solution and allowed for easy configuration for us. At the time of implementation, other services did not have such an integration. As we already had a very customized and heavily introduced monitoring solution in place, we …
Grafana blows Nagios out of the water when it comes to customization. The ability to feed almost any data source makes it very versatile and the cost is great.
A beautiful UI, with visuals that interest even those that hate staring at data. It's well suited for small to medium-sized businesses/corporations in which high-level sharing of data between teams is required -- the larger the distance between teams, the better as it's a great tool for level-setting on complex data. It would be less appropriate for small businesses, or those that do not need to summarize complex data to share with those not familiar with the data source
Just about any organization with more than one server and more than one cluster as it scales very well. Configuration of the application takes time and finesse to fine tune to where the balance of load time and getting data quickly meets. The plugins add load time but fine tuning for the application to meet demand needs nailed down at implementation
With a simple interface and available templates, creating basic dashboards is easy. Obviously depending on the data you want to visualize, there may be higher learning curves. That being said, they have a huge amount of integrations and extensible frameworks. If you are using anything made in the past ten years there is an API function or integration that can get it talking to the platform. As such, it's pretty easy to hit the main data points you want and get it on a cheap display in front of your team.
Great usage in terms of monitoring of any application from backend to frontend and even any AWS resource via cloud watch and other connectors. Easy to use and configure personalised dash boarding and alerting features. Cost efficient and easy to setup and run, no mazor scaling challenges in terms of managing and maintaining the stack, easy to configure via Prometheus, influx and other connectors
The support levels vary based on the level of plan that you have but that's to be expected. Virtually everything except the Enterprise plan has basic chat/email support. While they are responsive they are not going to be much assistance in helping you figure out API calls or implementing 3rd party integrations. That is to be expected and the support community can pretty much get you in the right direction if you look.
We are a Google shop and our Analytics and Reporting team have and use GDS. However, Geckoboard can output some of the same types of data (albeit maybe not as granular) and can be used by a wide swath of our users (including project managers, account execs, developers, etc.). We can also save and reuse boards for similar products and get our data in front of the eyes that need to see it quickly without a lot of fuss.
Grafana is more flexible, readily adopts other tools frameworks instead of forcing you to use their agent, doesn't force you into Vendor lock-in, and embraces open source, self-hosted, and Enterprise. Similar companies would like you to use their specific tooling and don't offer nearly as much flexibility. The other thing I like about Grafana is their storage usage is much lower compared to similar tools and competitors
While we originally used this as an internal IS tool, we eventually have expanded it to be used by nearly every department.
Because pricing is monthly, we can grow or decrease our usage based on our current client needs.
Because it is low cost and easy to deploy, we can utilize it in place of considerable resources in analytics and reporting by delivering snapshots of data without pulling reports.