Google Charts provides a way to visualize data on your website - for free. From simple line charts to complex hierarchical tree maps, the chart gallery provides a large number of ready-to-use chart types. The most common way to use Google Charts is with simple JavaScript that you embed in your web page.
N/A
Yurbi
Score 8.0 out of 10
N/A
Yurbi is a business intelligence solution that is designed to bridge the gap between business users and intelligent data. It provides the business user with the ability to connect, secure, and collaborate with data to make better business decisions. According to the vendor, Yurbi brings the powerful reporting and analytical capabilities of traditional BI, but takes out the coding jargon – so that people can actually use it themselves.
As a 100% HTML5 application, Yurbi gives users and…
$24,000
per year
Pricing
Google Charts
Yurbi
Editions & Modules
No answers on this topic
Yurbi
24,000
per year
Offerings
Pricing Offerings
Google Charts
Yurbi
Free Trial
No
Yes
Free/Freemium Version
Yes
No
Premium Consulting/Integration Services
No
No
Entry-level Setup Fee
No setup fee
No setup fee
Additional Details
—
Yurbi's pricing model is simple and predictable. User licenses start at just $495 per year and that includes all the powerful features of our platform. We offer named users, concurrent users, and public view or anonymous report licensing options. We also offer custom/hybrid pricing for vendors looking to OEM Yurbi.
More Pricing Information
Community Pulse
Google Charts
Yurbi
Features
Google Charts
Yurbi
BI Standard Reporting
Comparison of BI Standard Reporting features of Product A and Product B
Google Charts
8.8
Ratings
8% above category average
Yurbi
-
Ratings
Pixel Perfect reports
8.10 Ratings
00 Ratings
Customizable dashboards
9.50 Ratings
00 Ratings
Report Formatting Templates
8.80 Ratings
00 Ratings
Ad-hoc Reporting
Comparison of Ad-hoc Reporting features of Product A and Product B
Google Charts
9.3
Ratings
14% above category average
Yurbi
-
Ratings
Drill-down analysis
8.60 Ratings
00 Ratings
Formatting capabilities
9.50 Ratings
00 Ratings
Integration with R or other statistical packages
9.50 Ratings
00 Ratings
Report sharing and collaboration
9.60 Ratings
00 Ratings
Report Output and Scheduling
Comparison of Report Output and Scheduling features of Product A and Product B
Google Charts
9.0
Ratings
8% above category average
Yurbi
-
Ratings
Publish to Web
9.50 Ratings
00 Ratings
Publish to PDF
9.60 Ratings
00 Ratings
Report Versioning
8.60 Ratings
00 Ratings
Report Delivery Scheduling
8.70 Ratings
00 Ratings
Delivery to Remote Servers
8.80 Ratings
00 Ratings
Data Discovery and Visualization
Comparison of Data Discovery and Visualization features of Product A and Product B
Google Charts is perfectly suited for most presentations that are data oriented. There's not much of a limit on the type of table or chart you can create, and being able to integrate with Google Sheets just makes things even easier if you've already got the data stored somewhere. It works well on desktop browsers, Iphones, and Android phones. The only drawback I've been able to find is for those that prefer to have a desktop application.
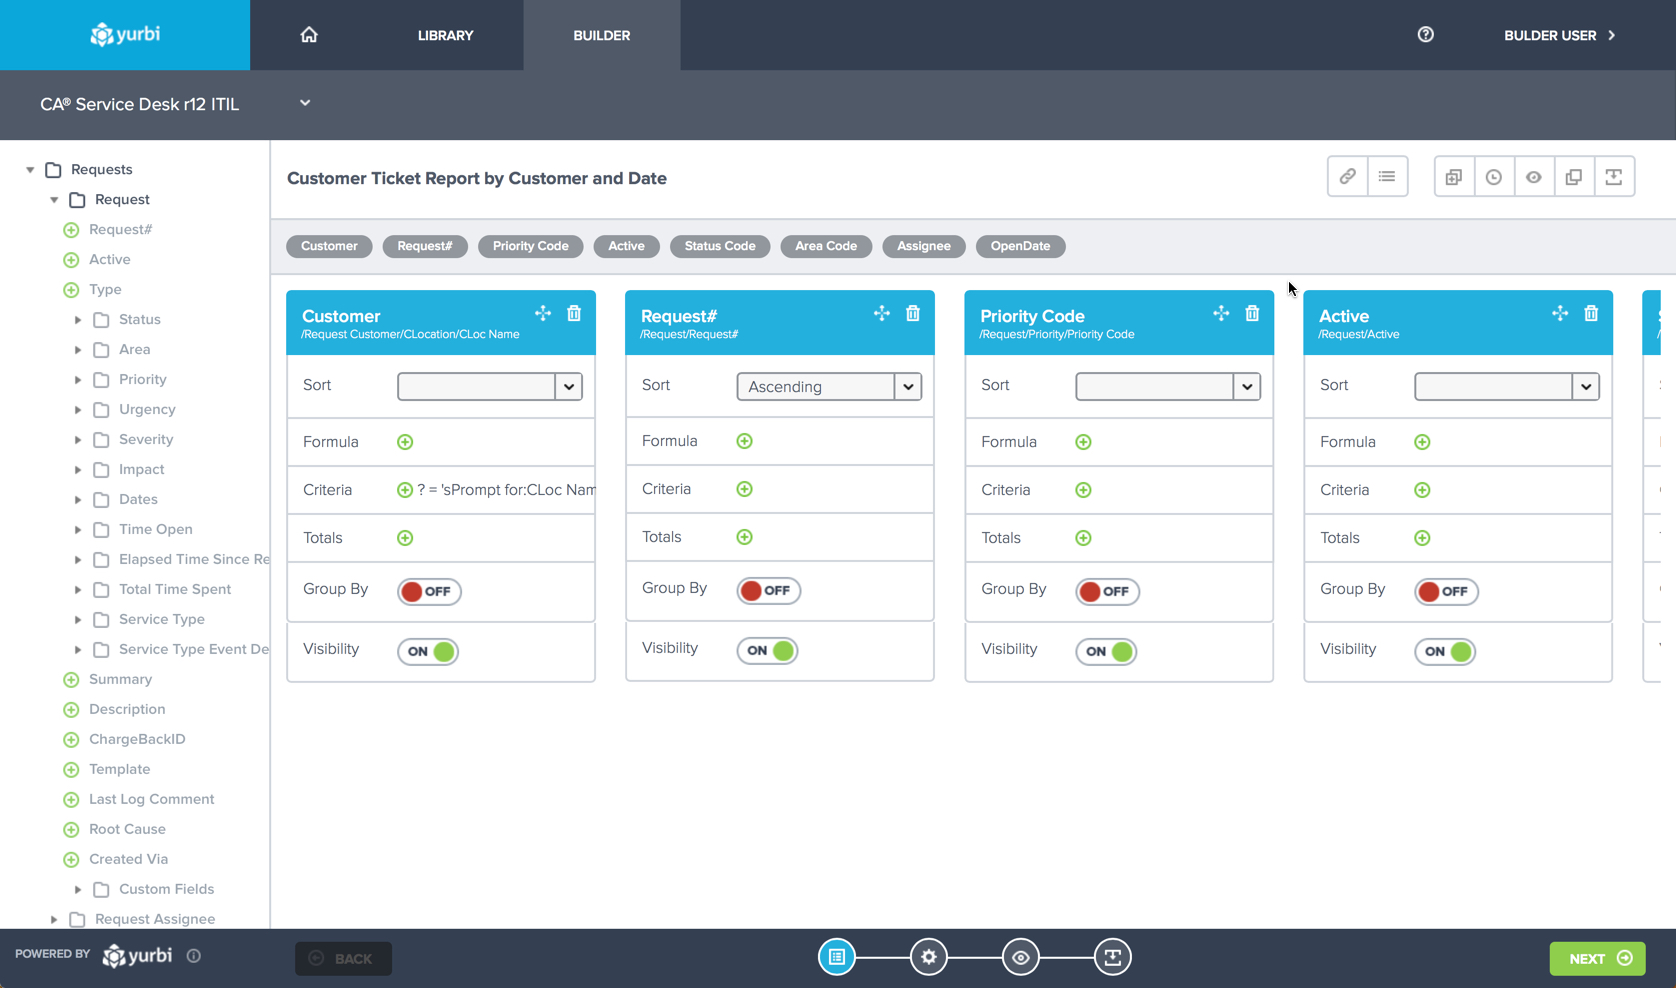
The Yurbi Poduct is extremely well suited for organizations looking for a mature Business Intelligence and ad-hoc reporting tool. The strength of Yurbi is that it is highly customizable and can work in various environments.
Yurbi allows us to build customized Dashboards for specific users. Once the initial Dashboard is created, the user themselves have permissions to customize the Dashboard to suit their needs. The flexibility is there for a wide set of users.
Yurbi product is highly customizable. We looked for a Business Intelligence product for quite some time that could be customized to work with different types of data sets. When we started considering Yurbi, it was evident from the beginning that the product could be customized very quickly to work within our environment and our specific data types.
The Yurbi product stays a step ahead with the changing market being focused more for the tablet and smart phone user population. As our customers first started to use iPADs and iPhones, it was great to see that an upgraded Yurbi product was readily available for use for the iPAD/iPhone set of users.
I would like a couple more introductory videos or a live chat option for when you run into an issue. I think this is a Google-wide problem, not only linked to Google Charts.
I have run into some issues with the Dynamic Data but also admittedly could potentially dive in deeper and investigate.
It would be great if Google Charts made it possible to integrate Google Chat into the platform.
While the Yurbi Developer tool is highly mature, there have been cases where building specific complex reports within Yurbi required extensive support directly from the vendor (and even some Yurbi product customizations). It would be great if the Yurbi Developer tool could be slightly refreshed to make it easier for more non-technical users to build more complex reports within Yurbi.
Over years of usage of the Yurbi product with growing set of available reports to run for users, it's easy to get unorganized in terms of being able to find the correct report to run. It's highly adviseable if future releases of Yurbi began offering features to organize all reports a little better within the product (including an audit trail of reports that users typically run to make it easier for them to go back to the right reports).
We heavily use the SMTP configuration within Yurbi to set up auto-email notifications to specific set of users with requested reports. At times, the SMTP service becomes unavailable and Yurbi product is unable to send these emails to the users. Besides not receiving the email, it's easily evident that the SMTP service connection failed. It would be great if future versions of the Yurbi product would alert the user of the failed SMTP connection on initial Yurbi login so the administrator becomes aware of the issue and can take action to resolve the problem.
Google Charts is a good product. It's widely supported with deep documentation and a large community. But for me, it wasn't customizable enough. When we started with simple charts, it was great, but as we got deeper and more complex, our needs outgrew the library. If I was going forward, I would choose a more barebones library with more freedom and extensibility.
The Yurbi product has been perceived very well by our customers. They have continued to use it for years and the user population has only expanded. Customers love the flexibility and large set of Dashboards and reports that can be made available within the product quickly and efficiently.
Requires knowledge of Javascript, which can be difficult for a beginner. A business analyst often isn't as technically minded as a developer so collaboration is often required to produce a correct chart for the purpose required. However, the customisation capable due to this creates much better looking charts compared to other tools.
The Yurbi product is incredibly easy to use and very intuitive for the user. The environment is highly customizable to the user's own preferences which is the best part.
Google Charts has a very good documentation that we can just go in there and find the stuff we need to implement our solutions on Google Charts. Plus, if we get stuck, we can also email the support and they are very responsive. So overall, the support is very satisfying.
In comparison to Microsoft Power BI, Google Charts has more ease of use for businesses who simply need a way to visually display their data from their reports. Although Power BI may be more robust in more complicated data compilation, Google Charts can still be able to do some of the basics that Power BI delivers.