Grafana Logs (powered by Loki) brings together logs from applications and infrastructure in a single place. By using the exact same service discovery and label model as Prometheus, Grafana Logs can systematically guarantee logs have consistent metadata with metrics. Grafana Logs lets users send logs in any format, from any source so it’s easy to add to existing infrastructure and get up and running quickly. Leverage a wide array of clients for shipping logs like…
N/A
LogPoint
Score 3.7 out of 10
N/A
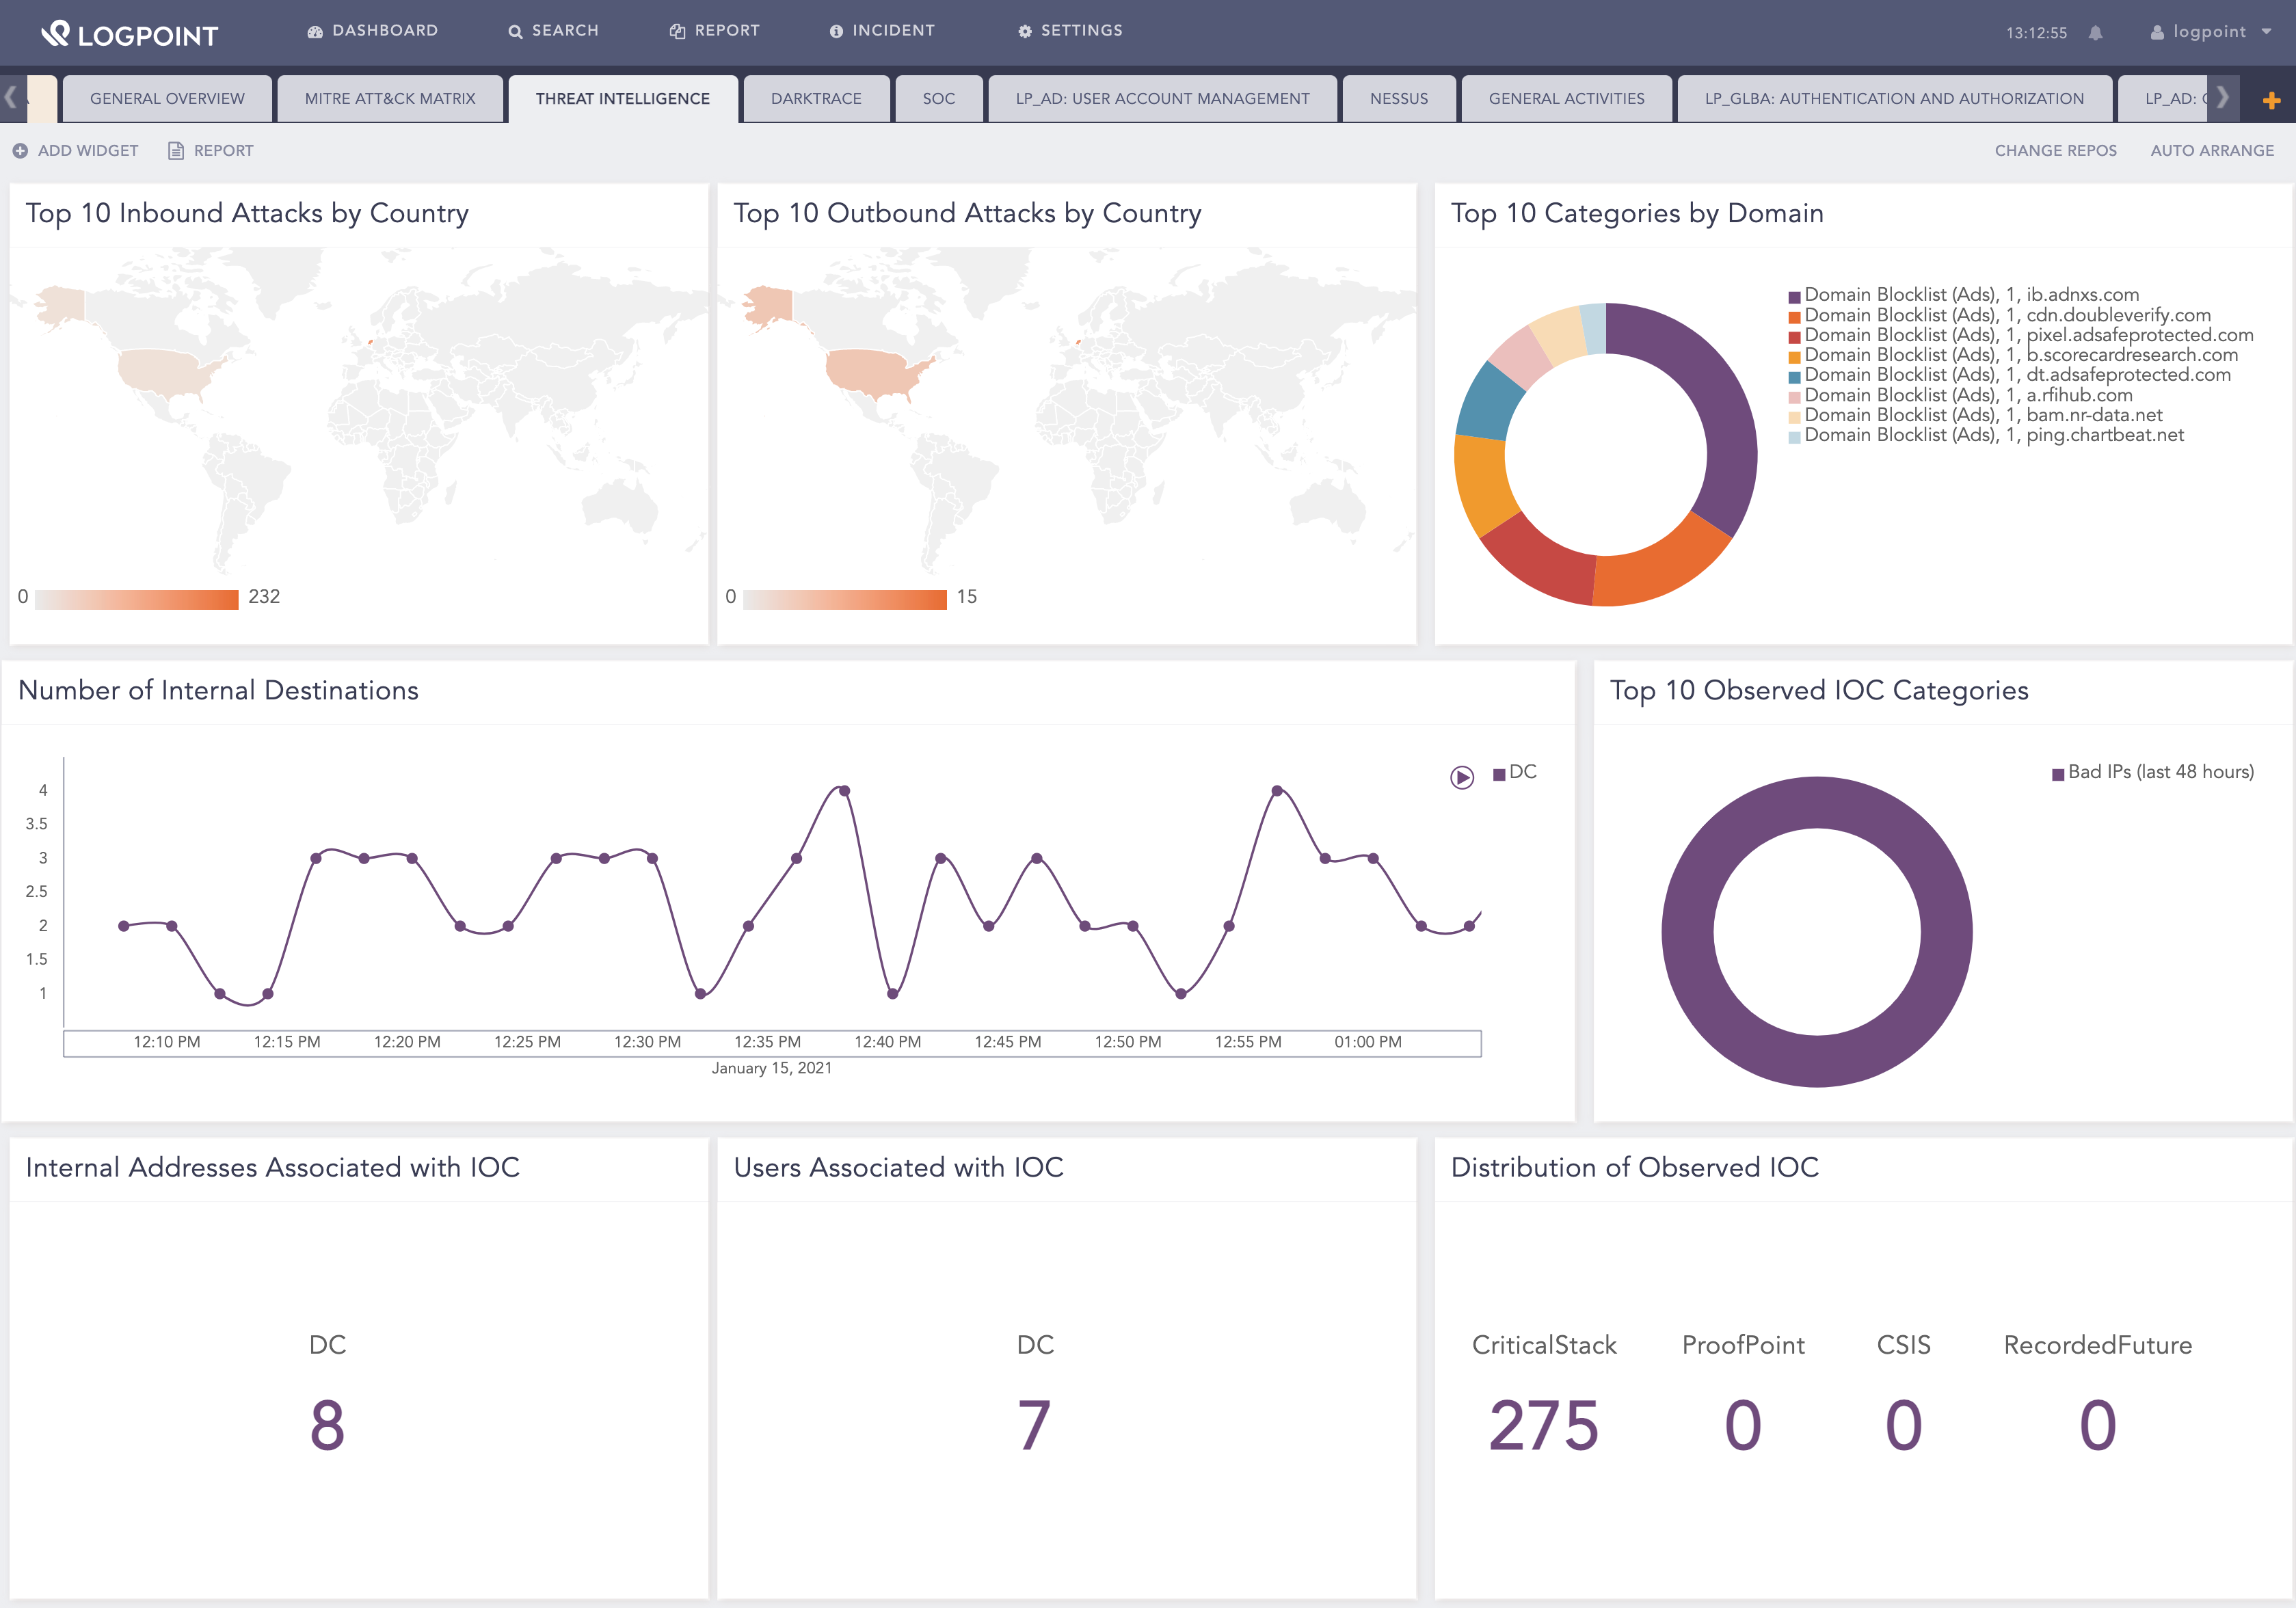
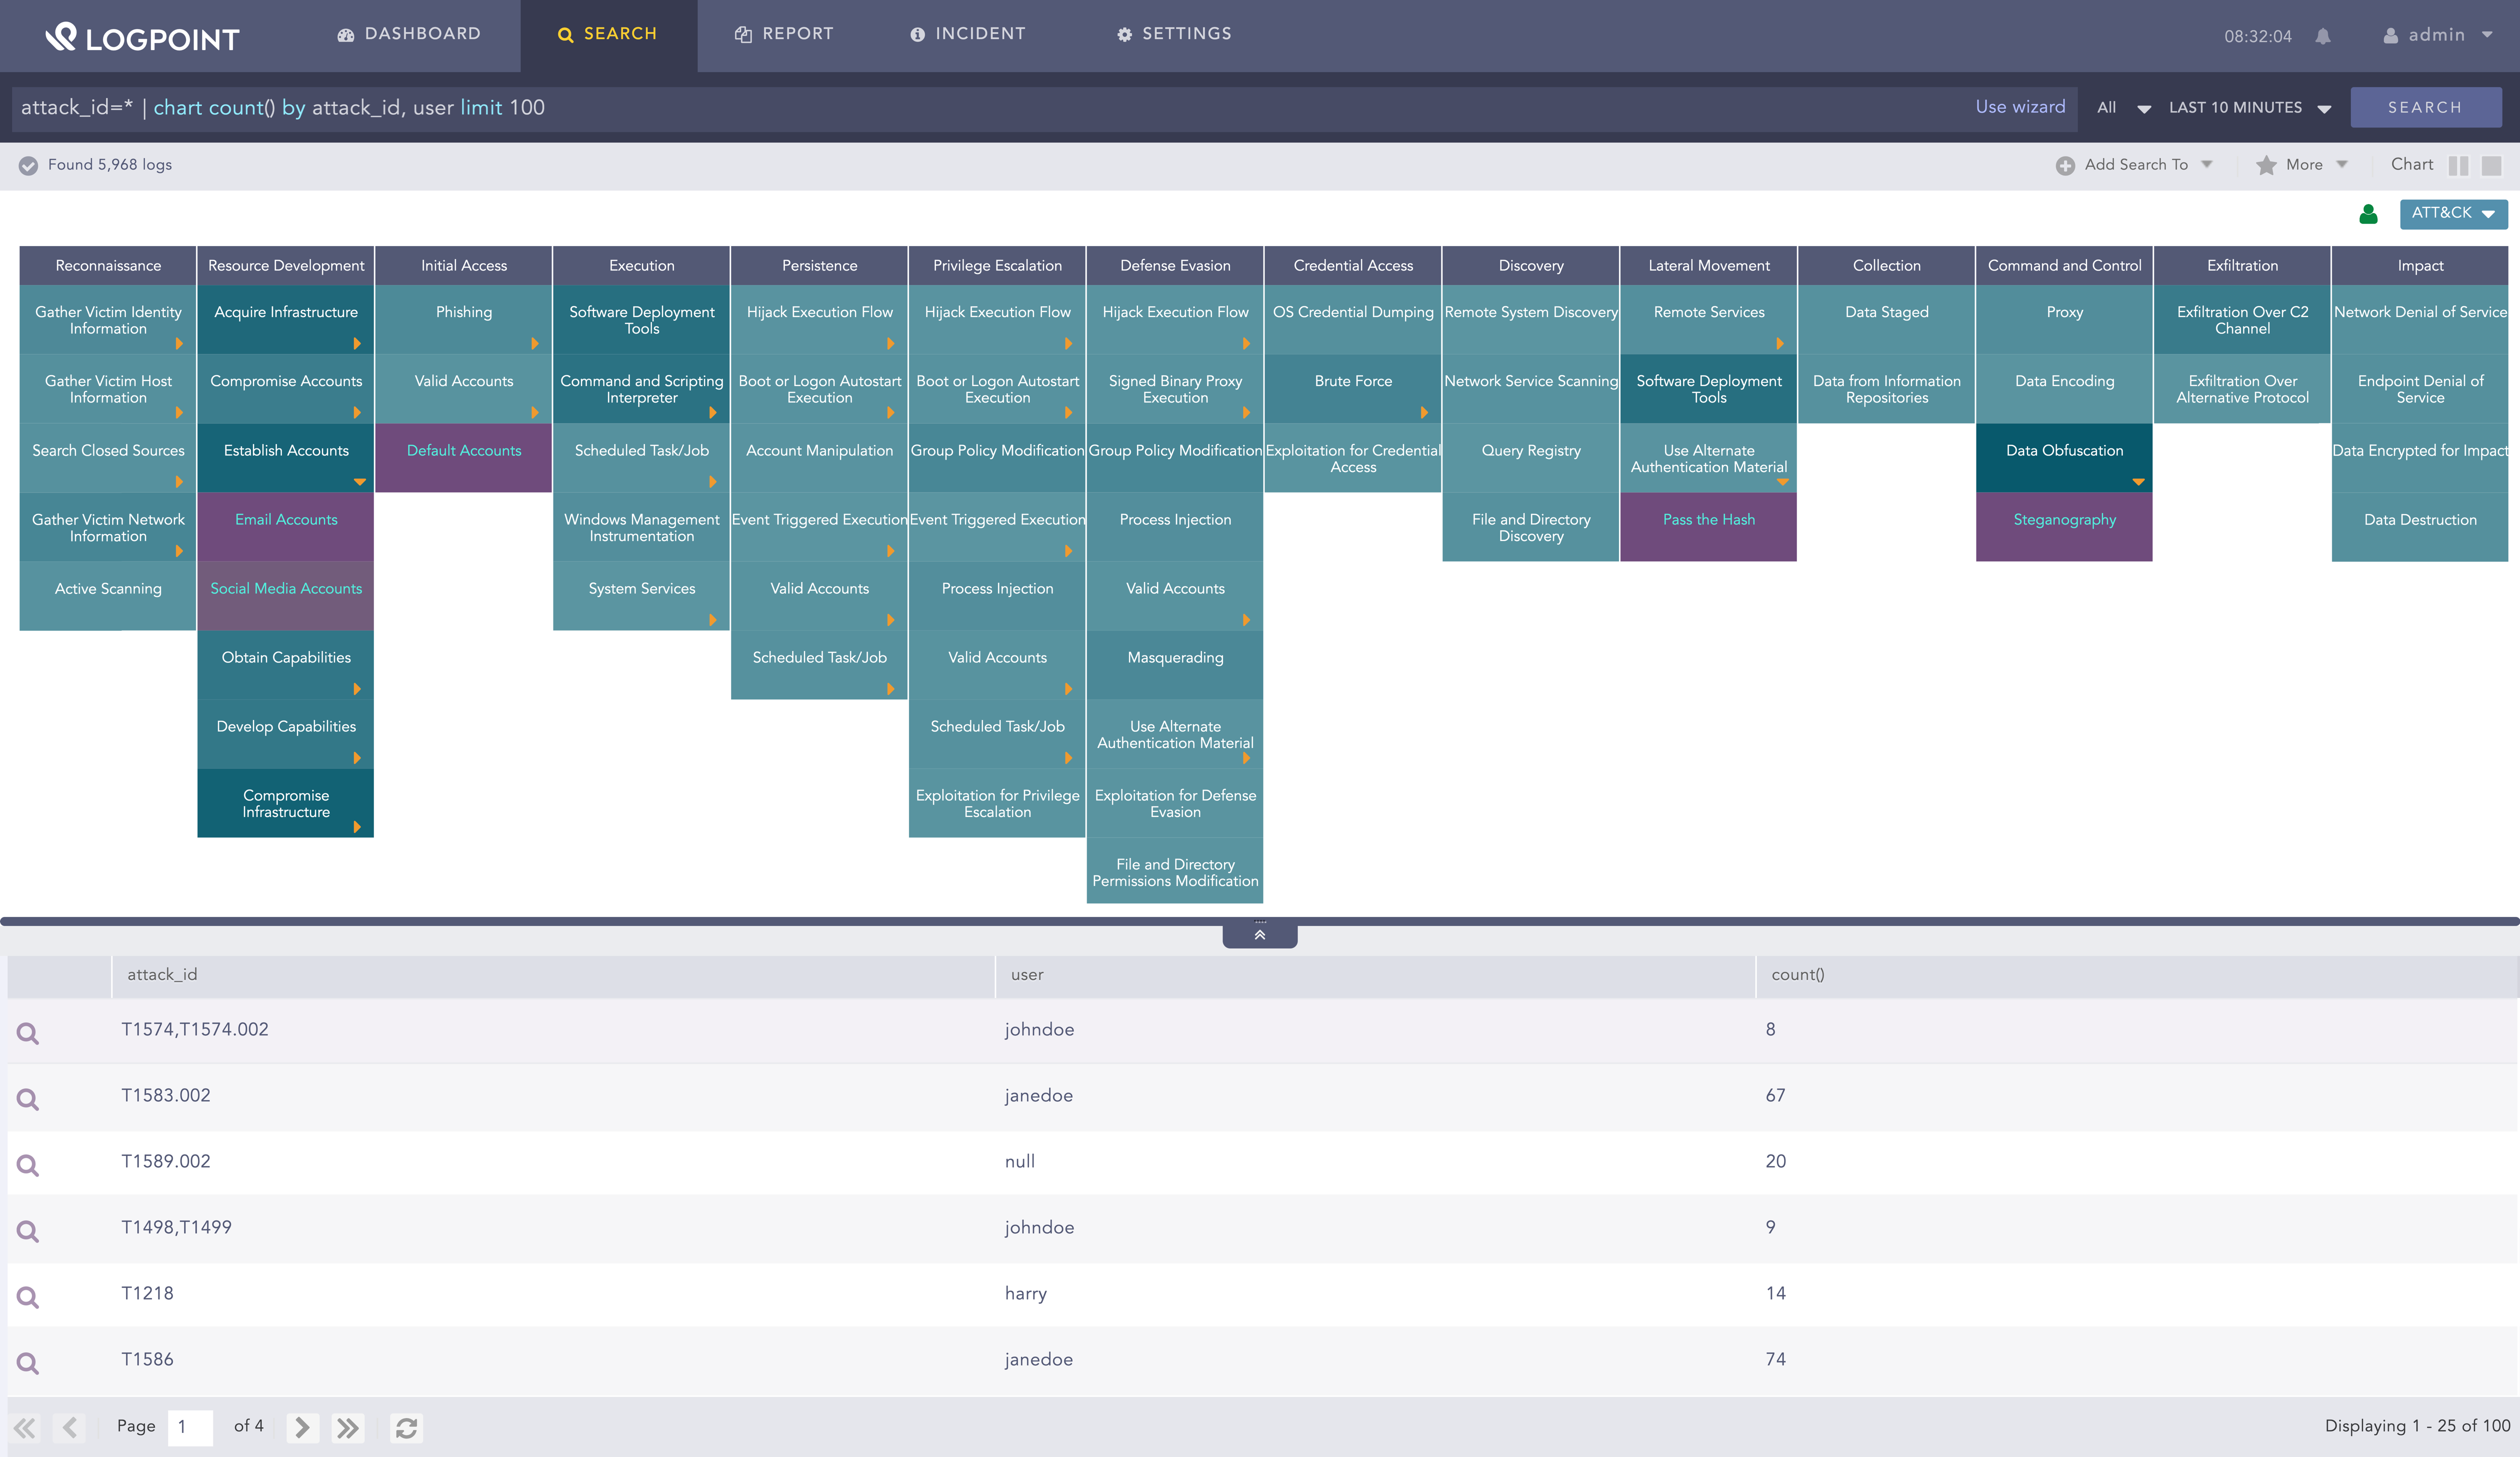
LogPoint detects, analyzes and responds to threats within an organization’s data for faster security investigations. LogPoint is dedicated to helping overloaded security analysts work more efficiently with accelerated detection and response. LogPoint's SIEM solution with UEBA provides…
Loki is an essential complement to Grafana and provides logging metrics for dashboards and other visual tools. Loki can handle the service logging, while other data source plugins can provide more specific quantifiable metrics to support the logging data. Different types of …
First and foremost if Grafana Loki is based on CNCF open source projects so organizations can get freedom to choice to configure it at your own other main thing is Grafana Loki is totally free of cost and we can deploy it on our infrastructure. On compared with other managed …
LogPoint is incredibly useful for pulling information from various log sources and combining them together to offer insights into suspicious or potentially malicious behaviour. It is not intuitive and can take some time to get used to. Once you're up and running though, it's easy to onboard new log sources. Search queries can again be tough to get used to, but LogPoint support is really helpful and can offer assistance with writing more complex searches.
LogPoint has quite a steep learning curve. The UI is not intuitive, with some bits of functionality being hidden in places you might not think to look. The search syntax is also quite difficult to master. However, once you overcome these obstacles, LogPoint is actually very easy to use.
Loki is an essential complement to Grafana and provides logging metrics for dashboards and other visual tools. Loki can handle the service logging, while other data source plugins can provide more specific quantifiable metrics to support the logging data. Different types of metrics make a robust data dashboard.