Grafana Loki vs. SolarWinds Log Analyzer (LA)

Overview
ProductRatingMost Used ByProduct SummaryStarting Price
Grafana Loki
Score 6.9 out of 10
N/A
Grafana Logs (powered by Loki) brings together logs from applications and infrastructure in a single place. By using the exact same service discovery and label model as Prometheus, Grafana Logs can systematically guarantee logs have consistent metadata with metrics. Grafana Logs lets users send logs in any format, from any source so it’s easy to add to existing infrastructure and get up and running quickly. Leverage a wide array of clients for shipping logs like…N/A
SolarWinds Log Analyzer (LA)
Score 6.4 out of 10
N/A
SolarWinds Log Analyzer is log management and analysis tool, designed to fully integrate with the Orion Platform. With real-time log collection, analysis, and visualization, it enables visibility into the performance and availability of the monitored IT infrastructure. According to the vendor, key feature and business benefits include: Log and event collection and analysis Any infrastructure is constantly generating log data to provide performance…N/A
Pricing
Grafana LokiSolarWinds Log Analyzer (LA)
Editions & Modules
No answers on this topic
Offerings
Pricing Offerings
Grafana LokiSolarWinds Log Analyzer (LA)
Free Trial
NoYes
Free/Freemium Version
YesNo
Premium Consulting/Integration Services
NoNo
Entry-level Setup FeeOptionalNo setup fee
Additional Details
More Pricing Information
Community Pulse
Grafana LokiSolarWinds Log Analyzer (LA)
Considered Both Products
Grafana Loki
Chose Grafana Loki
Loki is an essential complement to Grafana and provides logging metrics for dashboards and other visual tools. Loki can handle the service logging, while other data source plugins can provide more specific quantifiable metrics to support the logging data. Different types of …
Chose Grafana Loki
First and foremost if Grafana Loki is based on CNCF open source projects so organizations can get freedom to choice to configure it at your own other main thing is Grafana Loki is totally free of cost and we can deploy it on our infrastructure. On compared with other managed …
Chose Grafana Loki
Grafana Loki was chosen because of its sharp pricing and AWS intergration, where others have a steeper price but easier adaptability
SolarWinds Log Analyzer (LA)
Chose SolarWinds Log Analyzer (LA)
Based on my personal experience SolorWinds Log Analyzer is the best product on the market. Splunk Enterprise is the other system we use for monitoring but it's more complicated and requires extra skills Moreover Solarwinds Support Team response fast to any issues

Best Alternatives
Grafana LokiSolarWinds Log Analyzer (LA)
Small Businesses
SolarWinds Papertrail
Score 8.9 out of 10
SolarWinds Papertrail
Score 8.9 out of 10
Medium-sized Companies
Logz.io
Logz.io
Score 7.0 out of 10
Logz.io
Logz.io
Score 7.0 out of 10
Enterprises
Sumo Logic
Sumo Logic
Score 9.4 out of 10
Sumo Logic
Sumo Logic
Score 9.4 out of 10
All AlternativesView all alternativesView all alternatives
User Ratings
Grafana LokiSolarWinds Log Analyzer (LA)
Likelihood to Recommend
7.0
(0 ratings)
9.0
(0 ratings)
Likelihood to Renew
10.0
(0 ratings)
-
(0 ratings)
Usability
7.0
(0 ratings)
-
(0 ratings)
User Testimonials
Grafana LokiSolarWinds Log Analyzer (LA)
Likelihood to Recommend
AWS integrations are easy, metrics are easily accesable Long term log insights need to be thought out and set up carefully
Read full review
Some of equipment does not support correct monitoring of particular errors via standard SNMP requests (example - Juniper SRX licenses expiration). In this case getting and analyzing syslogs as well as creating event-based alerts/notifications brings great relief of a network administrator life! The second case - is a simple analyzing firewall log events as SolarWinds Log Analyzer (LA) can keep logs for a longer time than an equipment built-in tool.
Read full review
Pros
  • Integration with AWS
  • Notifications land where they should
  • Broad integration options
Read full review
  • Event based custom alarms
  • Useful search filters
  • Real-time streaming
Read full review
Cons
  • Offer log suggestions.
  • Offer basic query syntax check.
  • Offer data range controls.
Read full review
  • Network management
  • Server infrastructure management
Read full review
Usability
I think it is very developer minded and has a very high learning curve
Read full review
No answers on this topic
Alternatives Considered
Loki is an essential complement to Grafana and provides logging metrics for dashboards and other visual tools. Loki can handle the service logging, while other data source plugins can provide more specific quantifiable metrics to support the logging data. Different types of metrics make a robust data dashboard.
Read full review
Based on my personal experience SolorWinds Log Analyzer is the best product on the market. Splunk Enterprise is the other system we use for monitoring but it's more complicated and requires extra skills Moreover Solarwinds Support Team response fast to any issues
Read full review
Return on Investment
  • Enable engineers to access logs quickly to distribute the workload.
  • Provide a possible standard for log access between multiple services.
  • Provide data metrics for customer use.
Read full review
  • Decrease issue reaction time
  • Simplify an issue root cause reporting
Read full review
ScreenShots

SolarWinds Log Analyzer (LA) Screenshots

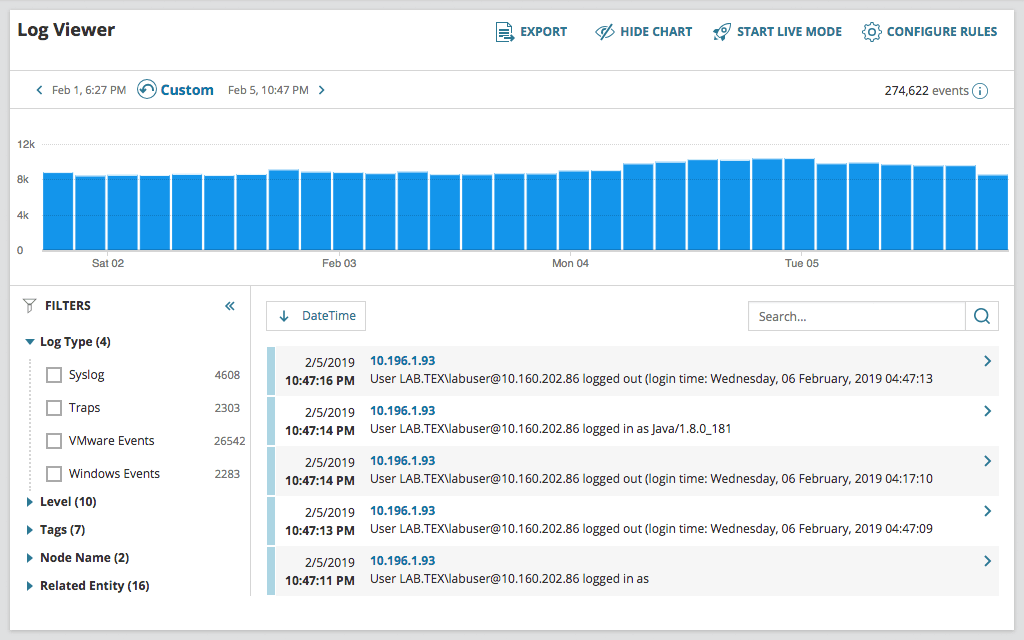
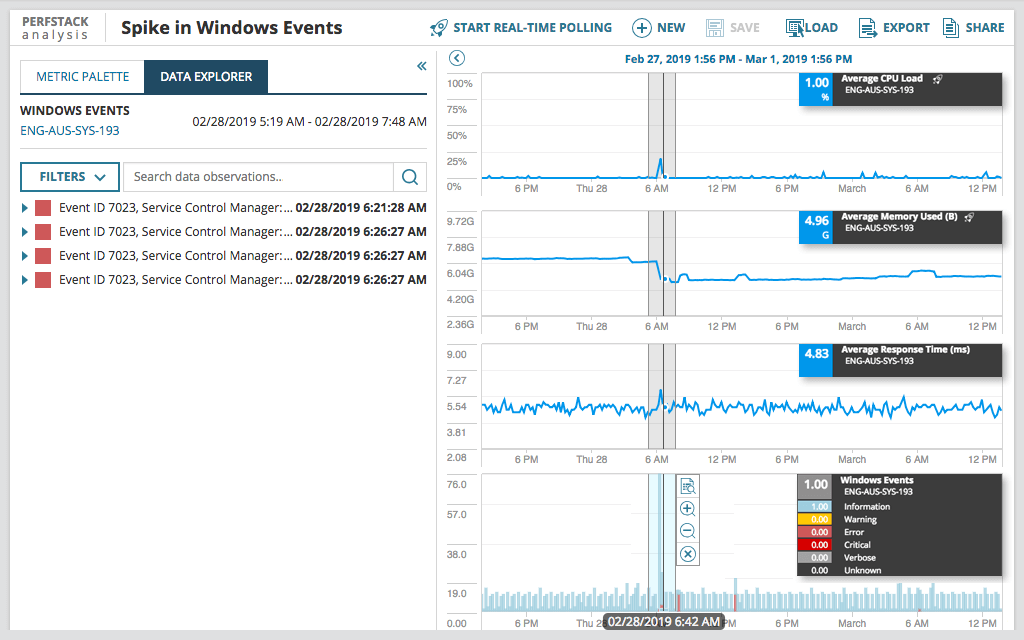
Screenshot of Log and event collection and analysisScreenshot of Powerful search and filterScreenshot of Real-time log streamScreenshot of Event log taggingScreenshot of Orion Platform integrationScreenshot of Orion Alert integration