Grafana vs. KULG
Grafana vs. KULG
| Product | Rating | Most Used By | Product Summary | Starting Price |
|---|---|---|---|---|
 Grafana | N/A | Grafana is a data visualization tool developed by Grafana Labs in New York. It is available open source, managed (Grafana Cloud), or via an enterprise edition with enhanced features. Grafana has pluggable data source model and comes bundled with support for popular time series databases like Graphite. It also has built-in support for cloud monitoring vendors like Amazon Cloudwatch, Microsoft Azure and SQL databases like MySQL. Grafana can combine data from many places into a single dashboard. | $8 per month up to 1 active user | |
 KULG | N/A | KULG simplifies how runners track and understand their training and recovery metrics, offering personalized AI-driven insights and tips to help them progress towards their goals. Whether they're training independently or with a coach, KULG empowers runners to focus on what works best for them. The challenge KULG addresses: Runners often find themselves overwhelmed by data but struggle to make sense of it in relation to their personal training. Many… | $9.99 per month |
| Grafana | KULG | |||||||||||||||
|---|---|---|---|---|---|---|---|---|---|---|---|---|---|---|---|---|
| Editions & Modules |
|
| ||||||||||||||
| Offerings |
| |||||||||||||||
| Entry-level Setup Fee | No setup fee | No setup fee | ||||||||||||||
| Additional Details | — | Up to a 40% discount for annual pricing. | ||||||||||||||
| More Pricing Information | ||||||||||||||||
| Grafana | KULG |
|---|
| Grafana | KULG | ||||||||||||||||||
|---|---|---|---|---|---|---|---|---|---|---|---|---|---|---|---|---|---|---|---|
| BI Standard Reporting |
| ||||||||||||||||||
| Ad-hoc Reporting |
| ||||||||||||||||||
| Report Output and Scheduling |
| ||||||||||||||||||
| Data Discovery and Visualization |
|
| Grafana | KULG | |
|---|---|---|
| Likelihood to Recommend | 9.0 (0 ratings) | - (0 ratings) |
| Usability | 10.0 (0 ratings) | - (0 ratings) |
| Grafana | KULG | |
|---|---|---|
| Likelihood to Recommend |
|  No answers on this topic |
| Pros |
| No answers on this topic |
| Cons |
| No answers on this topic |
| Usability |
| No answers on this topic |
| Alternatives Considered |
| No answers on this topic |
| Return on Investment |
 ANurag Tamrakar Software Engineer - DevOps | No answers on this topic |
| ScreenShots | KULG Screenshots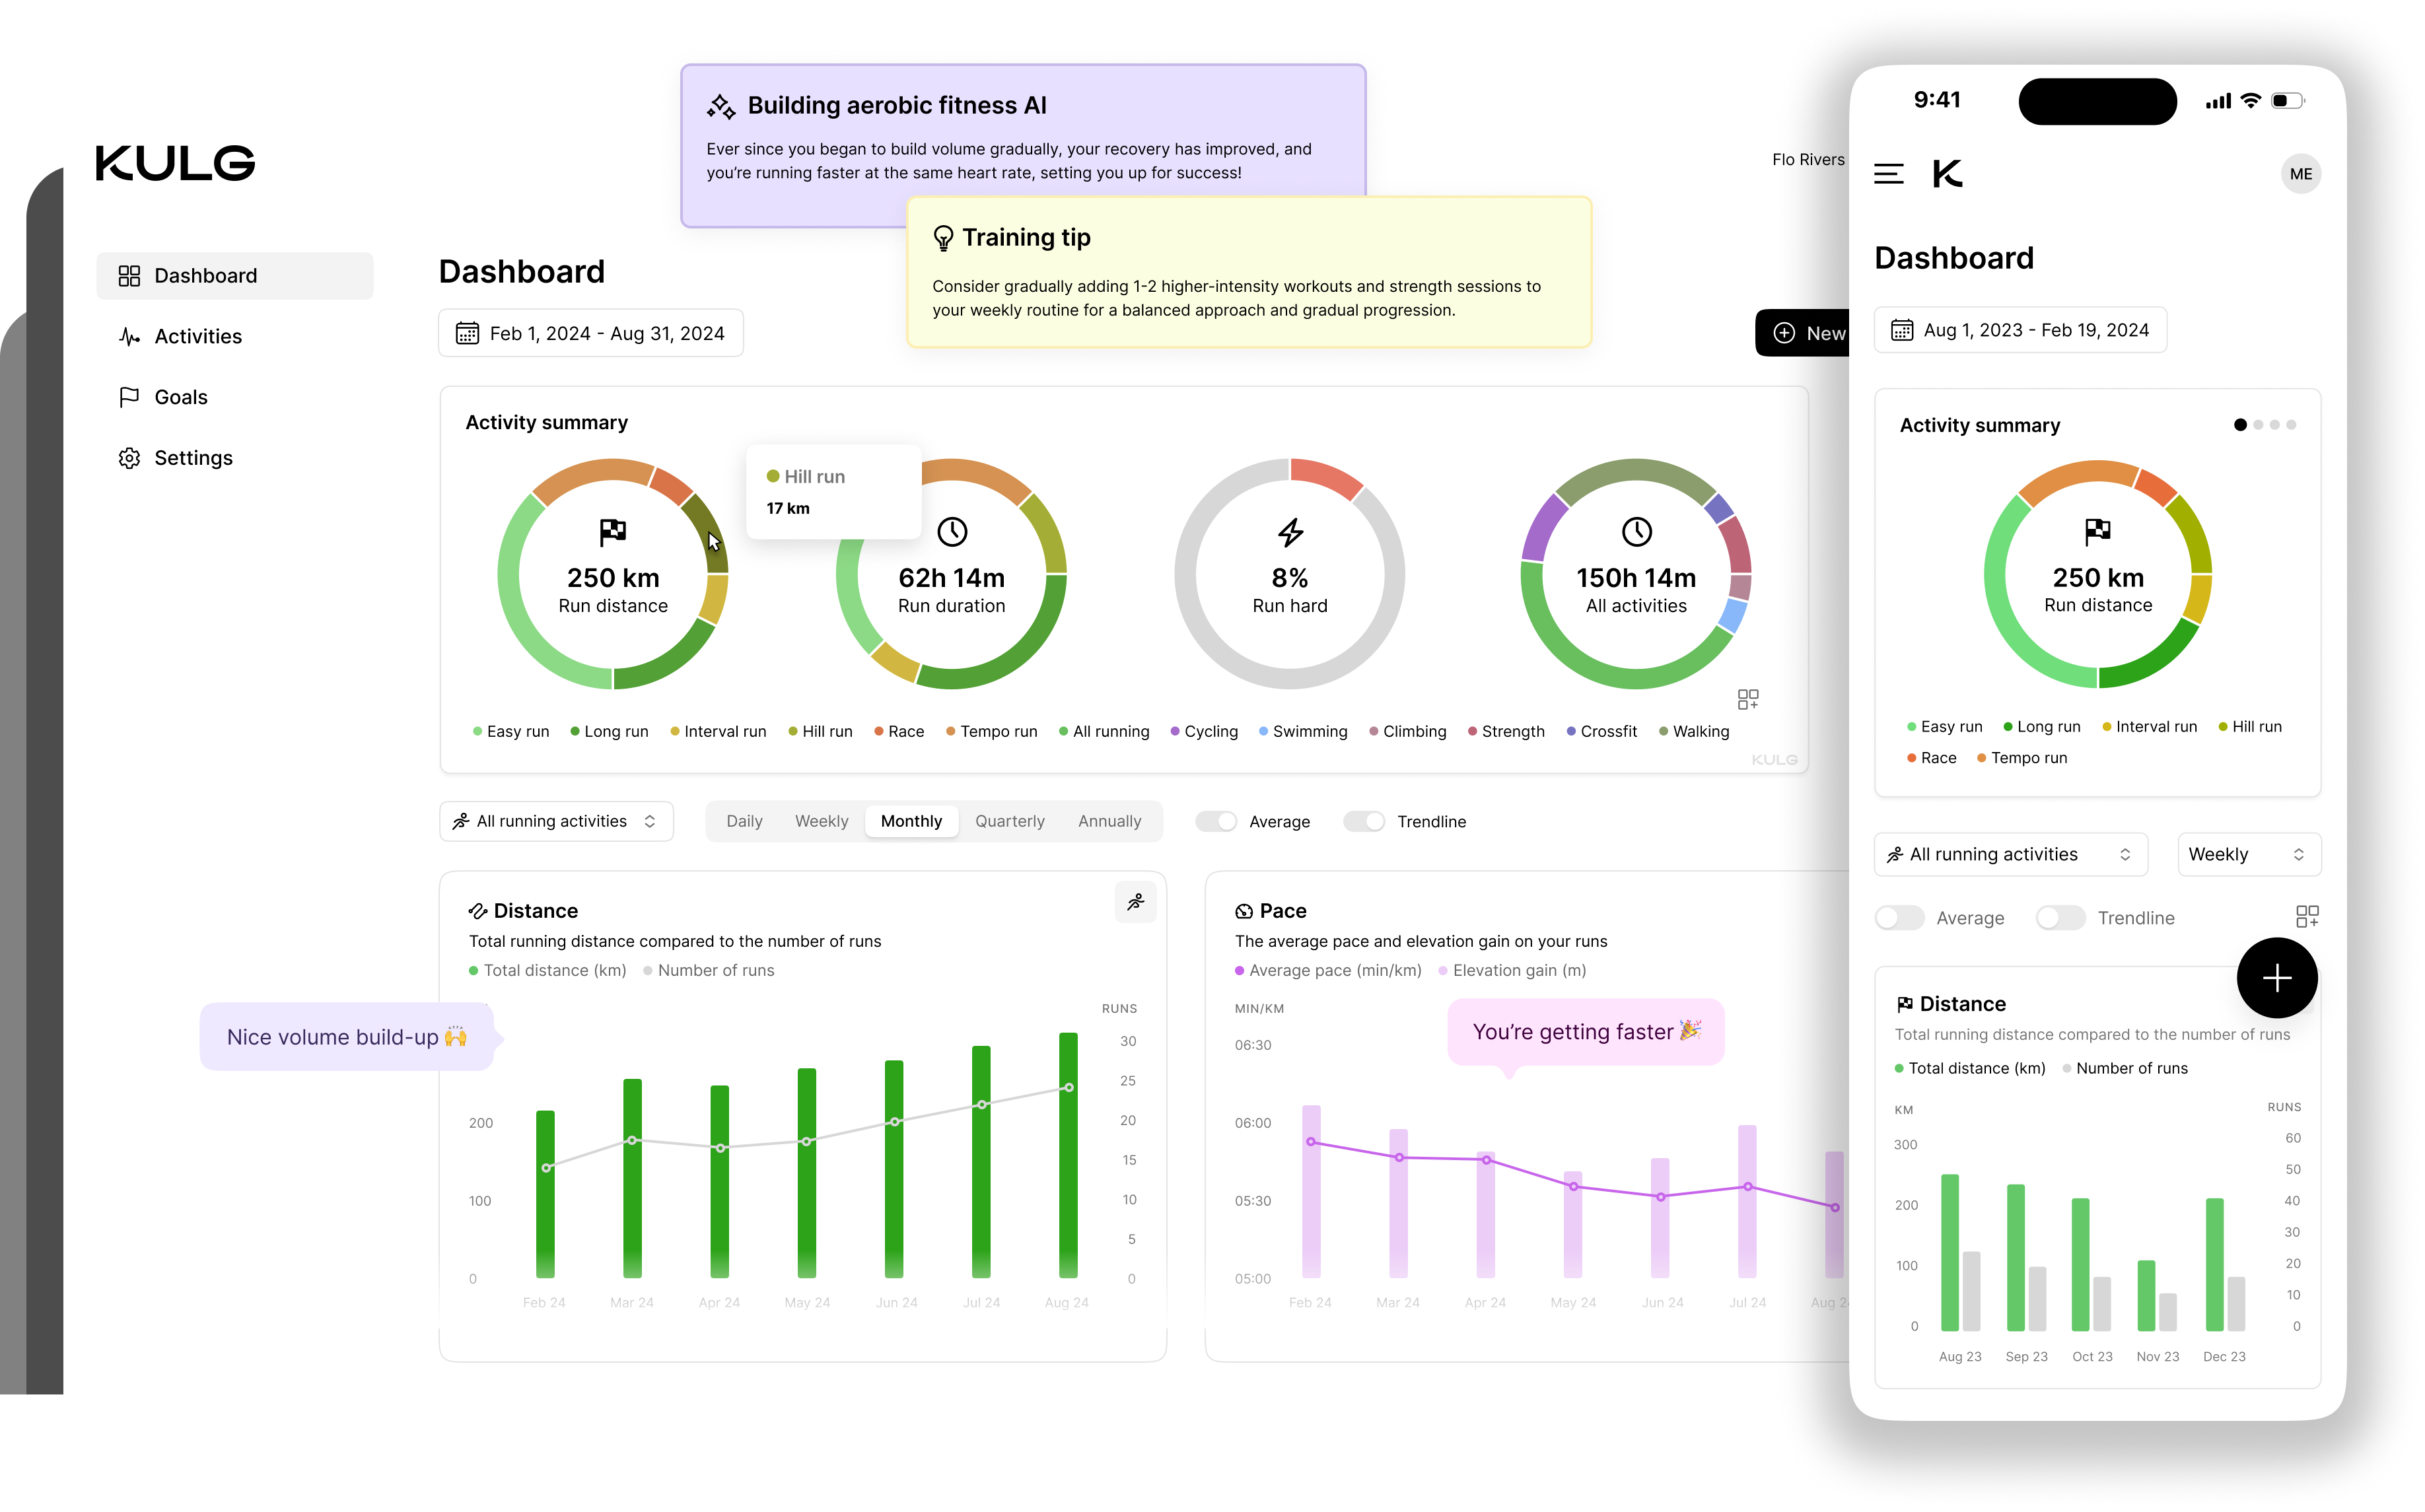 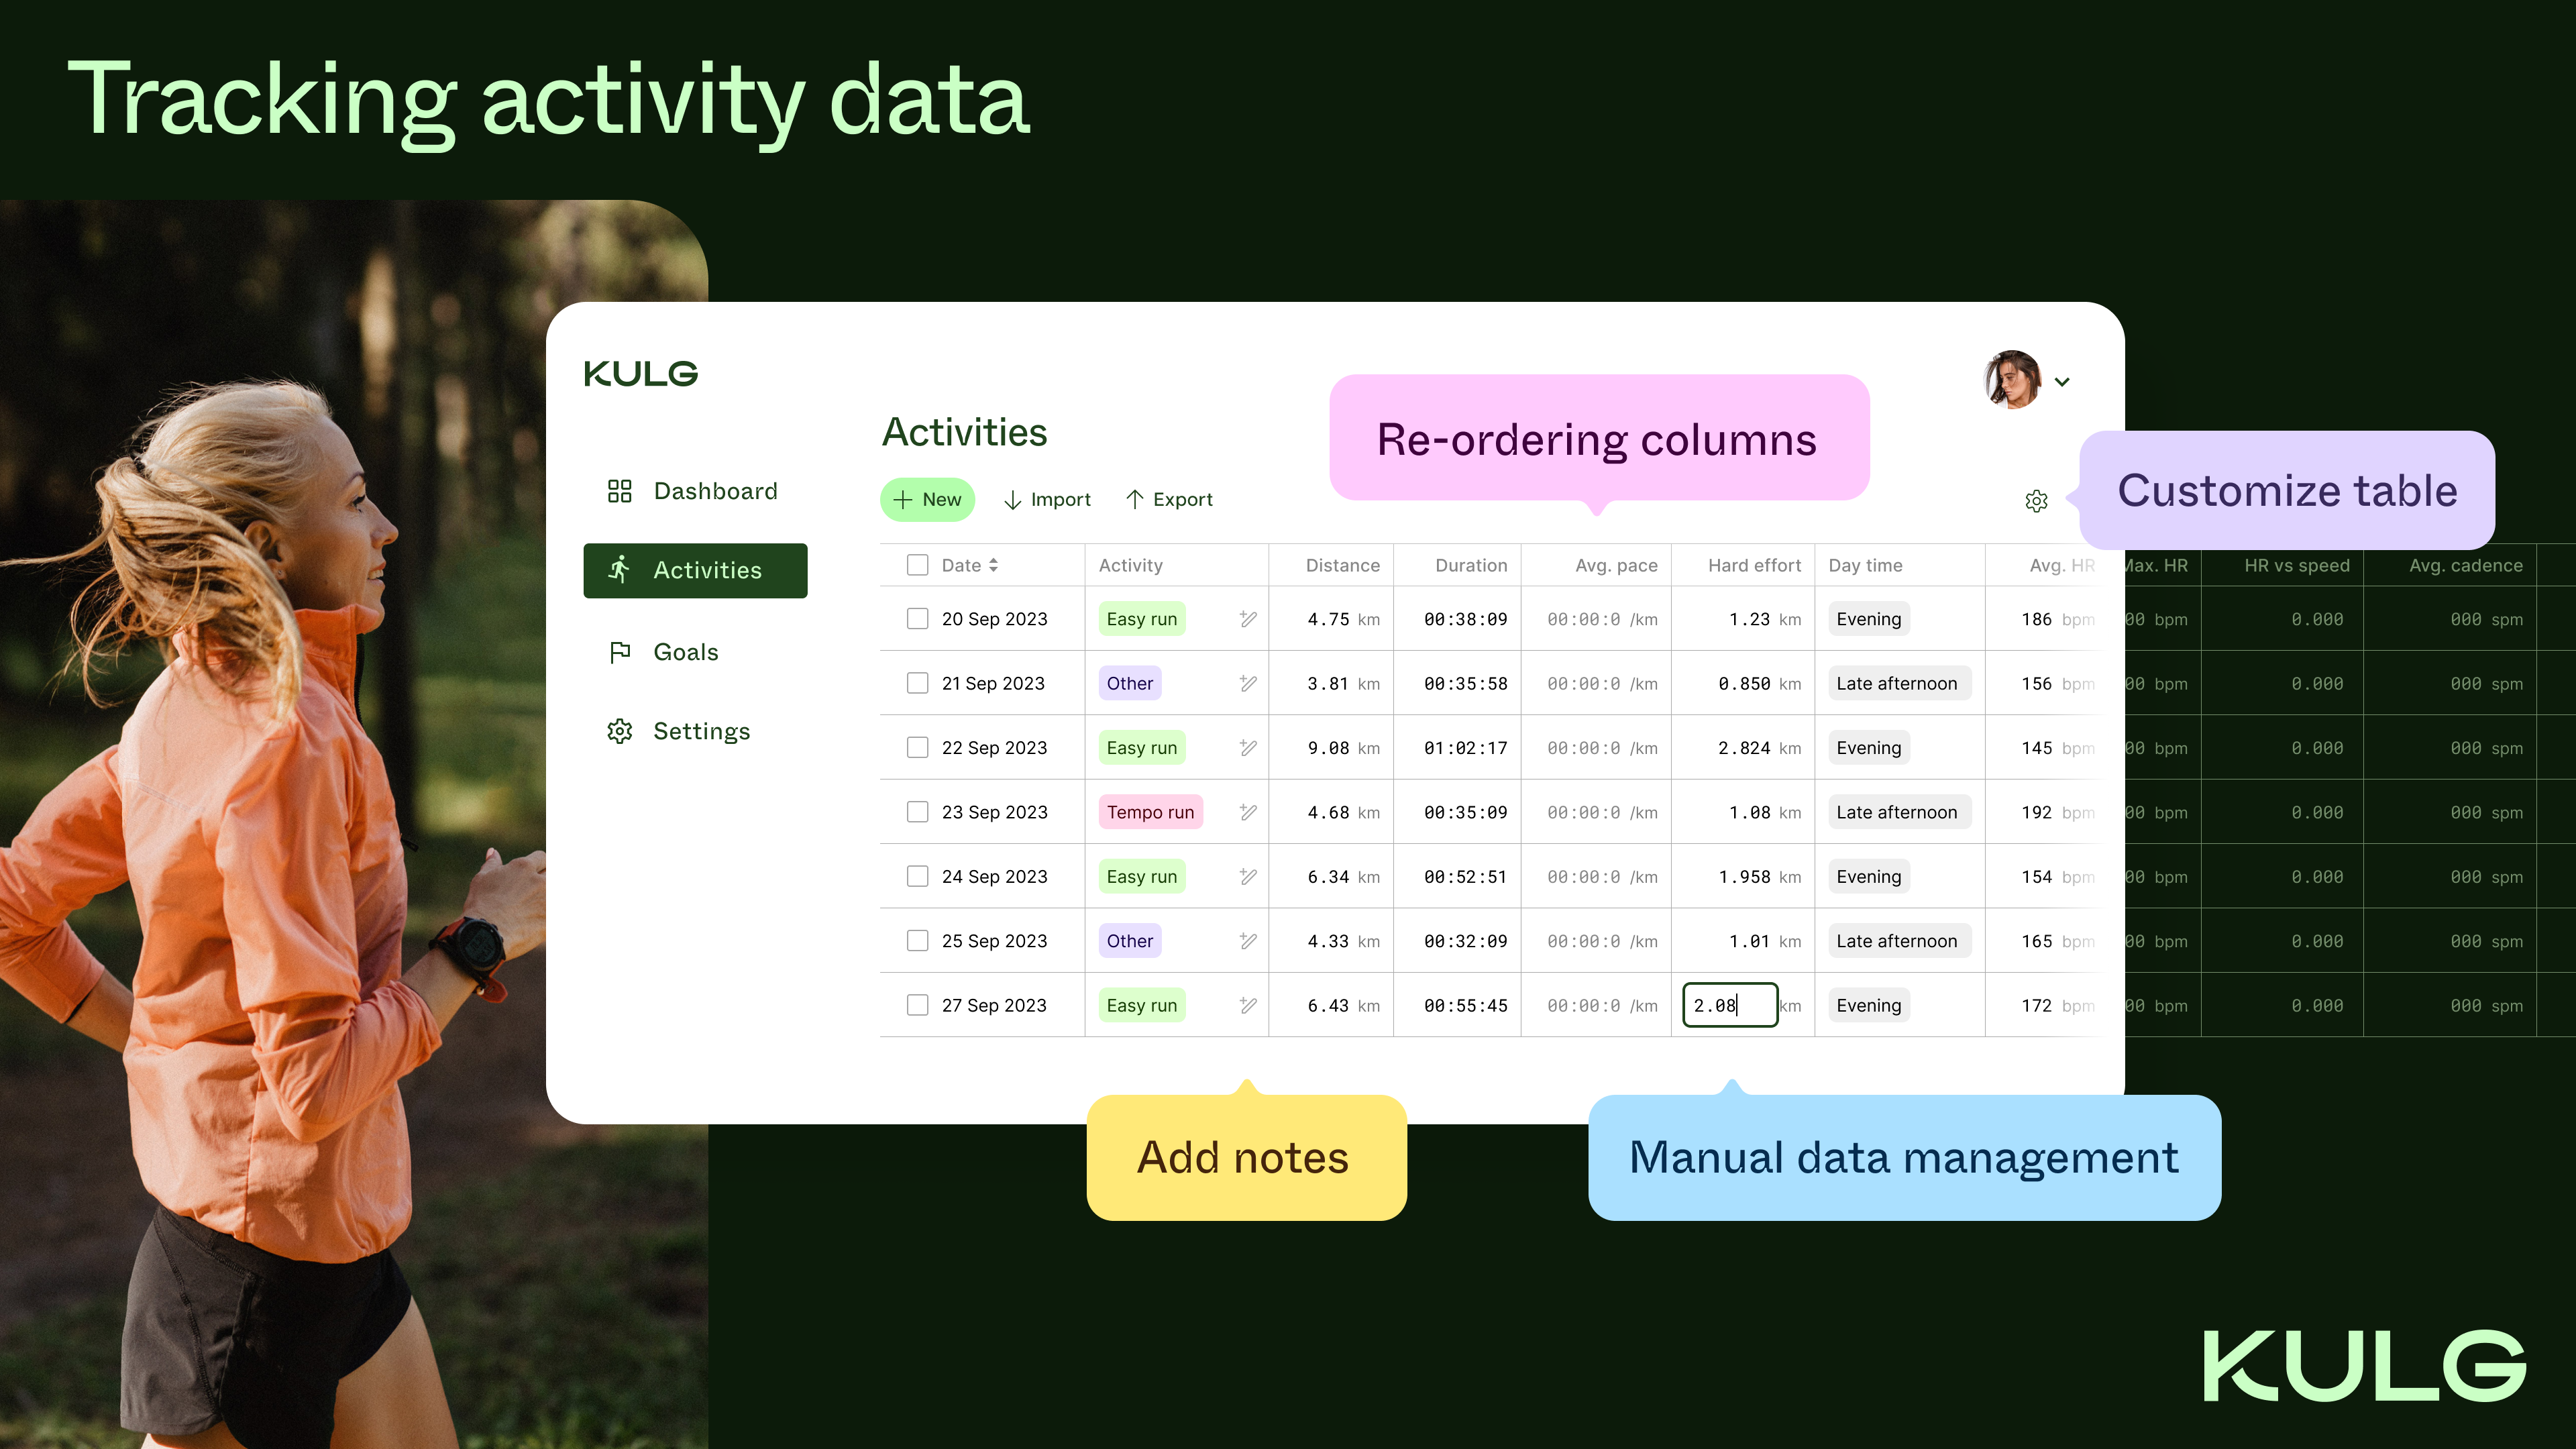 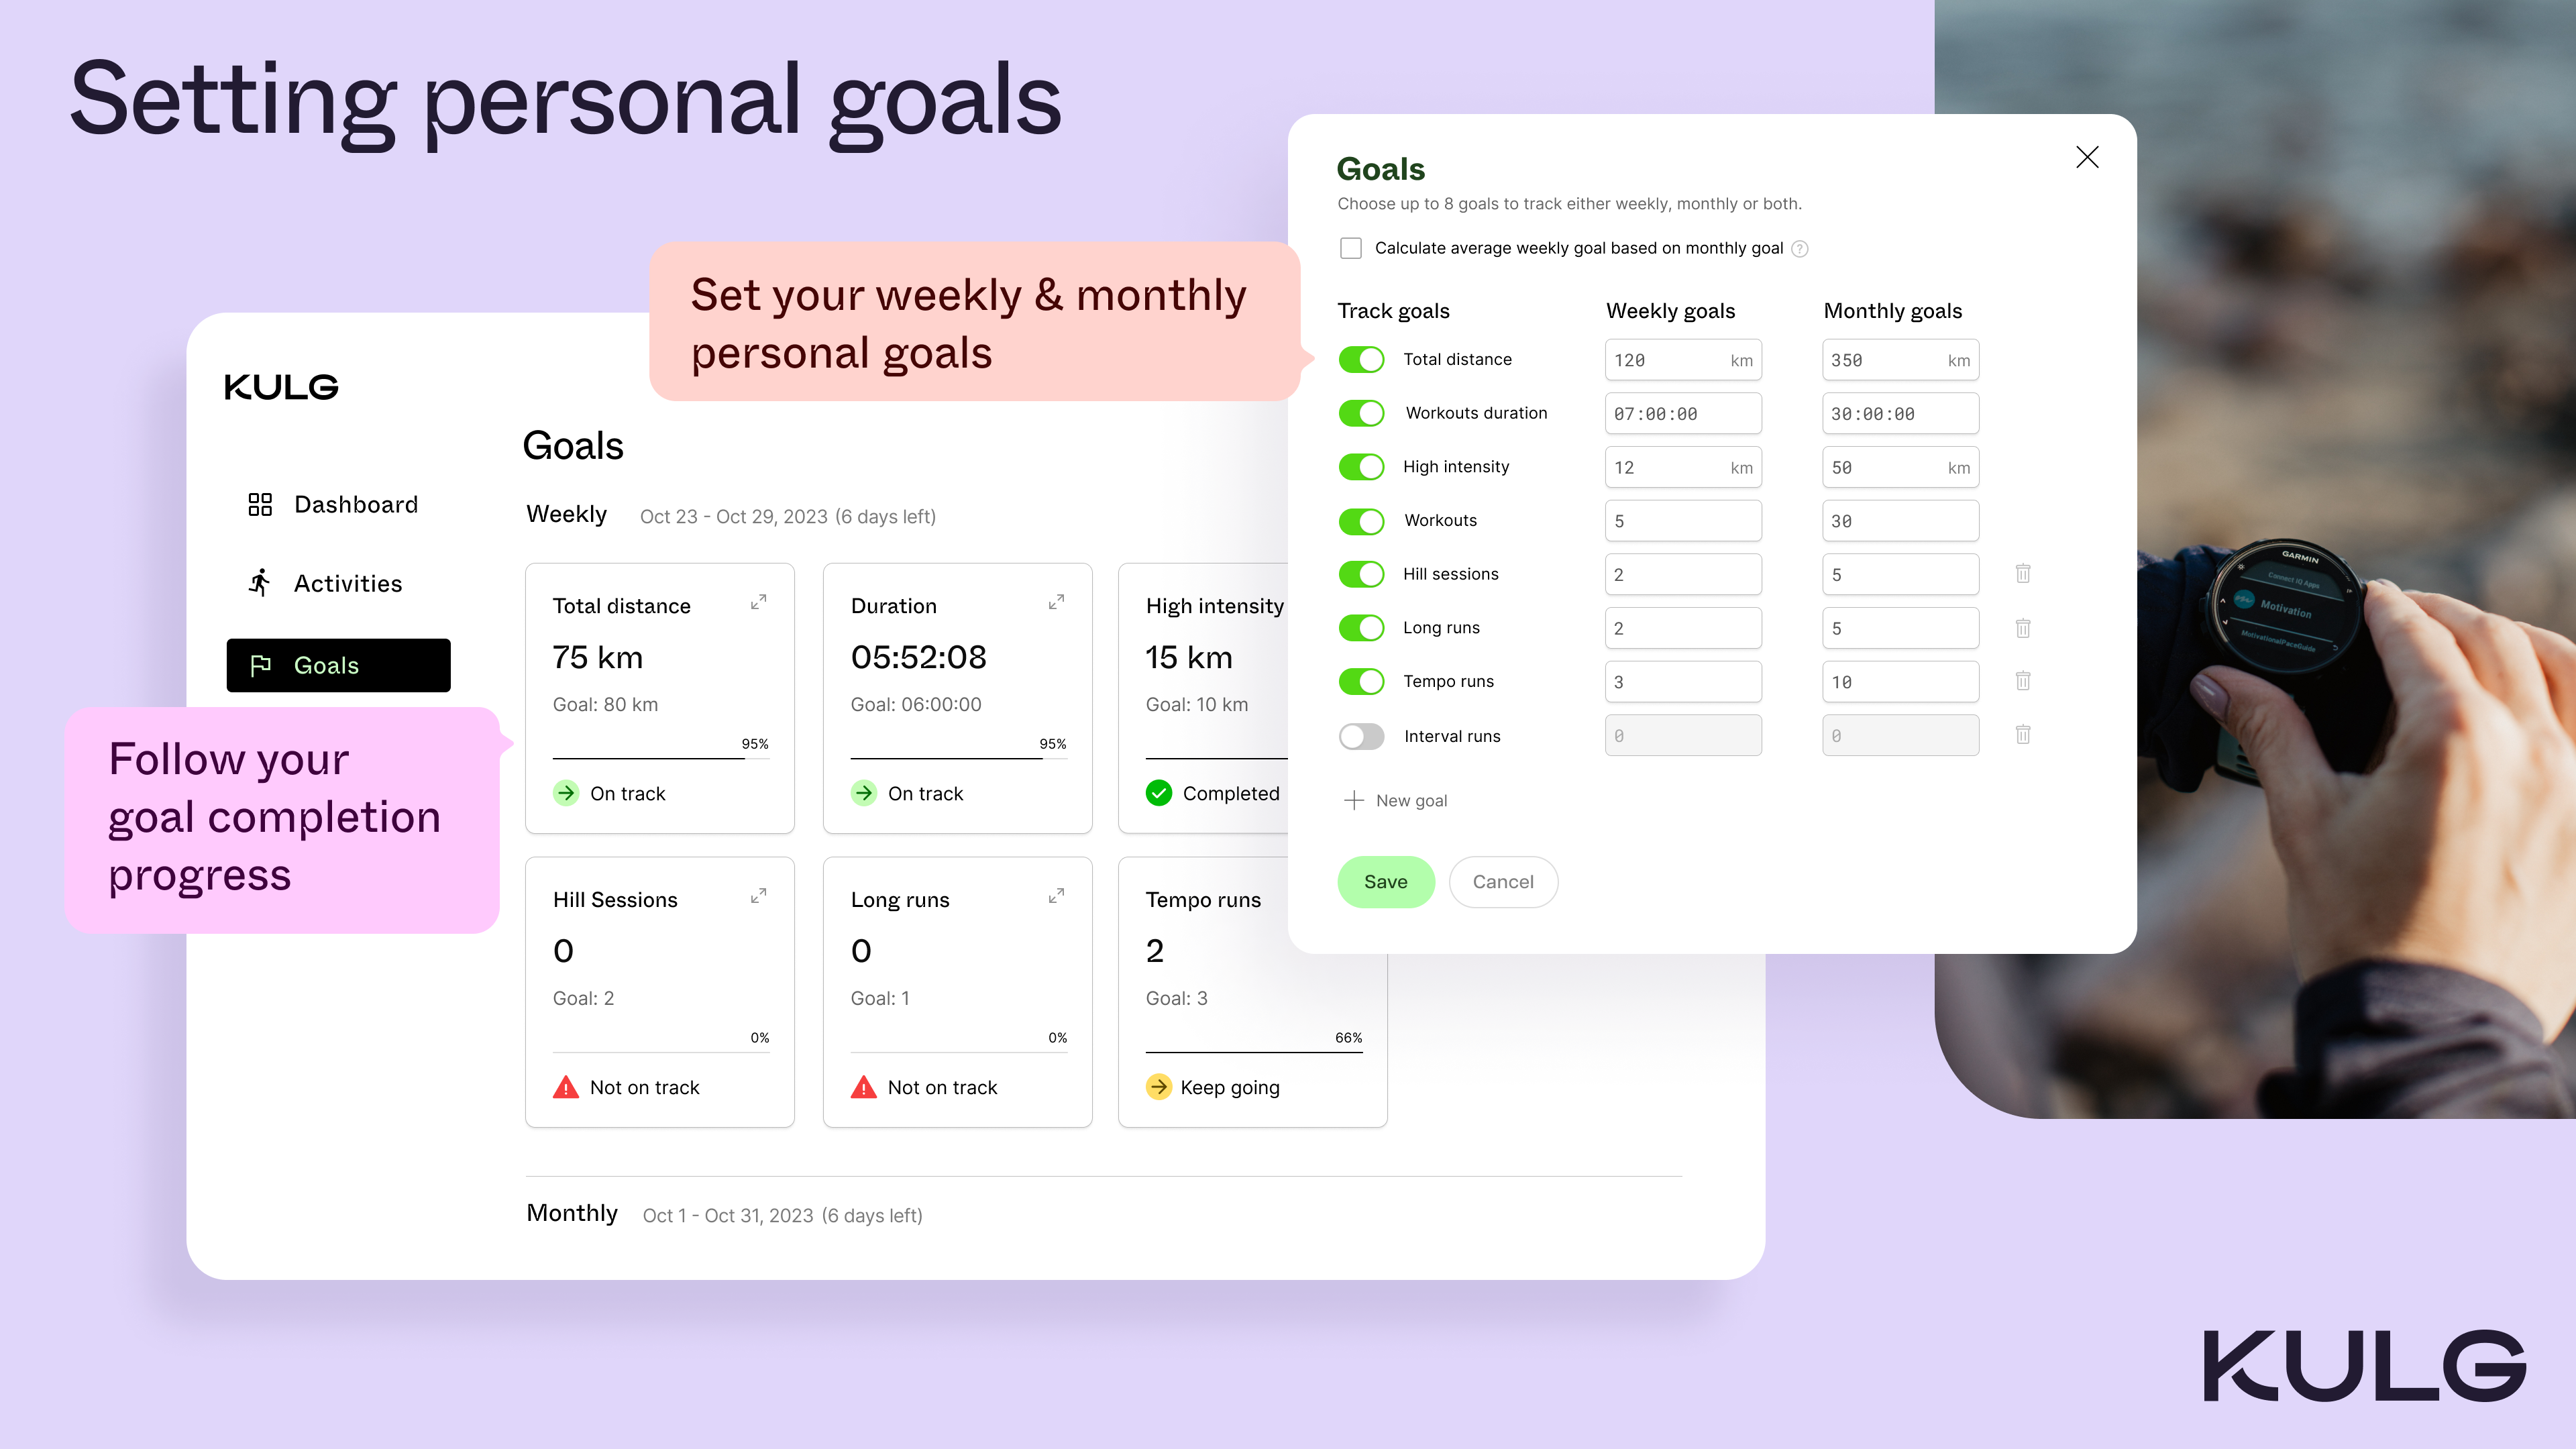 |