IBM Cognos is a full-featured business intelligence suite by IBM, designed for larger deployments. It comprises Query Studio, Reporting Studio, Analysis Studio and Event Studio, and Cognos Administration along with tools for Microsoft Office integration, full-text search, and dashboards.
$10
per month per user
Logi Symphony
Score 8.9 out of 10
N/A
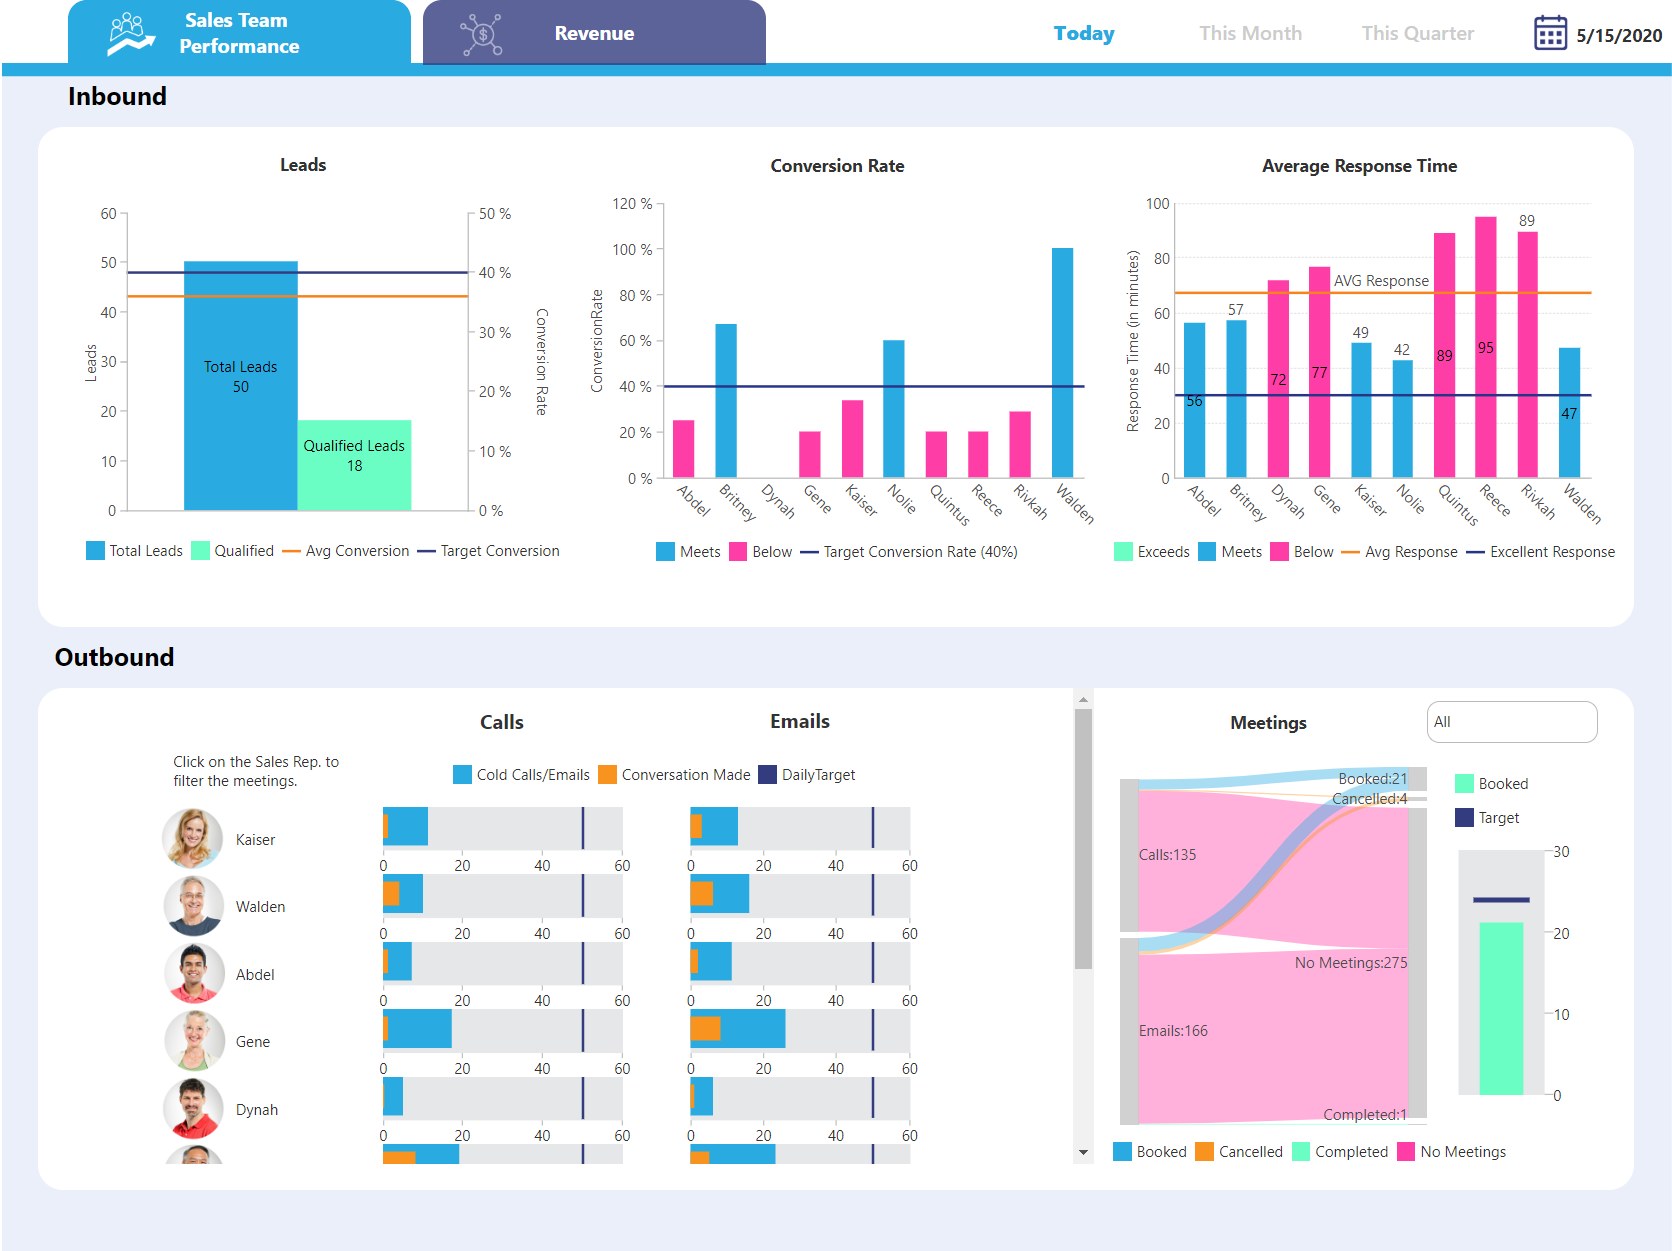
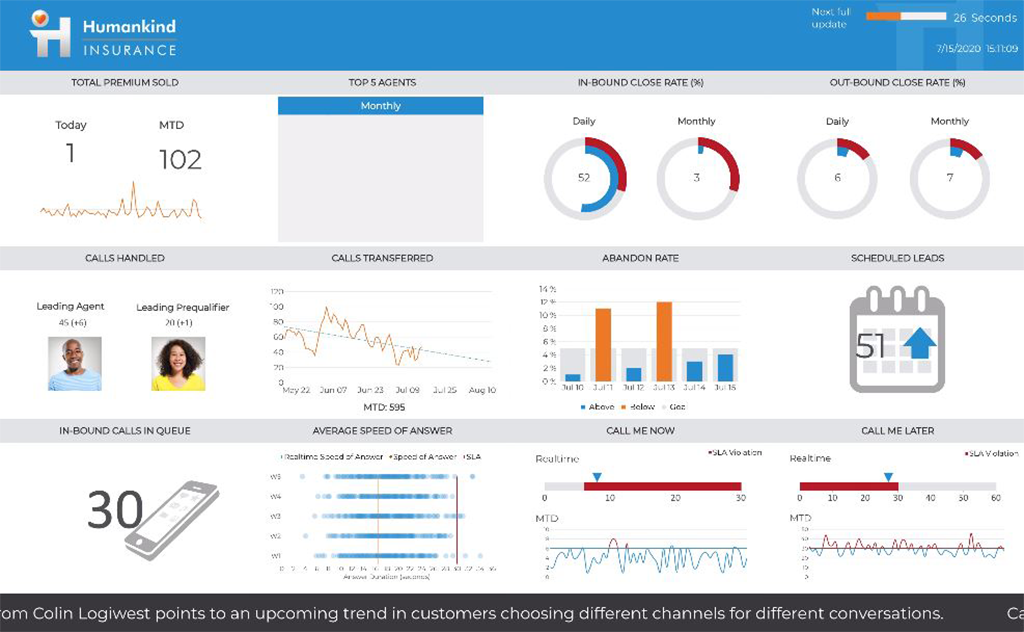
Logi Symphony is a business intelligence and data visualization software that includes customizable dashboards, reporting, and visual data analytics. It can be integrated into users’ existing business applications and its visualization and reporting tools can be customized.
Tableau, Power BI, QlikView were the other options considered. Tableau lacked the following key components of business intelligence and analytics. Some other statistical functions that are available on the platform were not matched by Power BI. QlikView lacked robust …
We selected IBM Cognos Analytics based on the following. The scalable and robust features for large organizations allowing it to grow as we do. The nest feature is the strong data governance and security features. It also supports a wide variety of data sources. Lastly, it …
It was due to trust in IBM. Very good support provide by IBM. Response time is pretty good Product is proven in past & well robust feature Many good enterprises have used this product
My company selected IBM Congos Analytics because of its advanced features and data representation for data analysis. Its row and column features are very effective for creating dashboards and reports to visualize data. It's chart representation and view format are very …
IBM Cognos Analytics is our legacy BI solution. It hadn't stacked up well against its modern contemporaries. We are thinking of replacing it with Microsoft BI.
Cognos provides very advanced analytics functionalities, maybe even more advanced than the competition, and works great when used in collaboration with Watson. However, Tableau and other newer products are much better regarding overall usability.
We looked at Qlik Sense, SAP Analytics Cloud, and IBM Cognos Analytics for our financial brand's needs. Qlik Sense is super user-friendly, great for quick data digging. SAP Analytics is perfect when we're working with other SAP stuff; it just clicks. But for our big project, …
IBM Cognos comes close to Data Central. It has some pros & cons over Data Central. Pros: 1. We use the tool for data modeling as it helps in predictive data analysis for complex data, which is very much in line with real-life scenarios. 2. Has a mobile application that works …
IBM Cognos has a lot more deep, robust, AI-driven Business Intelligence features that remove some of the manual work. Automation is a lot more seamless and ease of making data available and digestible by several non-technical business partners.
Cognos Analytics provides wide range for reporting, data visualization, and self service analytics. Cognos has strong security and governance features. Sigma computing is purely cloud native approach and has spreadsheet like interface and doesn't provide many customization …
While all of them have their own advantages. IBM Cognos Analytics is highly scalable and have unmatched data analytics capabilities which makes the data from IBM Cognos Analytics of very high quality and data governance also makes sure your data is safe and protected.
IBM Cognos Analytics is a relatively late entrant in the BI space - dominated by Tableau and Qlik. it works well for 80% of our use cases and is easy for a non technical user to start using. Also due to enterprise licensing, its easier to distribute internally.
In the past Management had used Excel and Workiva capabilities to create the reporting dashboards that were being used to make decisions. Since switching to IBM Cognos Analytics the Company has been much more efficient and decision making has been streamlined. IBM Cognos …
I like the cloud native character and ease of deployment with Sigma and ThogthSpot, I also like the metadata modelling capabilities of Power BI. I prefer the ability of Cognos to create and publish a metadata model that provides both ad hoc access and managed reporting and …
Microsoft Power BI has a more user friendly interface and it is integrated very well with the other Microsoft products but IBM Cognos Analytics has a more advanced reporting and complex data analysis capabilities.
We have alot of resources already invested in Cognos and it would be a humongous effort to migrate. CA is more inline with Power BI and Tableau now that there are dashboarding capabilities.
We could deliver a corporate wide solution with Cognos, it is an end-to-end platform. No other option provided the same breadth of scope. I can't think of a feature that the others provide that Cognos lacks, but the others do not provide the same features and governance of …
IBM Cognos Analytics with Watson is an enterprise ready tool and could provide end to end functionality expected from a BI tool. Provides integration with custom applications as well as provides not just high end visualizations that Tableau or PowerBI provides but also the very …
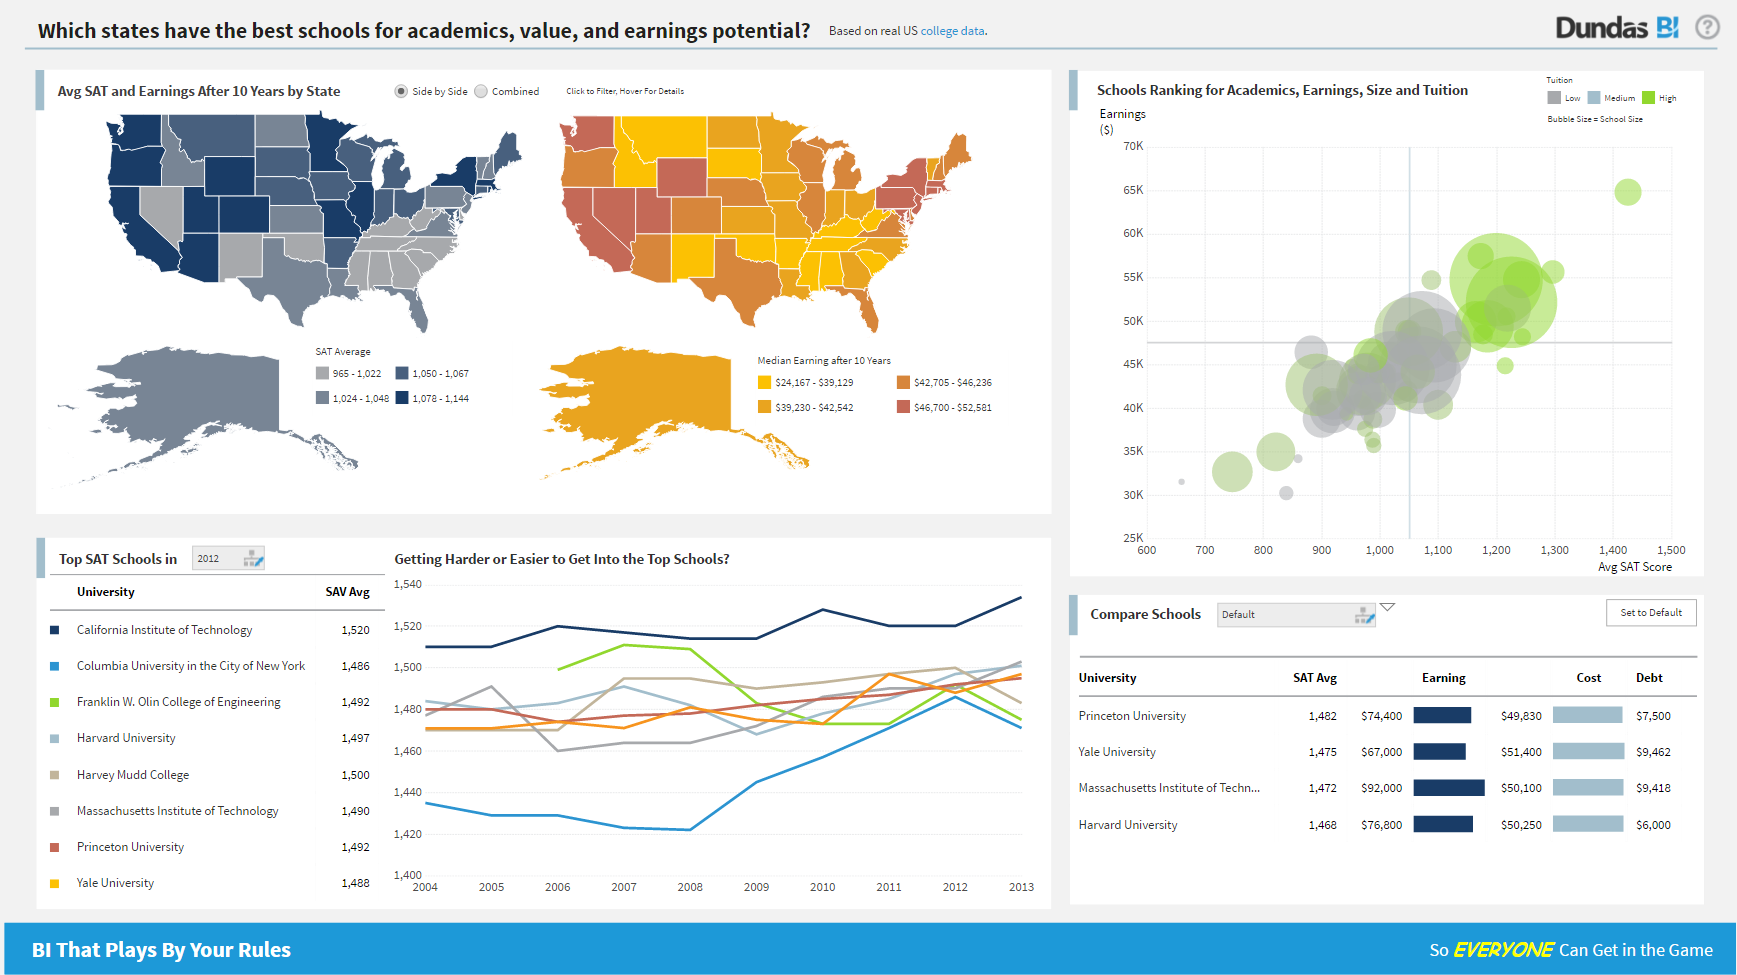
Dundas ticks all the relevant boxes: - set up actually easy and works (was not the case for Pentaho) - you do not need one license per email address you want to send reports to (as for Tableau)
Dundas is an easier GUI overall to navigate and is a lot more visually configurable. The number of data connectors available also allows us to use it as a solution for many projects. The support provided is quick and prompt, with great technical depth when required.
We have tested Tableau prior to Dundas BI and though Tableau is a great package in itself, Dundas BI is much more cost-effective for our needs and requirements and hence zeroed in on Dundas BI.
We have also tried Microstrategy but it has a very dated UI and doesn't suit our …
Per dollar spent, it offers the widest range of features of the tools that we evaluated. It offers lots of options for how to configure your environment, though they are not always intuitive to figure out. Having an ETL layer was a must have for us, as well as the ability to …
Much better for multi-tenancy. Power bi just doesn't have many features and is just lackluster. telerik doesn't look as good although slightly more powerful with data manipulation. Too many BI reporting tools out there don't offer multi-tenancy and I have no idea why. It is …
We were comparing Dundas BI against several other programs and eventually decided to go with Oracle as we were already using a host of their other products. Dundas was just as robust, we were just using more Oracle products and they all fit together very smoothly.
Personally as a dashboard software I use Qlik Sense more because I consider it a very simple product to use, but this is a personal choice. However, for some things, it does not satisfy me fully. In my opinion, they are software that are alternated depending on the customer in …
It is a very good tool for dashboard and scorecard design. It looks great. However, it requires a lot of work regarding renaming components, deploying between different environments, and scripting customized functionalities.
These other products tend to do quite a poor job of allowing you to embed them into other products. Either the architecture is not suited to embedding or they make it too expensive to do this. Dundas is designed and priced to do this (embedding) well. We found Dundas …
Dundas and Sisense are very similar. Both are very powerful and flexible with an eye toward further innovation. I expect both will do well as we enter a major transition period for BI.
Periscope Data and Dundas differ substantially and seem to have different paths forward. …
Dundas BI offers a high level of visual customization in the dashboards if required (through CSS, JavaScript, HTML) as well data customization (C#) in the data cubes. We are an organization that believes in doing as much as possible for ourselves and not replying on …
Manager - Business Intelligence & Data Architecture
Chose Logi Symphony
We were a user of Dundas Dashboard previously. We had explored other tools, but we ended up upgrading to Dundas BI because of the HTML 5 compliance (no more Silverlight requirement), ease of use and time to market. The other tools could do the job, but they were not as flexible …
I selected Dundas BI to be our preferred partner since we saw that it the most flexible tool that allows our customers to design their dashboards in they way that they are not restricted in their development process.
We found that Dundas BI struck the perfect balance between ease of use and flexibility, while still remaining within a reasonable budget. Other products were either to technical, lacked functionality, or "broke the bank".
It is much more powerful to build more interactive and feature rich dashboards. Most of the above are great at ad hoc analysis but not for providing a full feature and rich guided dashboard experience. Dundas BI is great to build a suite of dashboards and easy to deploy …
We looked into Tableau, Qlikview also. These tools are doing all the same basically. There are some items which DundasBi does do really well. Next to the product the organzation behind is really dedicated and commited with their customers. They treat you as a customer and just …
I use predictive analytics techniques, which can help me predict my future sales based on collected data, giving me insight into my market's trends.This market data can be analyzed, giving me the opportunity to gain in-depth insight into my market's competition and positioning it competitively, aided by developing strategies to improve my marketing approach.
Considering it's price point in the market, Dundas BI offers a lot of functionality. They are constantly adding features and bug fixes which is great, but also means there are always updates to take if you want everything to work as expected. The standard user interface is pretty easy to understand, but it takes a while for developers and power users to become independent of documentation.
Project organization from Development to Production, you get a production and development license but I think the best way to do it is with DEV and Prod project in the Production box. Use the development box for testing updates and really crazy things. With the Dev and Prod projects on the same box, you just publish from Dev to Prod and you are done. Users only have access to the Prod projects so no one can mess up what you are working on.
Security - If you have a hierarchy (subsidiaries, divisions, department, teams) and you want each group to see only their data, then Security hierarchies are for you!
Dependent filters! What's this you ask? Here is an example of how it can be used, in your company you have departments and who works for what department is in your database. You make a dashboard that has a department filter (only show these departments), a managers filter, and employee filter. Not every manager or employee is in multiple departments usually only one. With dependent filters you can say that the manager and employee filter are dependent on what is selected in the departments filter so when you go to filter them they only show the managers or employees that are part of that department, and you can even it do so employees are not only dependent on department but on manager as well. Then it gets even better as it can be done in reverse as well so when you select a manager then go to the department it only shows the departments he works for (there are better situations where this is more useful).
It is scriptable! From calculate columns, null replacements, button actions, load actions, hover over events there a way to do what you want.
They are constantly improving and listens to your suggestions.
Not too many cons for how we use the application. It really is easy and powerful. Very powerful.
Licensing is one thing that could be looked into. It is simple, but a little confusing. For example, if I get a license today, but a new release comes out tomorrow, it seems that the license doesn't work with the new release. Maybe that is by design, but it would be nice to clearly understand.
It took my BI team one year to become productive at developing useful content on the IBM Cognos platform. After this year, the reports being developed for a client were stale and no longer relative to the ever changing needs of the business client. Given the same opportunity, I would select a platform that allows the team to quickly produce BI content. Fail fast and recover quickly!
We have a strong user base (3500 users) that are highly utilizing this tool. Basic users are able to consume content within the applied security model. We have a set of advanced users that really push the limits of Cognos with Report and Query Studio. These users have created a lot of personal content and stored it in 'My Reports'. Users enjoy this flexibility.
We are still in the implementation phase, but so far we are finding it to be easy to use and learn. The eLearning courses that they have made available for free, as well as User Forums and other training videos have made even difficult concepts easier to understand.
Reports can typically be viewed through any browser that can access the server, so the availability is ultimately up to what the company utilizing it is comfortable with allowing, though report development tends to be more picky about browsers and settings as mentioned above. It also has an optional iPad app and general mobile browsing support, but dashboards lack the mobile compatibility. What keeps it from getting a higher score is the desktop tools that are vital to the development process. The compatibility with only Windows when the server has a wide range of compatibility can be a real sore point for a company that outfits its employees exclusively with Mac or Linux machines. Of course, if they are planning on outsourcing the development anyways, it's a rather moot point
Overall no major complaints but it doesn't handle DMR (Dimensionally Modeled for Relational) very well. DMR modelling is a capability that IBM Cognos Framework Manager provides allowing you to specify dimensional information for relational metadata and allows for OLAP-style queries. However, the capability is not very efficient and, for example, if I'm using only 2 columns on a 20-column model, the software is not smart enough to exclude 18 columns and the query side gets progressively larger and larger until it's effectively unusable.
Why is their web application not working as fast as you think it should? They never know, and it is always a a bunch of shots in the dark to find out. Trying to download software from them is like trying to find a book at the library before computers were invented.
We have bi-weekly calls with our Success Manager, as well as access to support as needed. Any question that I have had, multiple people have been willing and able to jump on a call to talk me through it, or send an email with the solution
Onsite training provided by IBM Cognos was effective and as expected. They did not perform training with our data which was a bit difficult for our end-users.
The online courses they offer are thorough and presented in such a way that someone who isn't already familiar with the general design methodologies used in this field will be capable of making a good design. The training environments are provided as a fully self contained virtual machine with everything needed already to create the environments. We've had some persisting issues with the environments becoming unavailable, but support has been responsive when these issues arise and straightening them out for us
The implementation was handled very well. The initial implementation exposed a lot of disagreement between our campuses and departments as to how we define data. This was not entirely unexpected, but I thought that we did a nice job as a team to work through some of these challenges.
Power BI is stronger for quick ad-hoc analysis and dashboards, but IBM Cognos Analytics is better when consistency, precision, and mass distribution matter. Tableau is best for interactive analysis, while IBM Cognos Analytics is better for standardized, repeatable enterprise reporting. Sigma shines for customizable dashboards and drill-down analysis while IBM Cognos Analytics holds an edge in data discovery and visualization.
We have tested Tableau prior to Dundas BI and though Tableau is a great package in itself, Dundas BI is much more cost-effective for our needs and requirements and hence zeroed in on Dundas BI. We have also tried microstrategy but it has a very dated UI and doesn't suit our needs in today's more modern world
The Cognos architecture is well suited for scalability. However, the architecture must be designed with scalability in mind from day one of the implementation. We recently upgraded from 10.1 to 10.2.1 and took the opportunity to revamp our architecture. It is now poised for future growth and scalability.