IBM Cognos Analytics vs. Numerics
IBM Cognos Analytics vs. Numerics
| Product | Rating | Most Used By | Product Summary | Starting Price |
|---|---|---|---|---|
 IBM Cognos Analytics | N/A | IBM Cognos is a full-featured business intelligence suite by IBM, designed for larger deployments. It comprises Query Studio, Reporting Studio, Analysis Studio and Event Studio, and Cognos Administration along with tools for Microsoft Office integration, full-text search, and dashboards. | $10 per month per user | |
 Numerics | N/A | Numerics aims to help companies make better decisions by making relevant KPIs accessible at the right time. It allows users to visualize all vital business statistics, live, in one place on iPhone, iPad, Apple Watch and Apple TV. According to the vendors, key capabilities include: Visualize KPIs in easy to understand charts: Visualize metrics in colorful pie charts, interactive line graphs, number tallies, top lists, radar style density charts, month density… | N/A |
| IBM Cognos Analytics | Numerics | |||||||||||||||
|---|---|---|---|---|---|---|---|---|---|---|---|---|---|---|---|---|
| Editions & Modules |
| No answers on this topic | ||||||||||||||
| Offerings |
| |||||||||||||||
| Entry-level Setup Fee | Optional | No setup fee | ||||||||||||||
| Additional Details | — | — | ||||||||||||||
| More Pricing Information | ||||||||||||||||
| IBM Cognos Analytics | Numerics |
|---|
| IBM Cognos Analytics | Numerics | |||||||||||||||||||||
|---|---|---|---|---|---|---|---|---|---|---|---|---|---|---|---|---|---|---|---|---|---|---|
| BI Standard Reporting |
| |||||||||||||||||||||
| Ad-hoc Reporting |
| |||||||||||||||||||||
| Report Output and Scheduling |
| |||||||||||||||||||||
| Data Discovery and Visualization |
| |||||||||||||||||||||
| Access Control and Security |
| |||||||||||||||||||||
| Mobile Capabilities |
| |||||||||||||||||||||
| Application Program Interfaces (APIs) / Embedding |
|
| IBM Cognos Analytics | Numerics | |
|---|---|---|
| Likelihood to Recommend | 7.1 (0 ratings) | - (0 ratings) |
| Likelihood to Renew | 9.4 (0 ratings) | - (0 ratings) |
| Usability | 8.1 (0 ratings) | - (0 ratings) |
| Availability | 8.6 (0 ratings) | - (0 ratings) |
| Performance | 9.0 (0 ratings) | - (0 ratings) |
| Support Rating | 10.0 (0 ratings) | - (0 ratings) |
| In-Person Training | 8.7 (0 ratings) | - (0 ratings) |
| Online Training | 8.0 (0 ratings) | - (0 ratings) |
| Implementation Rating | 7.0 (0 ratings) | - (0 ratings) |
| Configurability | 7.0 (0 ratings) | - (0 ratings) |
| Ease of integration | 6.0 (0 ratings) | - (0 ratings) |
| Product Scalability | 8.2 (0 ratings) | - (0 ratings) |
| Vendor post-sale | 7.0 (0 ratings) | - (0 ratings) |
| Vendor pre-sale | 7.0 (0 ratings) | - (0 ratings) |
| IBM Cognos Analytics | Numerics | |
|---|---|---|
| Likelihood to Recommend | 
 Josepe Bonfante Social Media Strategist |  No answers on this topic |
| Pros |
| No answers on this topic |
| Cons |
| No answers on this topic |
| Likelihood to Renew |
 Dwight Taylor Manager of BI Reporting | No answers on this topic |
| Usability |
 Robert Goodman Director, Business Intelligence & Analytics | No answers on this topic |
| Reliability and Availability |
 Gerrit Goewey Senior Analytics Consultant | No answers on this topic |
| Performance |
 Meghdeep Raval, PMP Manager, Data Architecture | No answers on this topic |
| Support Rating |
 Jonathan Kyrlach Business Intelligence Architect | No answers on this topic |
| In-Person Training |
Robert Goodman Director, Business Intelligence & Analytics | No answers on this topic |
| Online Training |
Gerrit Goewey Senior Analytics Consultant | No answers on this topic |
| Implementation Rating |
Robert Goodman Director, Business Intelligence & Analytics | No answers on this topic |
| Alternatives Considered |
| No answers on this topic |
| Scalability |
Robert Goodman Director, Business Intelligence & Analytics | No answers on this topic |
| Return on Investment |
| No answers on this topic |
| ScreenShots | IBM Cognos Analytics Screenshots      | Numerics Screenshots   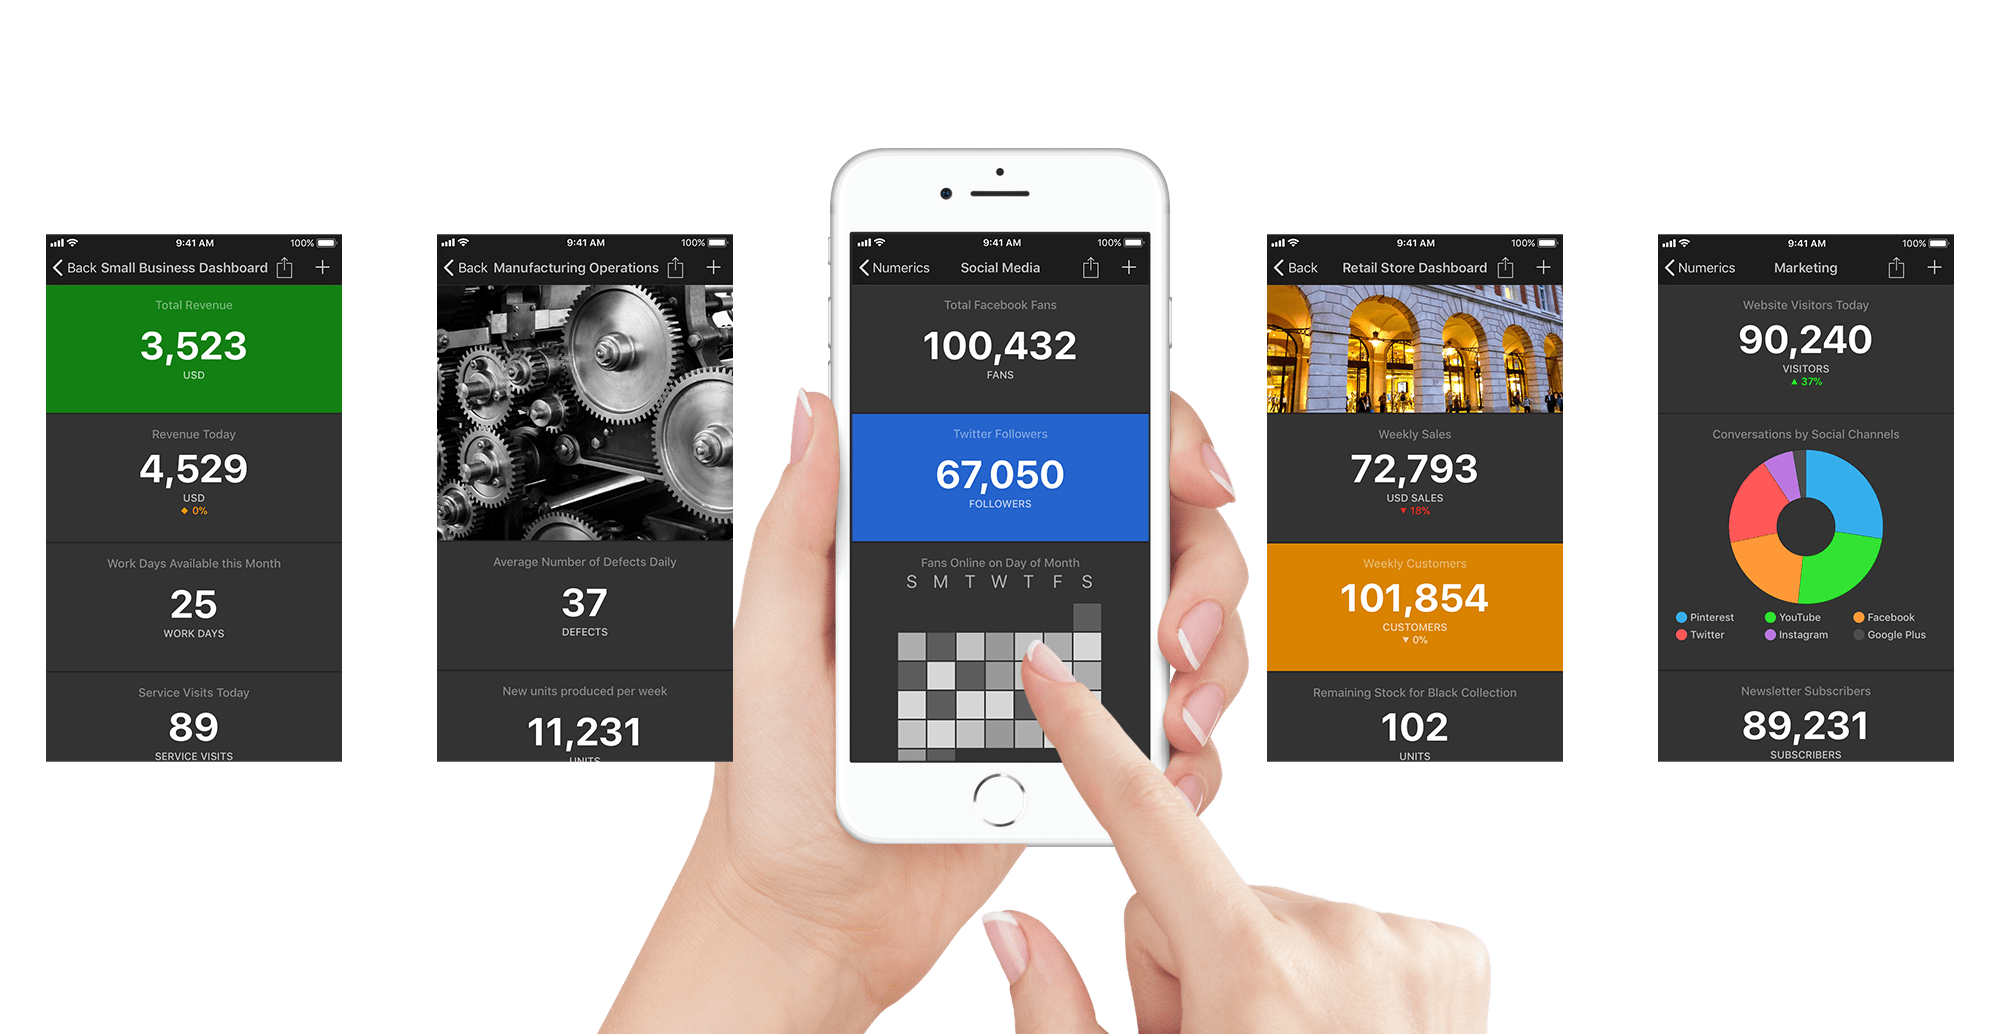  |