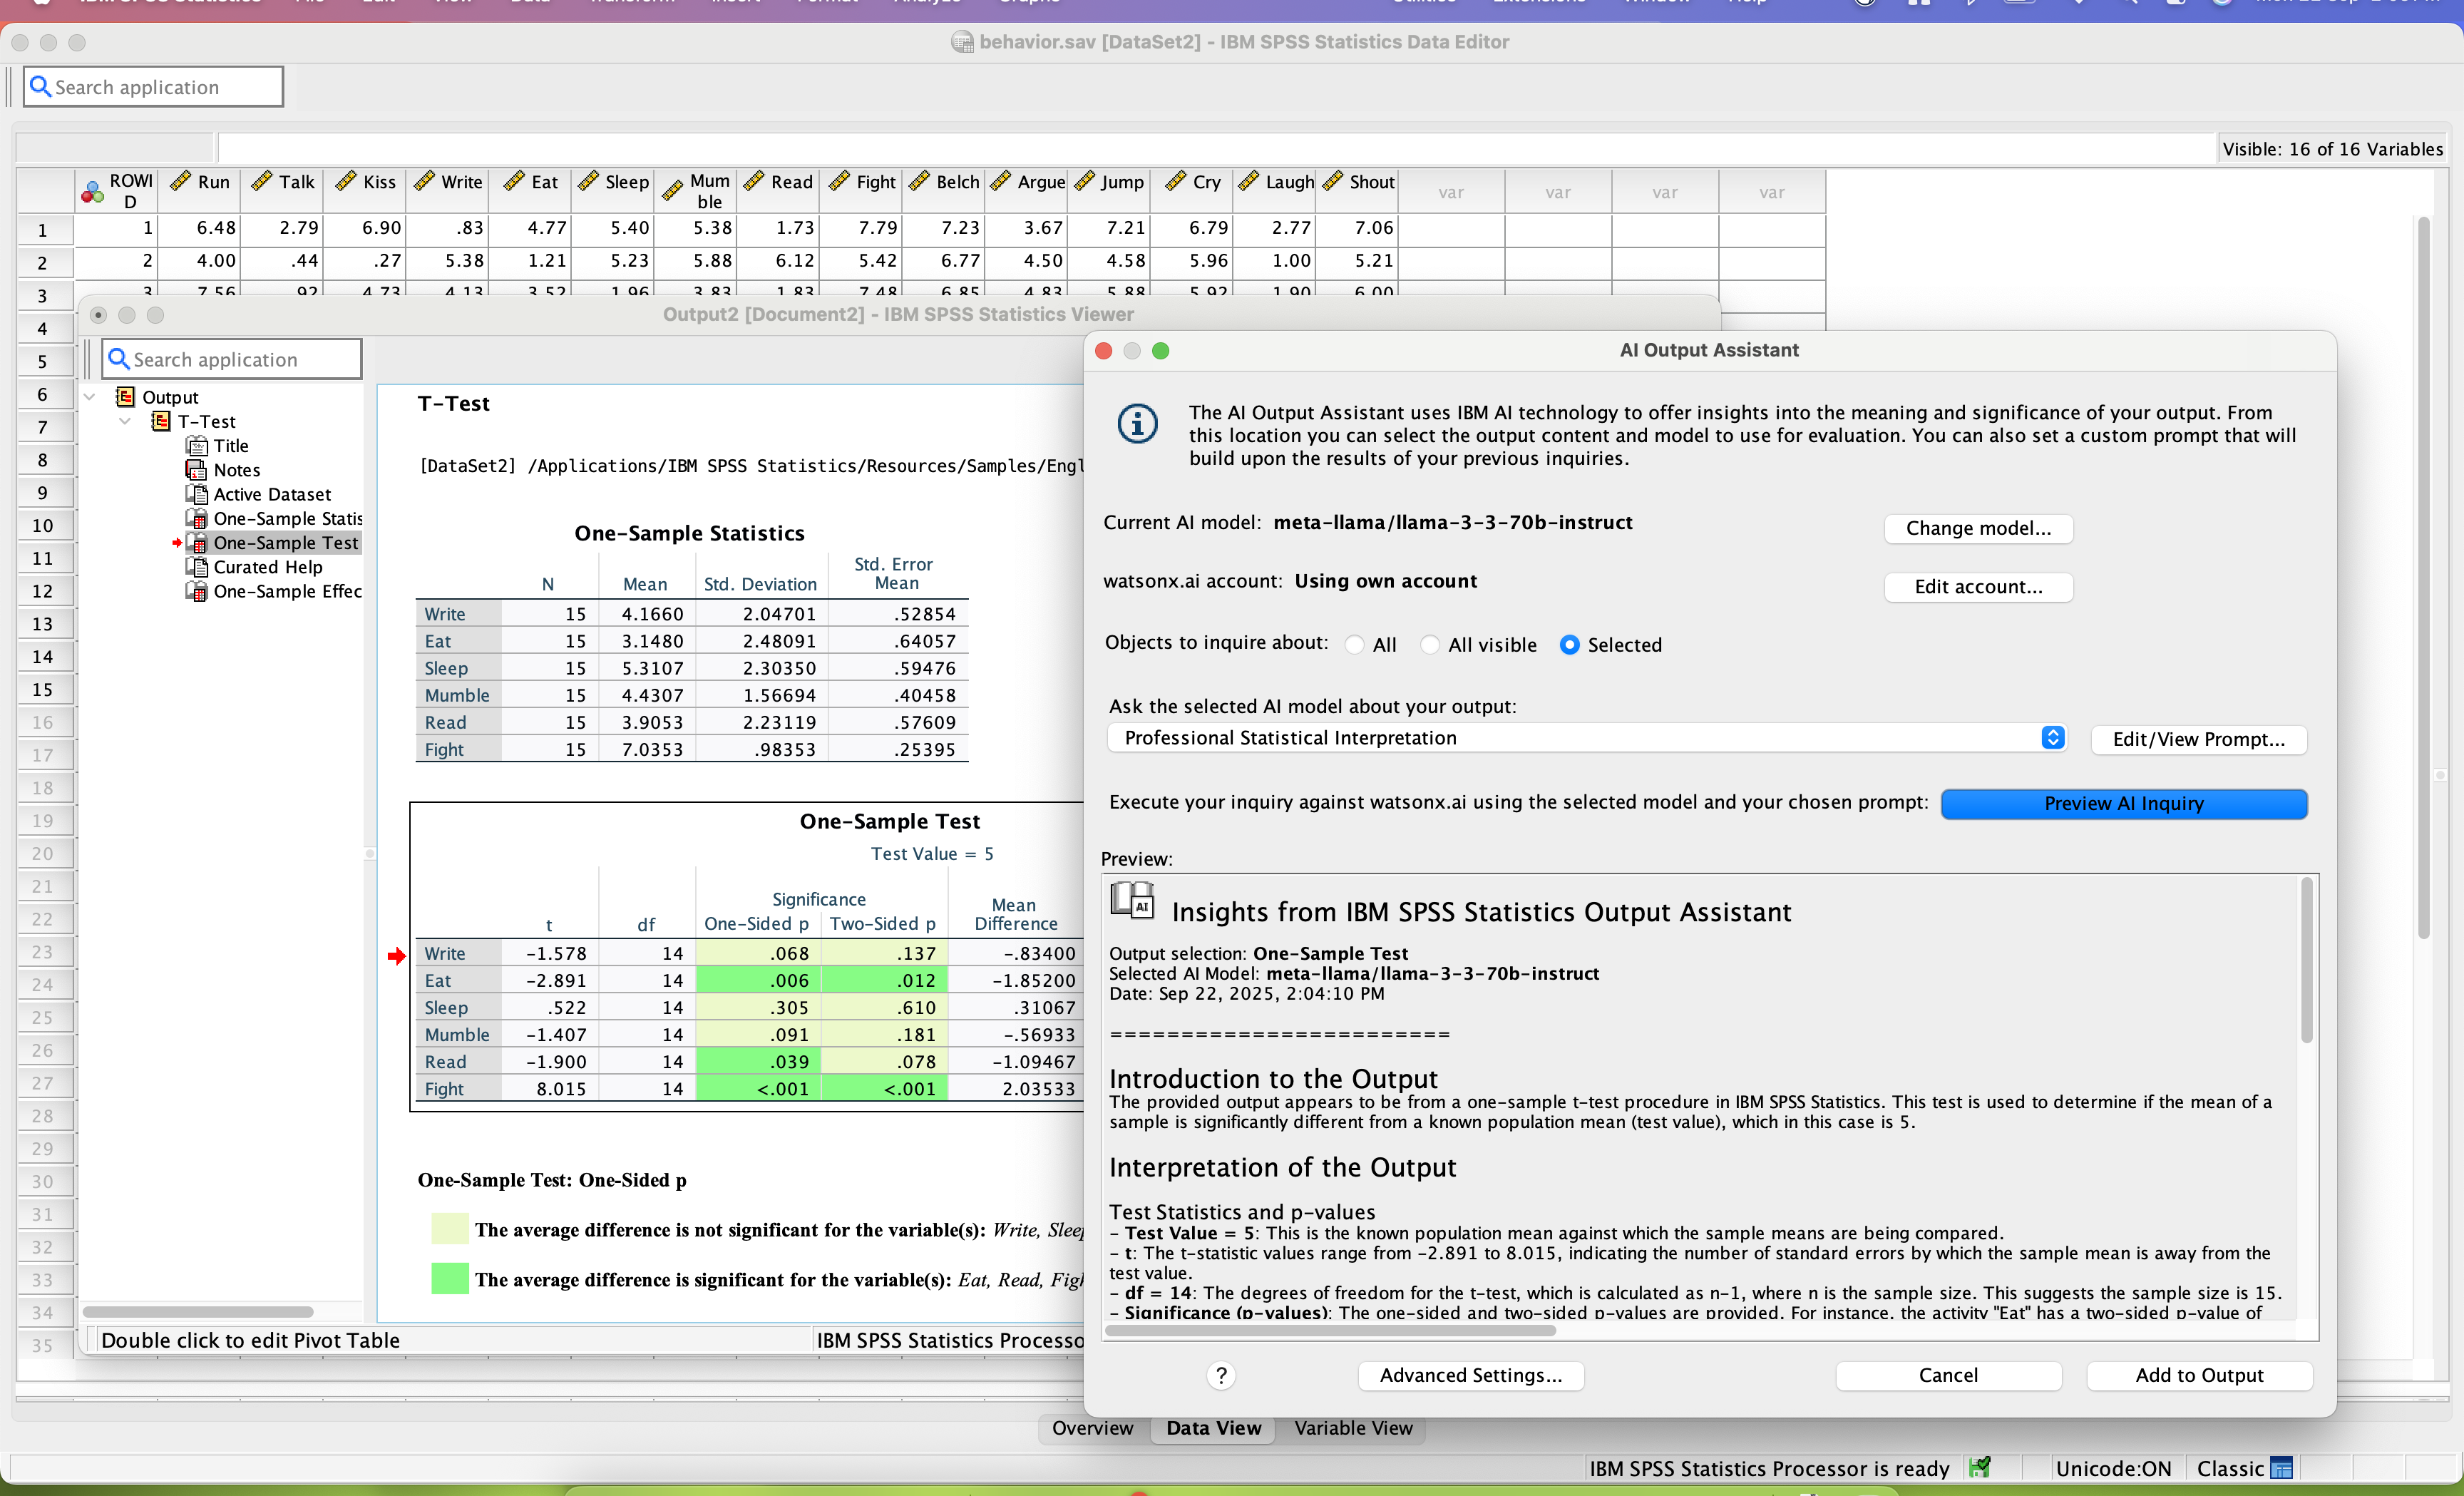
SPSS Statistics is a software package used for statistical analysis. It is now officially named "IBM SPSS Statistics". Companion products in the same family are used for survey authoring and deployment (IBM SPSS Data Collection), data mining (IBM SPSS Modeler), text analytics, and collaboration and deployment (batch and automated scoring services).
$99
per month per user
KNIME Analytics Platform
Score 7.8 out of 10
N/A
KNIME enables users to analyze, upskill, and scale data science without any coding. The platform that lets users blend, transform, model and visualize data, deploy and monitor analytical models, and share insights organization-wide with data apps and services.
Stacks up pretty well, as this is the best geospatial analysis tool next only to ArcGIS, but does almost everything that other packages do almost as well. However, there is a considerable need to improve and include new techniques like the random forest, etc. which IBM SPSS …
Overall, IBM SSPS outperforms competitors in almost every arena. It's ability to both perform statistical analysis and geospatial analysis is unrivaled. Additionally, it is superior in handling large or complex datasets over many of the other similar programs. The only program …
There are two aspects which put KNIME Analytics Platform ahead of other products. Firstly the fact that KNIME Analytics Platform comes at no cost and no restrictions on its use is an instant winner for any organisation wanting to democratise their data. It means that a client …
SPSS is well-suited for the following: 1) User Behavior Analysis: SPSS handles large datasets to analyze user behavior data. 2) Customer Satisfaction / Foundational Surveys: SPSS facilitates analysis of quant data from satisfaction surveys, keeping us informed about customer needs and preferences. 3) A/B test analysis: SPSS statistical tools for A/B test analysis, which helps optimize user experience of our products. Scenarios where SPSS are less appropriate: 1) Qualitative Data Analysis: I do not use SPSS for open-ended survey responses/qual data. 2) Live/in-vivo data analysis: SPSS is not ideal for real-time data processing. 3) Complex Data Integration: SPSS isn’t the best fit for complex data integration tasks
KNIME Analytics Platform has vastly improved our effectiveness when working with large data sets. The self documenting GUI allows analysts to focus on what they are trying to accomplish, not complex code syntax. If we were to use traditional tools, like SQL, work would take much longer and it would be more difficult to collaborate both internally and with clients. Since KNIME Analytics Platform is database oriented, some spreadsheet functions are not supported, which is as it should be. For small data sets we often use Excel vlookup and pivot tables in place of KNIME Analytics Platform. If VBA code is requried, we go to KNIME Analytics Platform as we find VBA to be unstable in Excel.
SPSS has been around for quite a while and has amassed a large suite of functionality. One of its longest-running features is the ability to automate SPSS via scripting, AKA "syntax." There is a very large community of practice on the internet who can help newbies to quickly scale up their automation abilities with SPSS. And SPSS allows users to save syntax scripting directly from GUI wizards and configuration windows, which can be a real life-saver if one is not an experienced coder.
Many statistics package users are doing scientific research with an eye to publish reproducible results. SPSS allows you to save datasets and syntax scripting in a common format, facilitating attempts by peer reviewers and other researchers to quickly and easily attempt to reproduce your results. It's very portable!
SPSS has both legacy and modern visualization suites baked into the base software, giving users an easily mountable learning curve when it comes to outputting charts and graphs. It's very easy to start with a canned look and feel of an exported chart, and then you can tweak a saved copy to change just about everything, from colors, legends, and axis scaling, to orientation, labels, and grid lines. And when you've got a chart or graph set up the way you like, you can export it as an image file, or create a template syntax to apply to new visualizations going forward.
SPSS makes it easy for even beginner-level users to create statistical coding fields to support multidimensional analysis, ensuring that you never need to destructively modify your dataset.
In closing, SPSS's long and successful tenure ensures that just about any question a new user may have about it can be answered with a modicum of Google-fu. There are even several fully-fledged tutorial websites out there for newbie perusal.
Visual programming as oppose to scripting encourages data analysts to reap deeper insights from their data
Large community contribution in extending the KNIME Analytics Platform into other areas of analytics, e.g. Text Analytics, Predictive Analytics, ML, etc.
Open source with periodic updates ensures it is equipped to deal with the most sophisticated data analytics use case
Automation - e.g. RapidMiner Studio provides a Turbo Prep function, where one can get to working on models more quickly (RapidMiner is not open source though)
KNIME does not replace a regular reporting tool - it is not meant to. However, if I have already spent some time developing a data acquisition and analytical model, it would be nice to be able to deploy, for example, a monitoring or reporting module that would process data autonomously and react accordingly.
It's super easy to use for newbies and super powerful for power users! It does EVERYTHING you are usually asked to do analytically. Their Help Desk is PHENOMENAL. And I find the upgrade and renewal price to be a good deal.
We are happy with Knime product and their support. Knime AP is versatile product and even can execute Python scripts if needed. It also supports R execution as well; however, it is not being used at our end
SPSS is beginner friendly and user-friendly for beginner analysts and simple statistical tests. It's "click and go" interface does take some learning, but overall this is much easier than other programs I have used and seen. Compared to SAS software, SPSS takes a great deal less familiarizing and it not a matter of learning a coding language like SAS and RStudio.
The training KNIME Analytics Platform provide helps you get to grips with a product that is already very intuitive. There is a KNIME Analytics Platform way of thinking about addressing problems, but once you understand a couple of patterns which you see again and again in your workflow it all makes sense.
I have not contacted IBM SPSS for support myself. However, our IT staff has for trying to get SPSS Text Analytics Module to work. The issue was never resolved, but I'm not sure if it was on the IT's end or on SPSS's end
KNIME's HQ is in Europe, which makes it hard for US companies to get customer service in time and on time. Their customer service also takes on average 1 to 2 weeks to follow up with your request. KNIME's documentation is also helpful but it does not provide you all the answers you need some of the time.
Have a plan for managing the yearly upgrade cycle. Most users work in the desktop version, so there needs to be a mechanism for either pushing out new versions of the software or a key manager to deal with updated licensing keys. If you have a lot of users this needs to be planned for in advance.
KNIME Analytics Platform is easy to install on any Windows, Mac or Linux machine. The KNIME Server product that is currently being replaced by the KNIME Business Hub comes as multiple layers of software and it took us some time to set up the system right for stability. This was made harder by KNIME staff's deeper expertise in setting up the Server in Linux rather than Windows environment. The KNIME Business Hub promises to have a simpler architecture, although currently there is no visibility of a Windows version of the product.
If you have made it this far, you should have a very good idea of how SPSS stacks up the competition (data processing and analytics tools). Even the free ones, such as r Studio or Stata, are leaps and bounds ahead of SPSS. IBM is resting on a reputation developed nearly 30 years ago and has shown no desire to improve.
There are two aspects which put KNIME Analytics Platform ahead of other products. Firstly the fact that KNIME Analytics Platform comes at no cost and no restrictions on its use is an instant winner for any organisation wanting to democratise their data. It means that a client is free to install it on as many machines as they wish without worrying about costs, the number of seats required or payment models or procurement negotiation. It also means that we are not building costs into our clients business. Secondly, KNIME Analytics Platform has a very comprehensive set of tools for importing/exporting data, data manipulation and data science. Some products offer analytics packages on top of their base offering at additional cost and they are still not as comprehensive as what you get with KNIME Analytics Platform for free. For some types of analysis you may require to download additional packages with KNIME Analytics Platform, but its invariably at no cost, those packages are kept out of the main download to keep the size down. Due to the easy integration with R and Python, I view KNIME Analytics Platform as also having the capabilities of those languages too. This has helped me in the past with seamlessly importing a rare filetype and using very specific models not directly available in KNIME Analytics Platform.
I found SPSS easier to use than SAS as it's more intuitive to me.
The learning curve to use SPSS is less compared to SAS.
I used SAS, to a much lesser extent than SPSS. However, it seems that SAS may be more suitable for users who understand programming. With SPSS, users can perform many statistical tests without the need to know programming.
It is suited for data mining or machine learning work but If we're looking for advanced stat methods such as mixed effects linear/logistics models, that needs to be run through an R node.
Thinking of our peers with an advanced visualization techniques requirement, it is a lagging product.