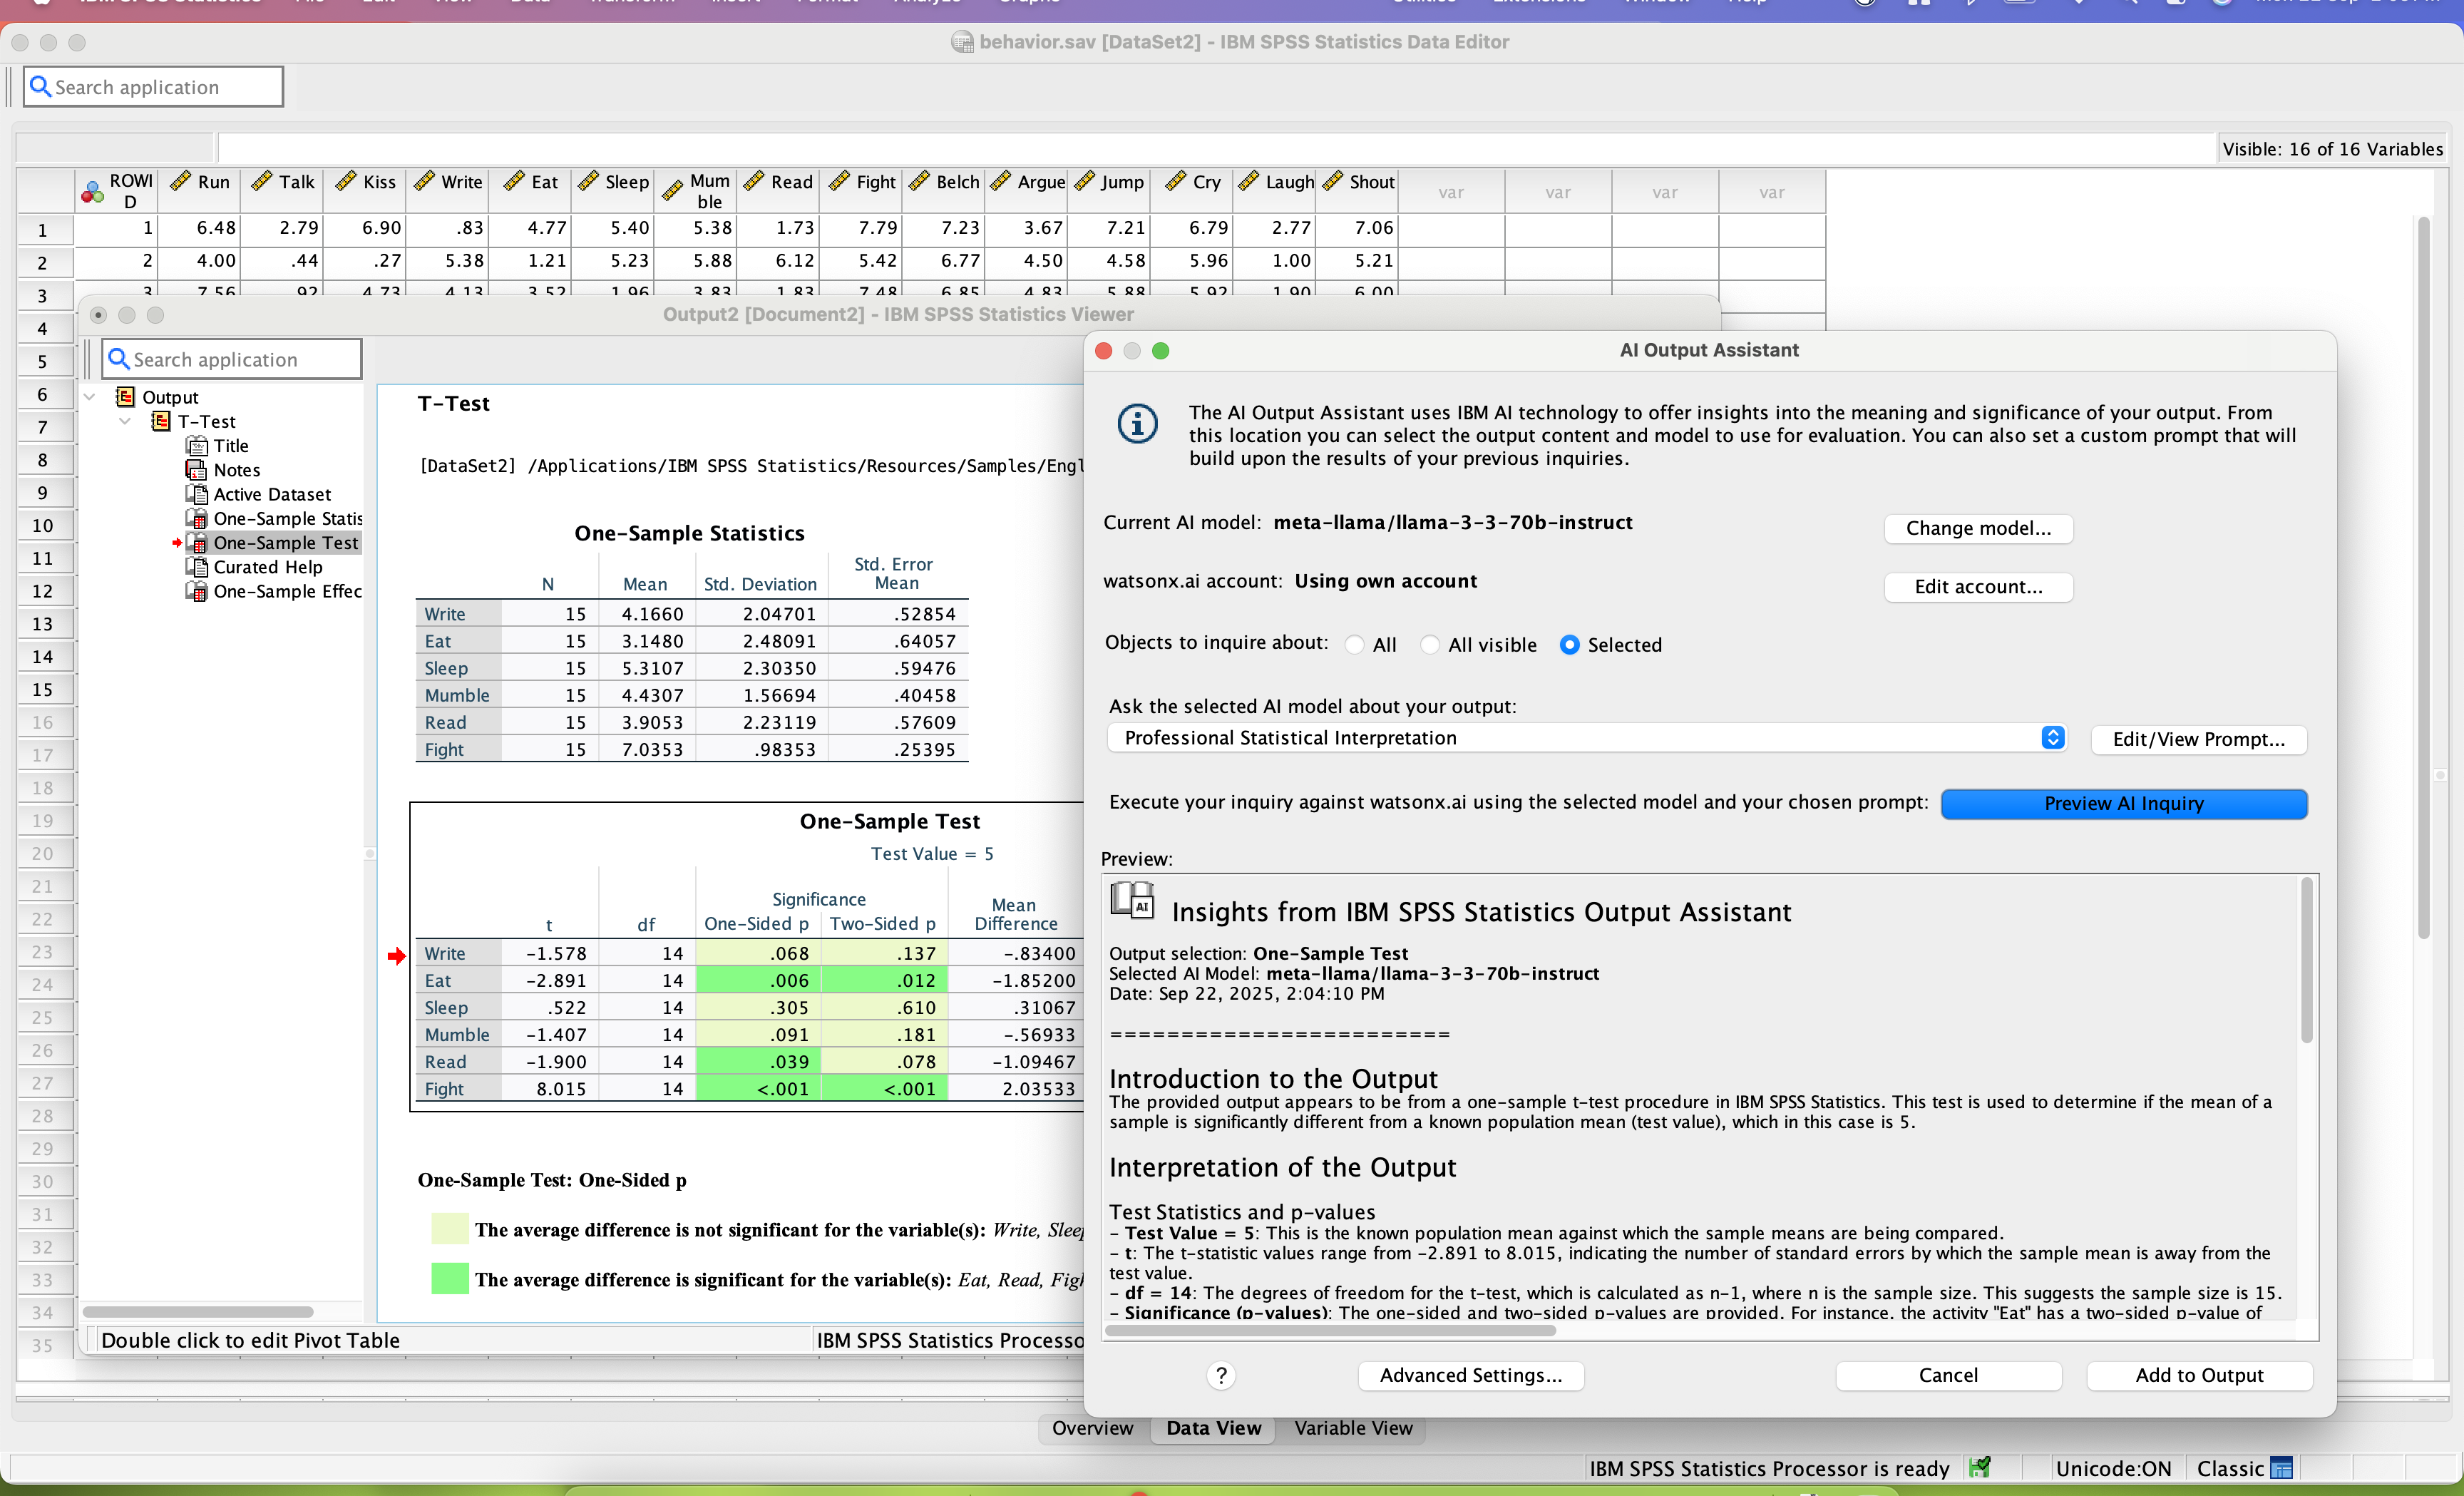
SPSS Statistics is a software package used for statistical analysis. It is now officially named "IBM SPSS Statistics". Companion products in the same family are used for survey authoring and deployment (IBM SPSS Data Collection), data mining (IBM SPSS Modeler), text analytics, and collaboration and deployment (batch and automated scoring services).
$99
per month per user
SAS Enterprise Guide
Score 8.1 out of 10
N/A
SAS Enterprise Guide is a menu-driven, Windows GUI tool for SAS.
N/A
Pricing
IBM SPSS Statistics
SAS Enterprise Guide
Editions & Modules
Base
USD 3,830
one-time fee per user
Standard
USD 8,440
one-time fee per user
Professional
USD 16,900
one-time fee per user
Premium
USD 25,200
one-time fee per user
Monthly subscription
USD 99
per month per user
Annual subscription
USD 1,188.00
per year per user
No answers on this topic
Offerings
Pricing Offerings
IBM SPSS Statistics
SAS Enterprise Guide
Free Trial
Yes
No
Free/Freemium Version
No
No
Premium Consulting/Integration Services
No
No
Entry-level Setup Fee
No setup fee
No setup fee
Additional Details
—
—
More Pricing Information
Community Pulse
IBM SPSS Statistics
SAS Enterprise Guide
Considered Both Products
IBM SPSS Statistics
Verified User
Anonymous
Chose IBM SPSS Statistics
Advanced statistical analysis is possible which is not possible in powerbi. It is very much easy to prepare basic charts. I dept statistical tests like regression analysis can be done. It is user -friendly and even layman can understand basic data easily through IBM SPSS's …
Data Scientist ,Pre-Sales,Consultor/Instrutor em Estatística e Mineração de dados em Big Data
Chose IBM SPSS Statistics
I also point out that the two softwares are complementary, then IBM SPSS Statistics works very well with statistical tests, creation and visualization of detailed tables and creation of statistical project models and project models. The IBM SPSS Modeler helps you quickly view …
Occupational Safety, Health, and Environment Technician
Chose IBM SPSS Statistics
I have also used other statistical software such as the SAP Predictive Analytics software, SAP possesses most of the decode options as SPS, but it is not as graphical and easier to use as SPS. Thus, IBM SPSS Statistics was chosen as a primary and powerful statistical tool that …
We had not ever used anything as diverse as IBM SPSS Statistics before, so don't have much to compare it to but would highly recommend it based on all the previous comments before here. The platform is easy to use and again gives you a quick snapshot of company health based on …
If you have made it this far, you should have a very good idea of how SPSS stacks up the competition (data processing and analytics tools). Even the free ones, such as r Studio or Stata, are leaps and bounds ahead of SPSS. IBM is resting on a reputation developed nearly 30 …
We used IBM SPSS Statistics as it works well with the other IBM tools that we use. It may not work as well for smaller organizations with limited budget/resources. We have a mix of technical and devops people and this tool is easily used by everyone on the team globally.
I have on many occasions launched new versions of a big Python application in production, only to immediately drown in errors, caused by exceptions that were in turn caused by Python code where a single glance confirmed that it could never ever work and consequently had never …
IBM SPSS Statistics is much easier to use, even in classes with students, compared to other similar data analytic software that I have used previously. I selected it because of this reason and I plan to continue using it in the future. The interface is user friendly and the …
I, along with my supervised research student, used IBM SPSS Statistics compared to other software because of its simplicity and user-friendliness. A timeframe is a fundamental part of research work. Time is precious for both of us in terms of research work and using IBM SPSS …
The price of IBM SPSS and its quality-price ratio was one of the triggers for choosing the software over the competition. The ease of obtaining a demo of the product and the continuous training it presents was another of the key points in the decision making we made in the …
Its better for quick tasks, Psychology, Sociology, may lack in complex models, AI, or business-decision-making models. It's better for things that you want to compare, correlate or detect influence of one on the other. It's worse that R for complex models, custom models, big …
I also use or have used Tableau, Excel, and R (wasn’t able to list R above). Tableau is better for visualizations, Excel works for generalized/more basic statistical analysis but lacks more complex features, and R has been difficult for me to master and lacks the UI and ease of …
Compared to stata, python and MPlus, SPSS is more user friendly especially for beginners. It displays data and output in easily readable formats and makes statistics fun and easy. However, stata, python and MPlus are more ideal for complex statistical methods like structural …
IBM SPSS Statistics Logistic Regression's user-friendly interface is among its most important benefits. Without the need for sophisticated technical knowledge, users can navigate and analyze their data with ease. As a faculty member of a university, I used it using its numerous …
For my own statistical analyses, I personally use R and MPlus. However, these tools have a steep learning curve and require dedicated time and a course on their own. In m yopinion, they are not useful for trying to quickly acclimate undergrads to the new world of stats and …
We tend to shy away from open source where possible. with SPSS from our feeder university system for our co-op interns, this is a great transition and a low barrier to getting them working quickly.
IBM SPSS Statistics beats the pants off of Minitab in every area except cost. Minitab has far cheaper entry-level costs, but the software is much more limited. With the versions of Minitab I have used, importing mapping data is a non-starter. With IBM SPSS Statistics, once the …
I described this in a previous question. R is free and full of features, but time consuming to learn, especially since you have to download different libraries for whatever you're doing. I know IBM SPSS Statistics fairly well, and it has been worth the cost, but maybe not for …
Python-based platforms like Pandas or Spark are very good too at displaying data and do exploratory analysis. I definitely prefer them to SAS EG. It's just too slow, and doesn't let you peek into the data very easily. Lots of clicking, and I'd rather just write some code, …
Although not used in the enterprise, I have used Anaconda Python to shape and cleanse data from Excel reports that was too difficult for SAS to complete. The object oriented nature and the Pandas package made ingestion of the data and reshaping more useful in this use case. …
SAS EG has better Graphical User Interface to build project trees and help users to create data queries/calculations. SAS EG can handle bigger data sets compared to other programs. You can easily clean the data sets and manipulate the data. It is easier to send the project tree …
Why I prefer SAS EG: Data processing speed is much faster than that R Studio. It can load any amount of data and any type of data like structured or unstructured or semi-structured. Its output delivery system by which we have the output in PDF file makes it very comfortable to …
I haven't used SPSS myself but from what I was told, integration of data was much more limited and not easy to used. Also, the number of people with SPSS knowledge is less than the number of SAS users so finding workforce can be an issue. The whole SAS solution just made much …
SPSS is well-suited for the following: 1) User Behavior Analysis: SPSS handles large datasets to analyze user behavior data. 2) Customer Satisfaction / Foundational Surveys: SPSS facilitates analysis of quant data from satisfaction surveys, keeping us informed about customer needs and preferences. 3) A/B test analysis: SPSS statistical tools for A/B test analysis, which helps optimize user experience of our products. Scenarios where SPSS are less appropriate: 1) Qualitative Data Analysis: I do not use SPSS for open-ended survey responses/qual data. 2) Live/in-vivo data analysis: SPSS is not ideal for real-time data processing. 3) Complex Data Integration: SPSS isn’t the best fit for complex data integration tasks
For writing out longer code creation for shaping data on complicated reports, the clean UI is helpful. If exploring data though, SAS Studio would be better suited given its easier interface for GUI graph building.
SPSS has been around for quite a while and has amassed a large suite of functionality. One of its longest-running features is the ability to automate SPSS via scripting, AKA "syntax." There is a very large community of practice on the internet who can help newbies to quickly scale up their automation abilities with SPSS. And SPSS allows users to save syntax scripting directly from GUI wizards and configuration windows, which can be a real life-saver if one is not an experienced coder.
Many statistics package users are doing scientific research with an eye to publish reproducible results. SPSS allows you to save datasets and syntax scripting in a common format, facilitating attempts by peer reviewers and other researchers to quickly and easily attempt to reproduce your results. It's very portable!
SPSS has both legacy and modern visualization suites baked into the base software, giving users an easily mountable learning curve when it comes to outputting charts and graphs. It's very easy to start with a canned look and feel of an exported chart, and then you can tweak a saved copy to change just about everything, from colors, legends, and axis scaling, to orientation, labels, and grid lines. And when you've got a chart or graph set up the way you like, you can export it as an image file, or create a template syntax to apply to new visualizations going forward.
SPSS makes it easy for even beginner-level users to create statistical coding fields to support multidimensional analysis, ensuring that you never need to destructively modify your dataset.
In closing, SPSS's long and successful tenure ensures that just about any question a new user may have about it can be answered with a modicum of Google-fu. There are even several fully-fledged tutorial websites out there for newbie perusal.
I would like to see advance interactions with external databases to be able to kill ongoing queries from SAS. As of now, you can stop pretty much any ongoing process besides the one running on a remote database (killing SAS/EG doesn't stop the remote process)
When creating prompts for programs, it would be nice to be able to have conditional prompts (based on the selection of other prompts). The prompts are clearly a recent feature and constantly under development but I wish it would be more powerful.
More of a SAS metadata issue but when loading SAS/EG (first connection to the server), it takes a few seconds which feels like a long time. I really don't understand why the initialization of the session can take so long. Don't get me wrong, this has no real impact on productivity but that 10s delay just feels really like eternity when you want to run some code in a new session.
It's super easy to use for newbies and super powerful for power users! It does EVERYTHING you are usually asked to do analytically. Their Help Desk is PHENOMENAL. And I find the upgrade and renewal price to be a good deal.
SPSS is beginner friendly and user-friendly for beginner analysts and simple statistical tests. It's "click and go" interface does take some learning, but overall this is much easier than other programs I have used and seen. Compared to SAS software, SPSS takes a great deal less familiarizing and it not a matter of learning a coding language like SAS and RStudio.
It's not all bad, but I don't believe that an enterprise purchase of SAS is worth the expense considering the widely available set of tools in the data analytics space at the moment. In my company, it's a good tool because others use it. Otherwise, I wouldn't purchase a new set of it because it doesn't have some of the better analytical functions in it.
I have not contacted IBM SPSS for support myself. However, our IT staff has for trying to get SPSS Text Analytics Module to work. The issue was never resolved, but I'm not sure if it was on the IT's end or on SPSS's end
Although I use SAS support for information on functions, these are SAS related and haven't really come across anything that is specifically for SAS EG.
Have a plan for managing the yearly upgrade cycle. Most users work in the desktop version, so there needs to be a mechanism for either pushing out new versions of the software or a key manager to deal with updated licensing keys. If you have a lot of users this needs to be planned for in advance.
I've not worked hands-on with the implementation team, but there were no escalations barring a few hiccups in the deployment due to change in requirement & adoption to our company's remote servers.
If you have made it this far, you should have a very good idea of how SPSS stacks up the competition (data processing and analytics tools). Even the free ones, such as r Studio or Stata, are leaps and bounds ahead of SPSS. IBM is resting on a reputation developed nearly 30 years ago and has shown no desire to improve.
Python-based platforms like Pandas or Spark are very good too at displaying data and do exploratory analysis. I definitely prefer them to SAS EG. It's just too slow, and doesn't let you peek into the data very easily. Lots of clicking, and I'd rather just write some code, rather do clicking.
I found SPSS easier to use than SAS as it's more intuitive to me.
The learning curve to use SPSS is less compared to SAS.
I used SAS, to a much lesser extent than SPSS. However, it seems that SAS may be more suitable for users who understand programming. With SPSS, users can perform many statistical tests without the need to know programming.