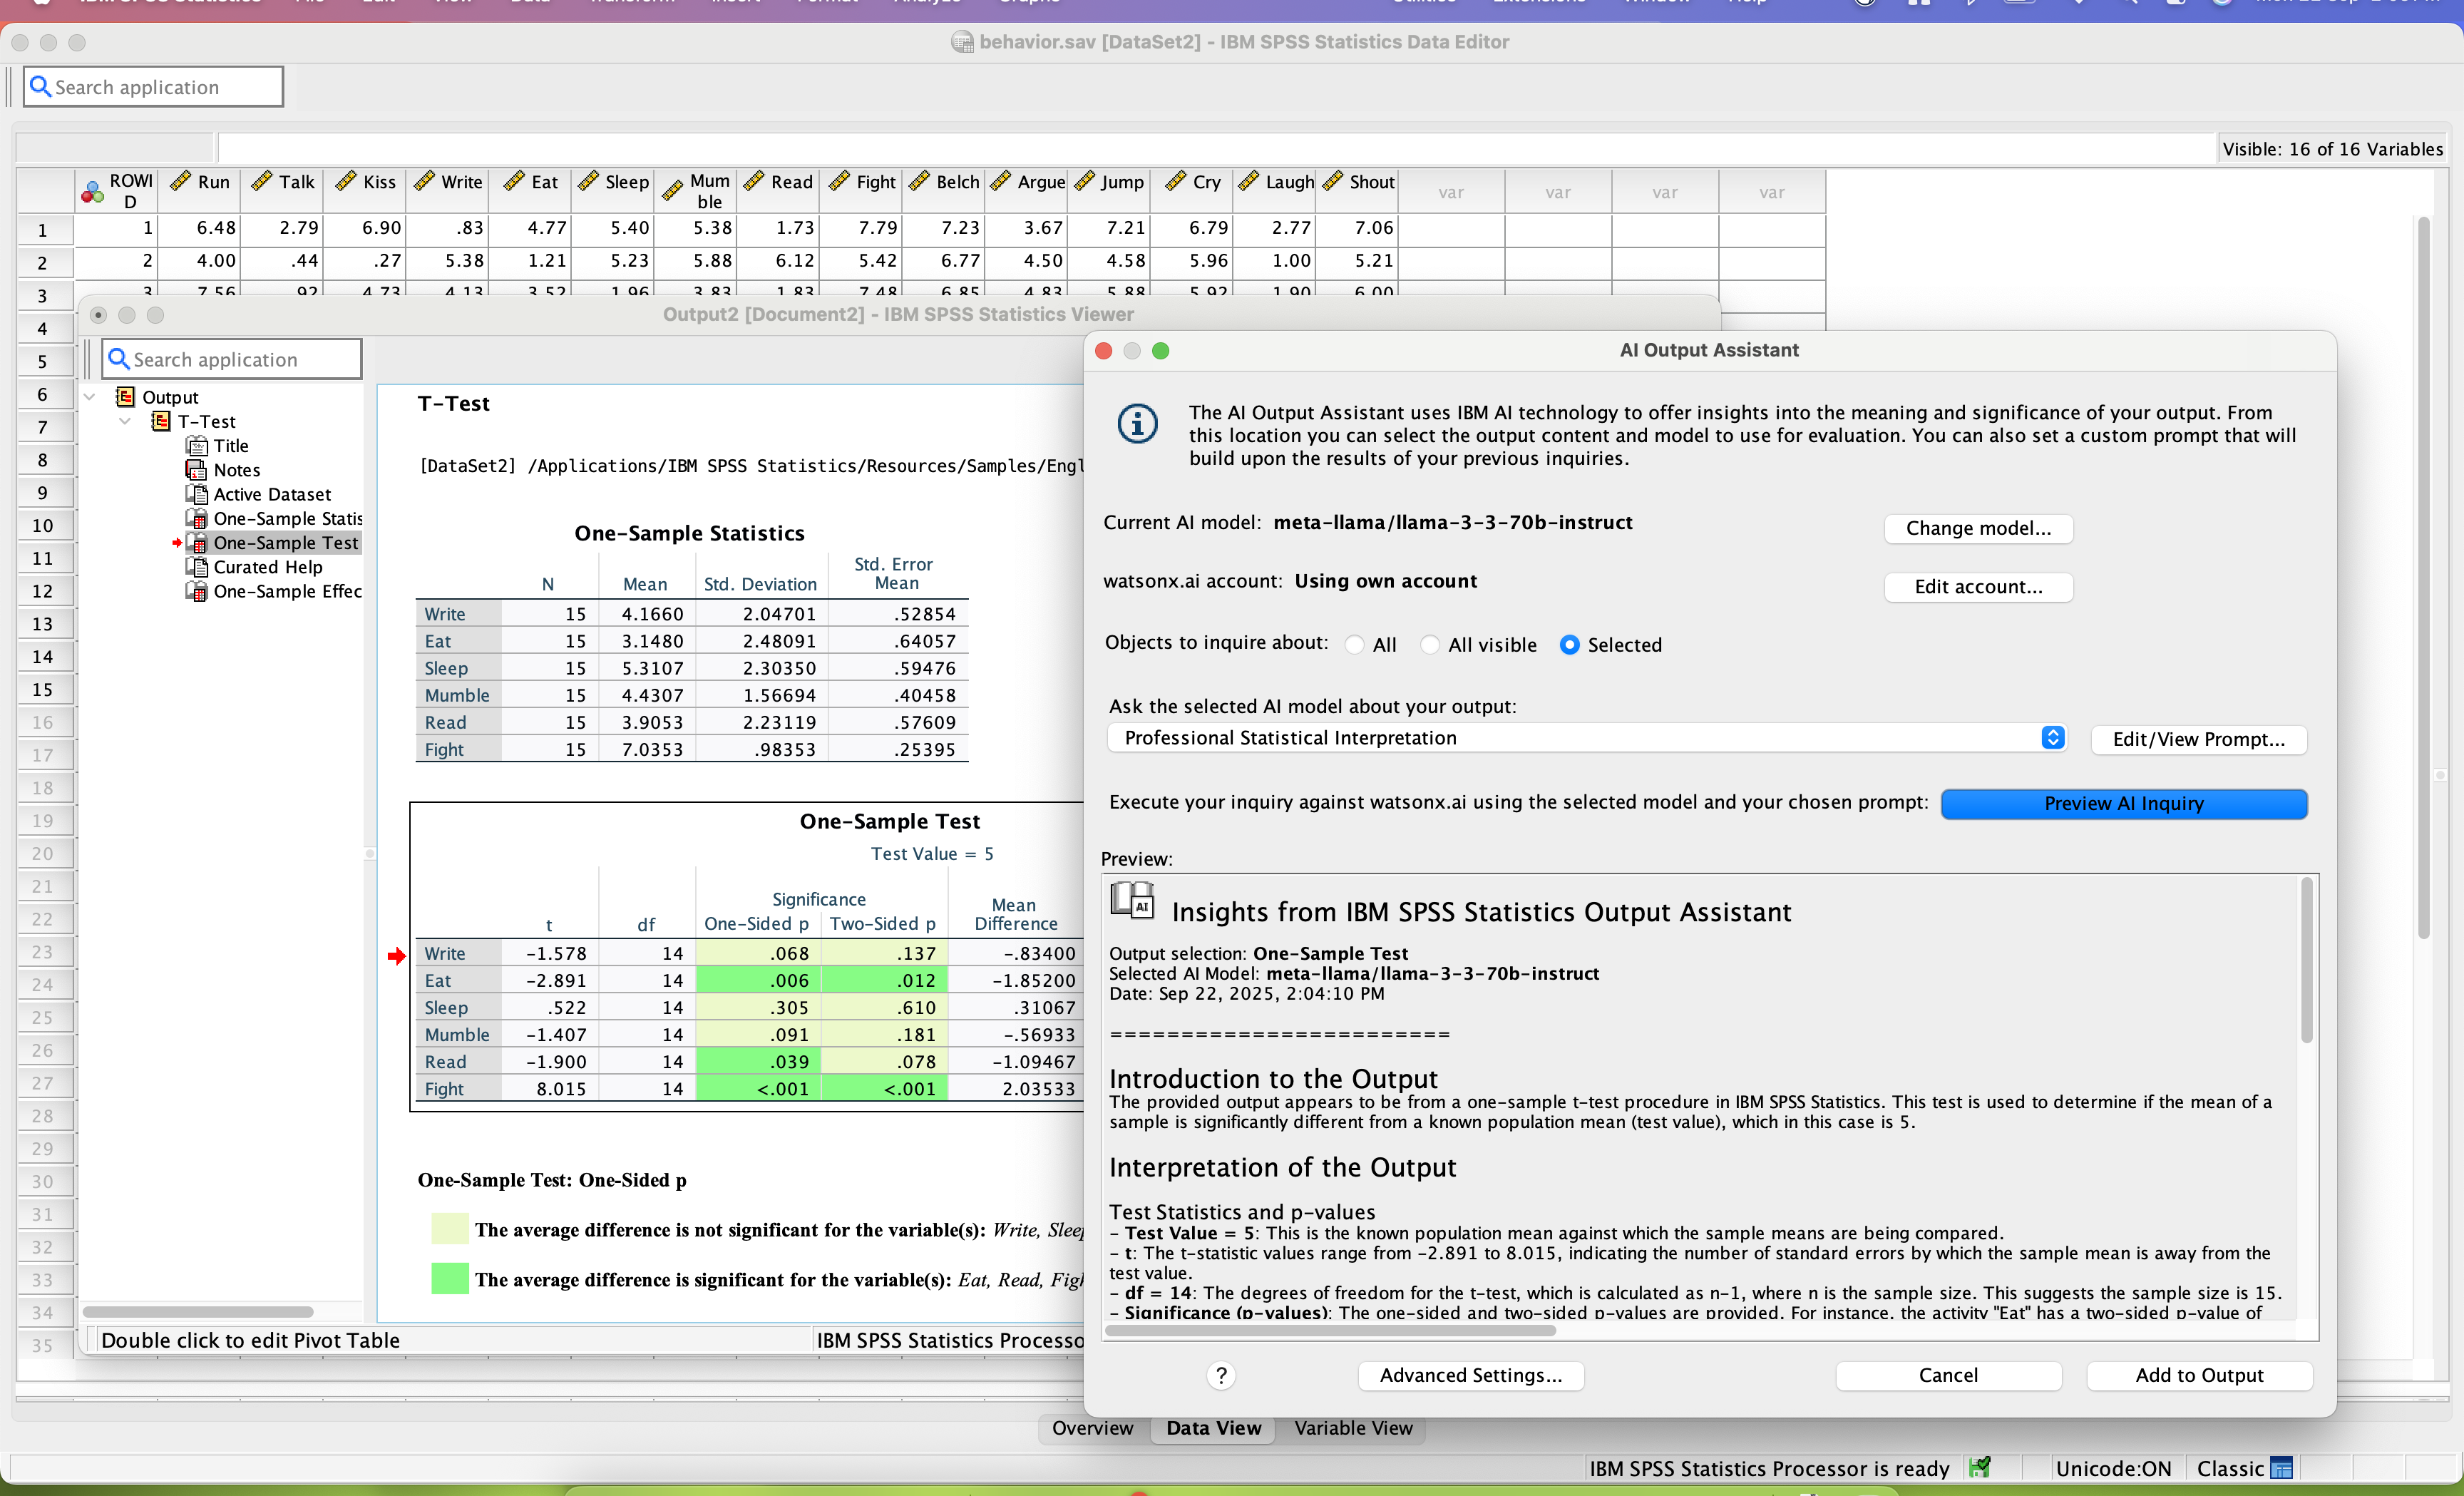
SPSS Statistics is a software package used for statistical analysis. It is now officially named "IBM SPSS Statistics". Companion products in the same family are used for survey authoring and deployment (IBM SPSS Data Collection), data mining (IBM SPSS Modeler), text analytics, and collaboration and deployment (batch and automated scoring services).
$99
per month per user
Spotfire
Score 8.1 out of 10
N/A
Spotfire, formerly known as TIBCO Spotfire, is a visual data science platform that combines visual analytics, data science, and data wrangling, so users can analyze data at-rest and at-scale to solve complex industry-specific problems.
N/A
Pricing
IBM SPSS Statistics
Spotfire
Editions & Modules
Base
USD 3,830
one-time fee per user
Standard
USD 8,440
one-time fee per user
Professional
USD 16,900
one-time fee per user
Premium
USD 25,200
one-time fee per user
Monthly subscription
USD 99
per month per user
Annual subscription
USD 1,188.00
per year per user
No answers on this topic
Offerings
Pricing Offerings
IBM SPSS Statistics
Spotfire
Free Trial
Yes
Yes
Free/Freemium Version
No
No
Premium Consulting/Integration Services
No
No
Entry-level Setup Fee
No setup fee
No setup fee
Additional Details
—
For Enterprise engagements, contact Spotfire directly for a custom price quote.
We evaluated on Mobility, Dashboarding, Web Based User Interface and Analytical capability. At the forefront was the user experience which accounted for just over half of our evaluation criteria. No platform was a 10/10 in all four categories - SAS Visual Analytics excelled in …
Product Manager - Mobile Computing Analytics Cloud Platform
Chose Spotfire
Our analysis suggested that Spotfire stacked up very well against all of the other vendors. When we looked at our evaluations, Spotfire did not win in any particular category. However, it did very well in all of the categories. Our evaluation also involved a pan-enterprise …
SPSS is well-suited for the following: 1) User Behavior Analysis: SPSS handles large datasets to analyze user behavior data. 2) Customer Satisfaction / Foundational Surveys: SPSS facilitates analysis of quant data from satisfaction surveys, keeping us informed about customer needs and preferences. 3) A/B test analysis: SPSS statistical tools for A/B test analysis, which helps optimize user experience of our products. Scenarios where SPSS are less appropriate: 1) Qualitative Data Analysis: I do not use SPSS for open-ended survey responses/qual data. 2) Live/in-vivo data analysis: SPSS is not ideal for real-time data processing. 3) Complex Data Integration: SPSS isn’t the best fit for complex data integration tasks
Spotfire was used to look at a large data set of an in process manufacturing step. The data visualization was set up to look at yield as a function of several inputs (chemical / equipment / operator). After only a short analysis it was immediately obvious that there was a 5% yield discrepancy based on the operator using the equipment. The operators were retrained and the yield gap was eliminated.
SPSS has been around for quite a while and has amassed a large suite of functionality. One of its longest-running features is the ability to automate SPSS via scripting, AKA "syntax." There is a very large community of practice on the internet who can help newbies to quickly scale up their automation abilities with SPSS. And SPSS allows users to save syntax scripting directly from GUI wizards and configuration windows, which can be a real life-saver if one is not an experienced coder.
Many statistics package users are doing scientific research with an eye to publish reproducible results. SPSS allows you to save datasets and syntax scripting in a common format, facilitating attempts by peer reviewers and other researchers to quickly and easily attempt to reproduce your results. It's very portable!
SPSS has both legacy and modern visualization suites baked into the base software, giving users an easily mountable learning curve when it comes to outputting charts and graphs. It's very easy to start with a canned look and feel of an exported chart, and then you can tweak a saved copy to change just about everything, from colors, legends, and axis scaling, to orientation, labels, and grid lines. And when you've got a chart or graph set up the way you like, you can export it as an image file, or create a template syntax to apply to new visualizations going forward.
SPSS makes it easy for even beginner-level users to create statistical coding fields to support multidimensional analysis, ensuring that you never need to destructively modify your dataset.
In closing, SPSS's long and successful tenure ensures that just about any question a new user may have about it can be answered with a modicum of Google-fu. There are even several fully-fledged tutorial websites out there for newbie perusal.
They should have a lower price point for users to access the analyst version who don't require advanced capabilities. For example, a lower price if users just need to do some basic slicing and dicing with their data and not have to the data science functionality (ie. K-means clustering, regression modeling, classification modeling, etc.).
Currently, you can't change the font type/color on the axis, which I'm sure will eventually be available in the future as they have a Spotfire Ideas portal that they're fairly responsive to and act on. I guess at the end of the day, it's about the data and what insights you get from it.
It's super easy to use for newbies and super powerful for power users! It does EVERYTHING you are usually asked to do analytically. Their Help Desk is PHENOMENAL. And I find the upgrade and renewal price to be a good deal.
It's a very powerful tool that allows for a myriad of customizations within the analysis files themselves, particularly with the custom expression functionality. There have been some great strides with the quality of the visualization options (which were not great to begin with) and I hope to see more improvements made as the product gets updated.
SPSS is beginner friendly and user-friendly for beginner analysts and simple statistical tests. It's "click and go" interface does take some learning, but overall this is much easier than other programs I have used and seen. Compared to SAS software, SPSS takes a great deal less familiarizing and it not a matter of learning a coding language like SAS and RStudio.
Basic tasks like generating meaningful information from large sets of raw data are very easy. The next step of linking to multiple live data sources and linking those tables and performing on the fly analysis of the imported data is understandably more difficult.
Even though, it's a rather stable and predictable tool that's also fast, it does have some bugs and inconsistencies that shut down the system. Depending on the details, it could happen as often as 2-3 times a week, especially during the development period.
Generally, the Spotfire client runs with very good performance. There are factors that could affect performance, but normally has to do with loading large analysis files from the library if the database is located some distance away and your global network is not optimal. Once you have your data table(s) loaded in the client application, usually the application is quite good performance-wise.
I have not contacted IBM SPSS for support myself. However, our IT staff has for trying to get SPSS Text Analytics Module to work. The issue was never resolved, but I'm not sure if it was on the IT's end or on SPSS's end
Support has been helpful with issues. Support seems to know their product and its capabilities. It would also seem that they have a good sense of the context of the problem; where we are going with this issue and what we want the end outcome to be.
The instructor was very in depth and provided relevant training to business users on how to create visualizations. They showed us how to alter settings and filter views, and provided resources for future questions. However, the instructor failed to cover data sources, connecting to data, etc. While it was helpful to see how users can use the data to create reports, they failed to properly instruct us on how to get the dataset in to begin with. We are still trying to figure out connections to certain databases (we have multiple different types).
The online training is good, provides a good base of knowledge. The video demonstrations were well-done and easy to follow along. Provided exercises are good as well, but I think there could be more challenging exercises. The training has also gone up in price significantly in the last 3 years (in USD, which hurts us even more in Canada), and I'm not sure it is worth the money it now costs (it is worth how much it cost 3 years ago, but not double that.)
Have a plan for managing the yearly upgrade cycle. Most users work in the desktop version, so there needs to be a mechanism for either pushing out new versions of the software or a key manager to deal with updated licensing keys. If you have a lot of users this needs to be planned for in advance.
The original architecture I created for our implementation had only a particular set of internal business units in mind. Over the years, Spotfire gained in popularity in our company and was being utilized across many more business units. Soon, its usage went beyond what the original architectural implementation could provide. We've since learned about how the product is used by the different teams and are currently in the middle of rolling out a new architecture. I suggest:
Have clearly defined service level agreements with all the teams that will use Spotfire. Your business intelligence group might only need availability during normal working hours, but your production support group might need 24/7 availability. If these groups share one Spotfire server, maintenance of that server might be a problem.
Know the different types of data you will be working with. One group might be working with "public" data while another group might work with sensitive data. Design your Library accordingly and with the proper permissions.
Know the roles of the users of Spotfire. Will there only be a small set of report writers or does everyone have write access to the Library?
ALWAYS add a timestamp prompt to your reports. You don't want multiple users opening a report that will try and pull down millions of rows of data to their local workstations. Another option, of course, is to just hard code a time range in the backing database view (i.e. where activity_date >= sysdate - 90, etc.), but I'd rather educate/train the user base if possible.
This probably goes without saying, but if possible, point to a separate reporting database or a logical standby database. You don't want the company pounding on your primaries and take down your order system.
If you have made it this far, you should have a very good idea of how SPSS stacks up the competition (data processing and analytics tools). Even the free ones, such as r Studio or Stata, are leaps and bounds ahead of SPSS. IBM is resting on a reputation developed nearly 30 years ago and has shown no desire to improve.
Spotfire is appropriate for every organization of any size because it can be a recipient of data for better decision-making. Being a robust development platform for creating reports and dashboards, creating a new Spotfire dashboard is relatively simple. Developers can create highly customized dashboards using the tools it provides. I will recommend this software to others
In an enterprise architecture, if Spotfire Advanced Data services(Composite Studio),data marts can be managed optimally and scalability in a data perspective is great. As the web player/consumer is directly proportional to RAM, if the enterprise can handle RAM requirement accomodating fail over mechanisms appropraitely, it is definitely scalable,
I found SPSS easier to use than SAS as it's more intuitive to me.
The learning curve to use SPSS is less compared to SAS.
I used SAS, to a much lesser extent than SPSS. However, it seems that SAS may be more suitable for users who understand programming. With SPSS, users can perform many statistical tests without the need to know programming.
Spotfire really helped a lot of people in terms of analysis. It eliminates data analysis in excel. Because even underlying data you can explore it in Spotfire.
Spotfire helps data analysts to investigate data and also help analysts solve inconsistency of data.
Spotfire helps data analysts in building great dashboard that provide insights to users to make decisions to drive revenue and manage the churn.