iCharts vs. Yseop

Overview
ProductRatingMost Used ByProduct SummaryStarting Price
iCharts
Score 8.0 out of 10
Mid-Size Companies (51-1,000 employees)
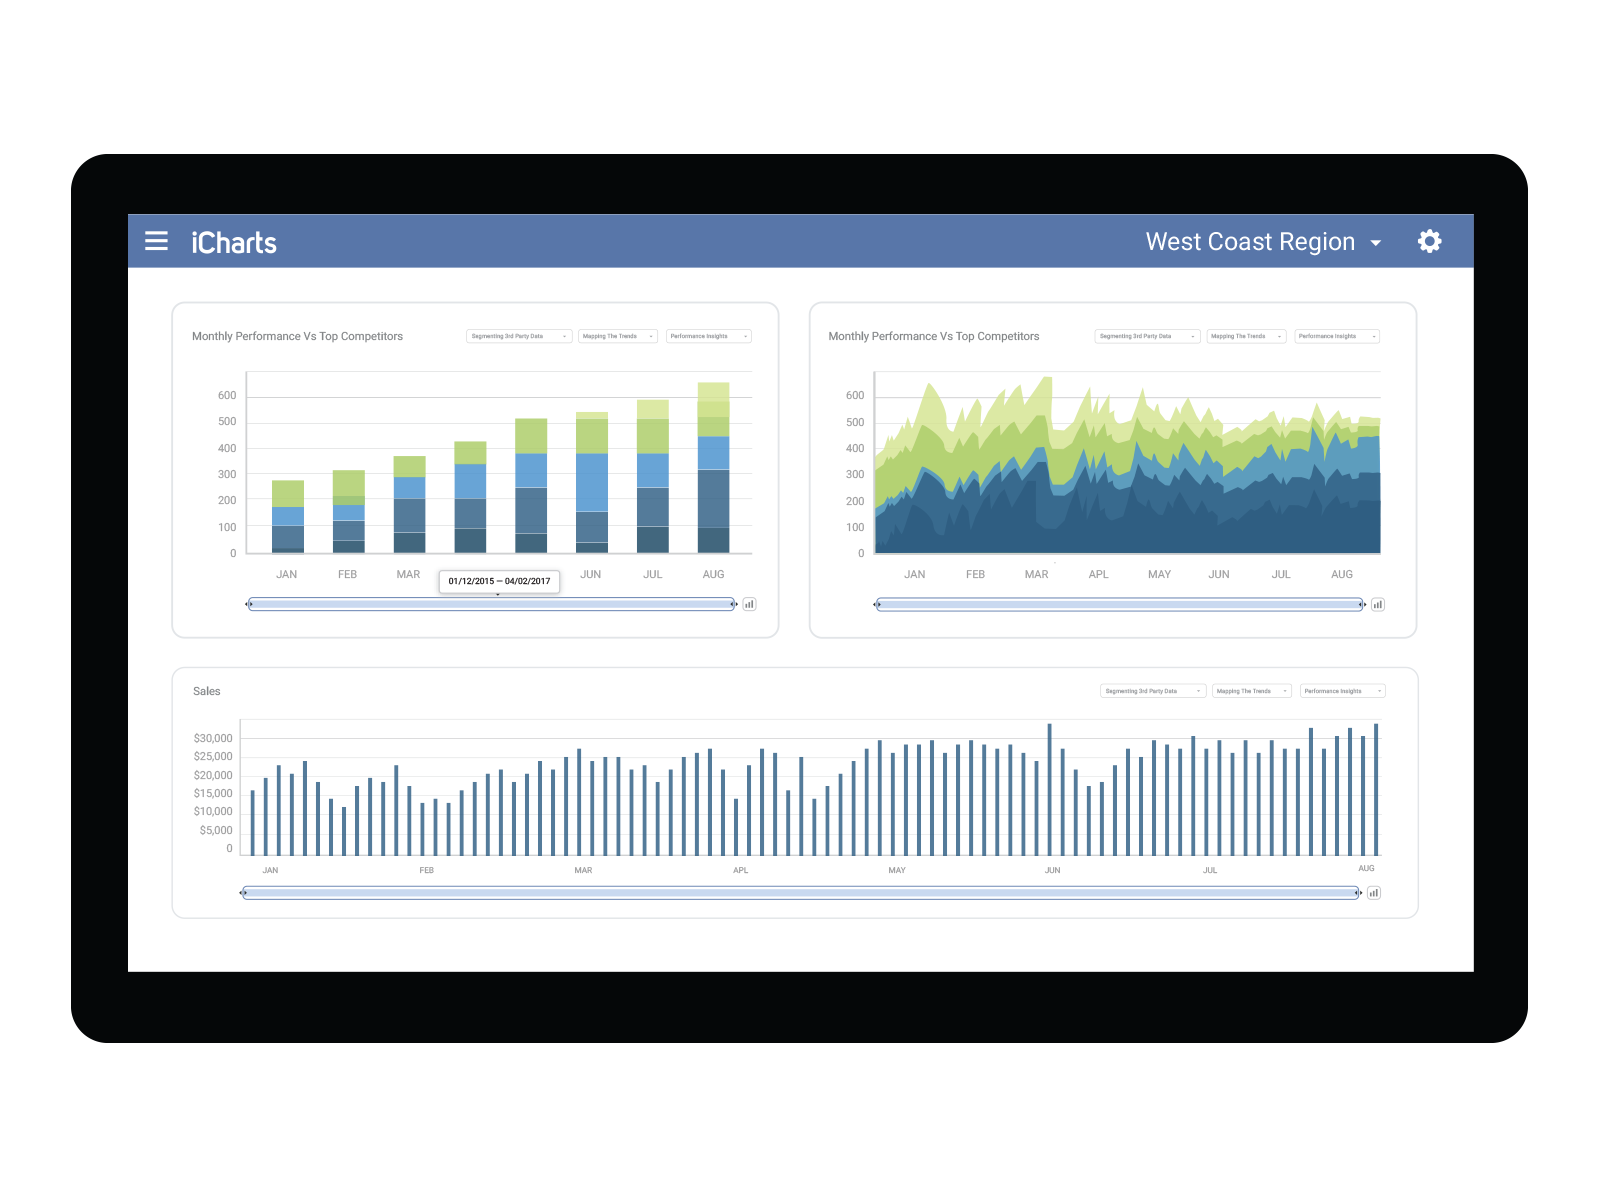
iCharts is a Business Intelligence and Analytics solution for NetSuite. With this solution, users can transform their NetSuite data into interactive, real-time analytics without leaving their NetSuite dashboard. iCharts includes drag-and-drop chart creation and best-practice templates. The vendor’s value proposition is that iCharts accelerates an organization’s analytics strategy by empowering their team with the critical data-driven tools they need.
$10,000
per installation
Yseop
Score 8.0 out of 10
N/A
Yseop is a Natural Language Generation (NLG) software targeted at Enterprises. Yseop is based on Artificial Intelligence that reasons on data and writes intelligent content in clear natural language at the speed of thousands of pages per second and in multiple languages (English, Spanish, French, German, Portuguese, etc.). Yseop helps make sense of Big Data to draw actionable insights.N/A
Pricing
iChartsYseop
Editions & Modules
Professional
$10,000
per installation
Business
15,000
per installation
Elite
$25,000
per installation
No answers on this topic
Offerings
Pricing Offerings
iChartsYseop
Free Trial
YesNo
Free/Freemium Version
NoNo
Premium Consulting/Integration Services
NoNo
Entry-level Setup Fee$3,000 per installationNo setup fee
Additional DetailsBased on number of NetSuite licenses
More Pricing Information
Community Pulse
iChartsYseop
Considered Both Products
iCharts
Chose iCharts
We have only just started looking at other options, NetSuite is the one who recommended ICharts and for what they were offering we felt they would be a good fit for us.
Yseop

No answer on this topic

Features
iChartsYseop
BI Standard Reporting
Comparison of BI Standard Reporting features of Product A and Product B
iCharts
9.0
Ratings
10% above category average
Yseop
-
Ratings
Customizable dashboards10.00 Ratings00 Ratings
Report Formatting Templates8.00 Ratings00 Ratings
Ad-hoc Reporting
Comparison of Ad-hoc Reporting features of Product A and Product B
iCharts
9.0
Ratings
11% above category average
Yseop
-
Ratings
Drill-down analysis9.00 Ratings00 Ratings
Report sharing and collaboration9.00 Ratings00 Ratings
Report Output and Scheduling
Comparison of Report Output and Scheduling features of Product A and Product B
iCharts
10.0
Ratings
18% above category average
Yseop
-
Ratings
Publish to Web10.00 Ratings00 Ratings
Data Discovery and Visualization
Comparison of Data Discovery and Visualization features of Product A and Product B
iCharts
8.0
Ratings
0% above category average
Yseop
-
Ratings
Pre-built visualization formats (heatmaps, scatter plots etc.)8.00 Ratings00 Ratings
Access Control and Security
Comparison of Access Control and Security features of Product A and Product B
iCharts
8.7
Ratings
3% above category average
Yseop
-
Ratings
Multi-User Support (named login)9.00 Ratings00 Ratings
Role-Based Security Model8.00 Ratings00 Ratings
Multiple Access Permission Levels (Create, Read, Delete)9.00 Ratings00 Ratings
Mobile Capabilities
Comparison of Mobile Capabilities features of Product A and Product B
iCharts
10.0
Ratings
24% above category average
Yseop
-
Ratings
Responsive Design for Web Access10.00 Ratings00 Ratings
Dashboard / Report / Visualization Interactivity on Mobile10.00 Ratings00 Ratings
Best Alternatives
iChartsYseop
Small Businesses
BrightGauge
BrightGauge
Score 9.1 out of 10
Clari Copilot
Clari Copilot
Score 8.7 out of 10
Medium-sized Companies
Reveal
Reveal
Score 10.0 out of 10
Clari
Clari
Score 9.8 out of 10
Enterprises
Kyvos Semantic Intelligence Layer
Score 9.9 out of 10
Clari
Clari
Score 9.8 out of 10
All AlternativesView all alternativesView all alternatives
User Ratings
iChartsYseop
Likelihood to Recommend
8.0
(0 ratings)
8.0
(0 ratings)
User Testimonials
iChartsYseop
Likelihood to Recommend
At this time, iCharts is not well suited for anything as they seem to be closed. I am not sure if this is permanent as there is no one to ask. If they were to re-open I would be hesitant as they had no trouble closing without notifying customers.
Read full review
Yseop is an excellent option if you are looking to analyze your data in a way that's easy to understand and interpret. There will be no more hours upon hours spent on interpreting confusing data. Instead, Yseop translates this data for your teams so they can focus on other higher priority tasks and less time trying to analyze data that just doesn't make sense.
Read full review
Pros
  • Their new platform is easy to navigate
  • We had a dedicated support person to help set up searches and train in the use of iCharts
  • Separate Dashboards for each group
Read full review
  • Transforming and analyzing data, so we can understand it.
  • Automating repetitive, mundane, and data-driven tasks.
  • Creating complex workflows.
Read full review
Cons
  • The new platform has limitations on colors and sizing
  • iCharts seem to have closed its doors without notification and now we have a product with no support
Read full review
  • I think the software is mid-range level usability. For someone who's worked with this kind of software before, it's easy, but if someone is new to it, it could cause challenges.
  • Could improve on constant advancement, especially in a world of changing technologies.
  • Overall, the features are exactly what we need. More advanced features would be a plus.
Read full review
Alternatives Considered
I haven't experience any other alternative product of this.

Read full review
No answers on this topic
Return on Investment
No answers on this topic
  • Competitive intelligence.
  • Increased revenue.
  • Improved internal and external relationships.
Read full review
ScreenShots

iCharts Screenshots

Screenshot of Screenshot of