Icinga is an open source network monitoring platform. It includes automation, modularized integration packages, and prebuilt alerts and reporting capabilities.
N/A
NetApp Cloud Insights
Score 9.2 out of 10
N/A
NetApp Cloud Insights is an infrastructure monitoring tool that gives
users visibility into their complete infrastructure. With Cloud Insights, users can monitor, troubleshoot and optimize all resources including
public clouds and private data centers.
PRTG was the solution that was implemented before. As Icinga is Open Source we saved the licensing fee, as we ran out of free checks. I also had knowledge in Icinga so we switched over.
Nagios is inferior to Icinga in my opinion, as Icinga has the better Web UI, which I use the …
Icinga was initially a fork of Nagios. Over time, the configuration language was replaced with something more programmatic. This configuration language is one of the big sellers of this product. It allows flexible, quick configuration of large sets of hosts and services with …
While Icinga holds its own against old stalwarts like Nagios and Zabbix, it simply can't compete with the new generation of SaaS service/server monitoring software in terms of ease of use, feature-completeness, integration with things like Cloudwatch, CloudHealth, New Relic, …
There are two main competitors of Icinga in my opinion, Nagios, and NetFlow based monitoring solutions. Both are good, Icinga, is a more refined version of Nagios with a much better API and backwards compatibility to the platform. If you are running Nagios, you can transfer …
Icinga is better than Nagios because of its nicer user interface. New Relic can monitor CPU/memory and disk usage, but it's more of a performance and application troubleshooting tool rather than monitoring.
For a while, we were using Zabbix to monitor our Kubernetes applications and microservices on our infrastructure in more than one public cloud platform. Cloud Insights has much better visualized dashboards. In addition, despite such a large number of quality features, it's …
Cloud Insights is a very compact service compared to others. This is very compatible with the service selection policy suitable for the purpose. So you really pay for the part of the product you need, which increases your financial efficiency and lowers start-up costs (time to …
I assumed that this was a new product on the market and gave it a try since it had good customer feedback. So far it has done the job and provides some really good features.
Easy to install data collectors; the main focus of the product is multi-vendor cloud technology systems. Easy-to-use dashboards with widely supported features, which can be easily used in a WYSIWYG-manner. The NetApp data collector uses Telegraf as a way to integrate data from …
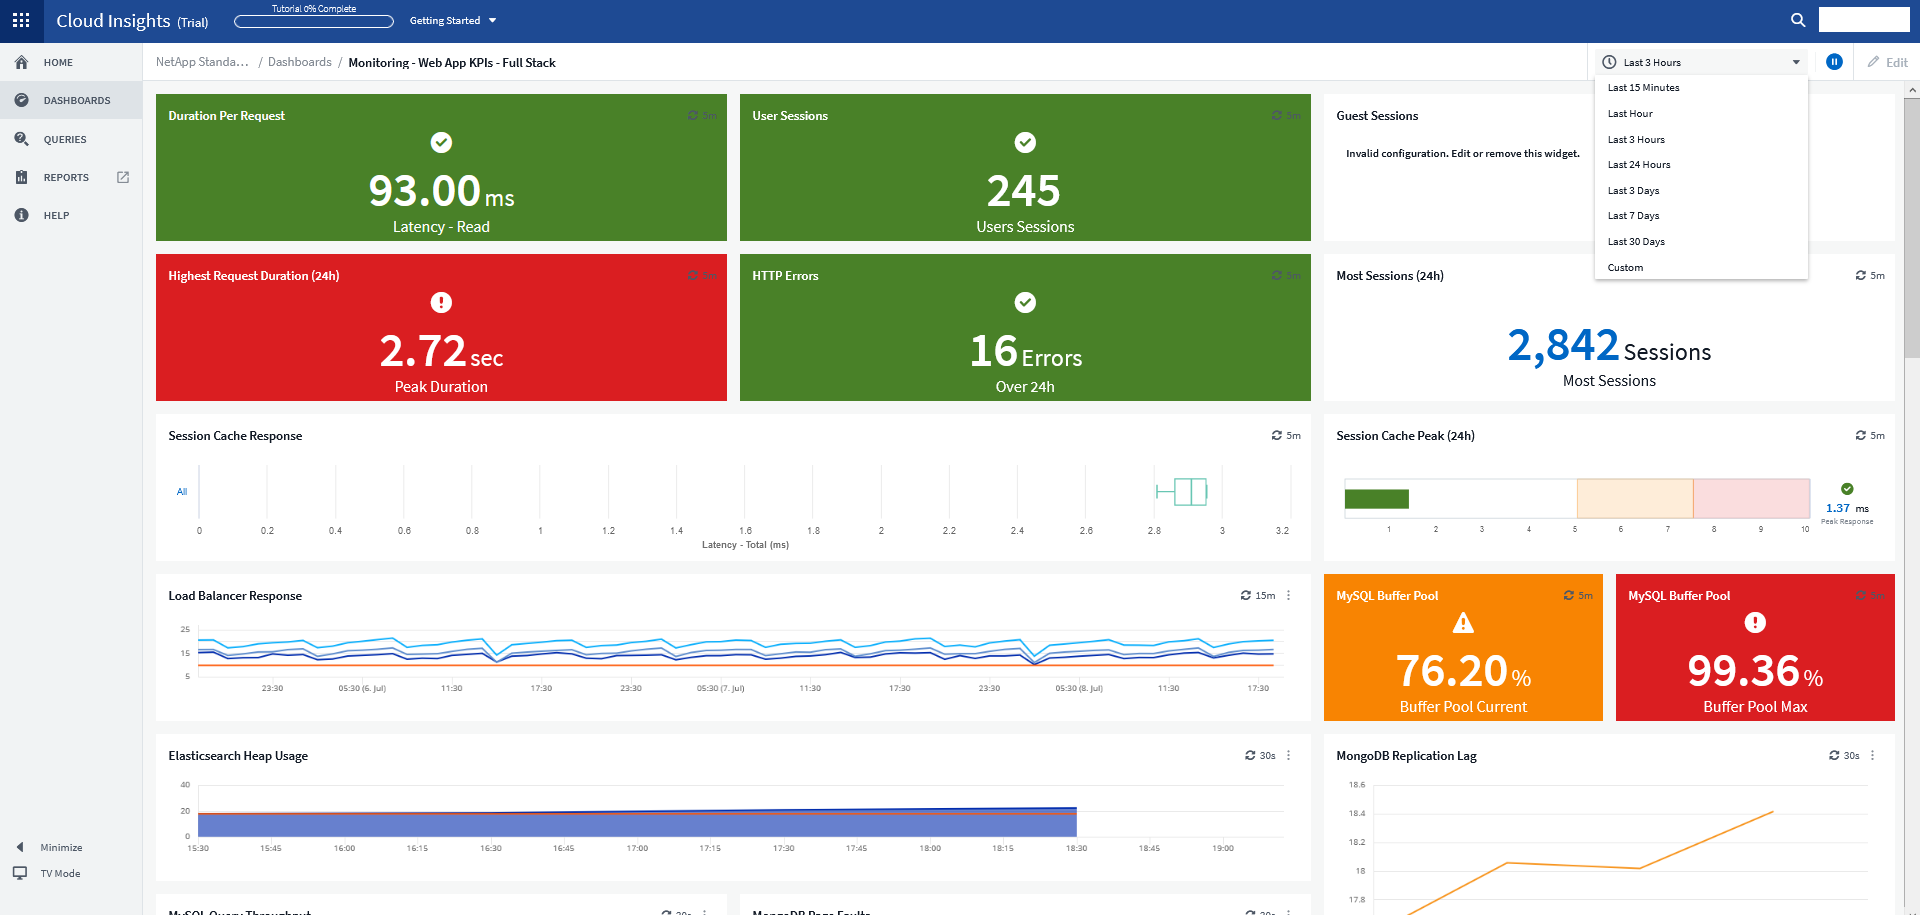
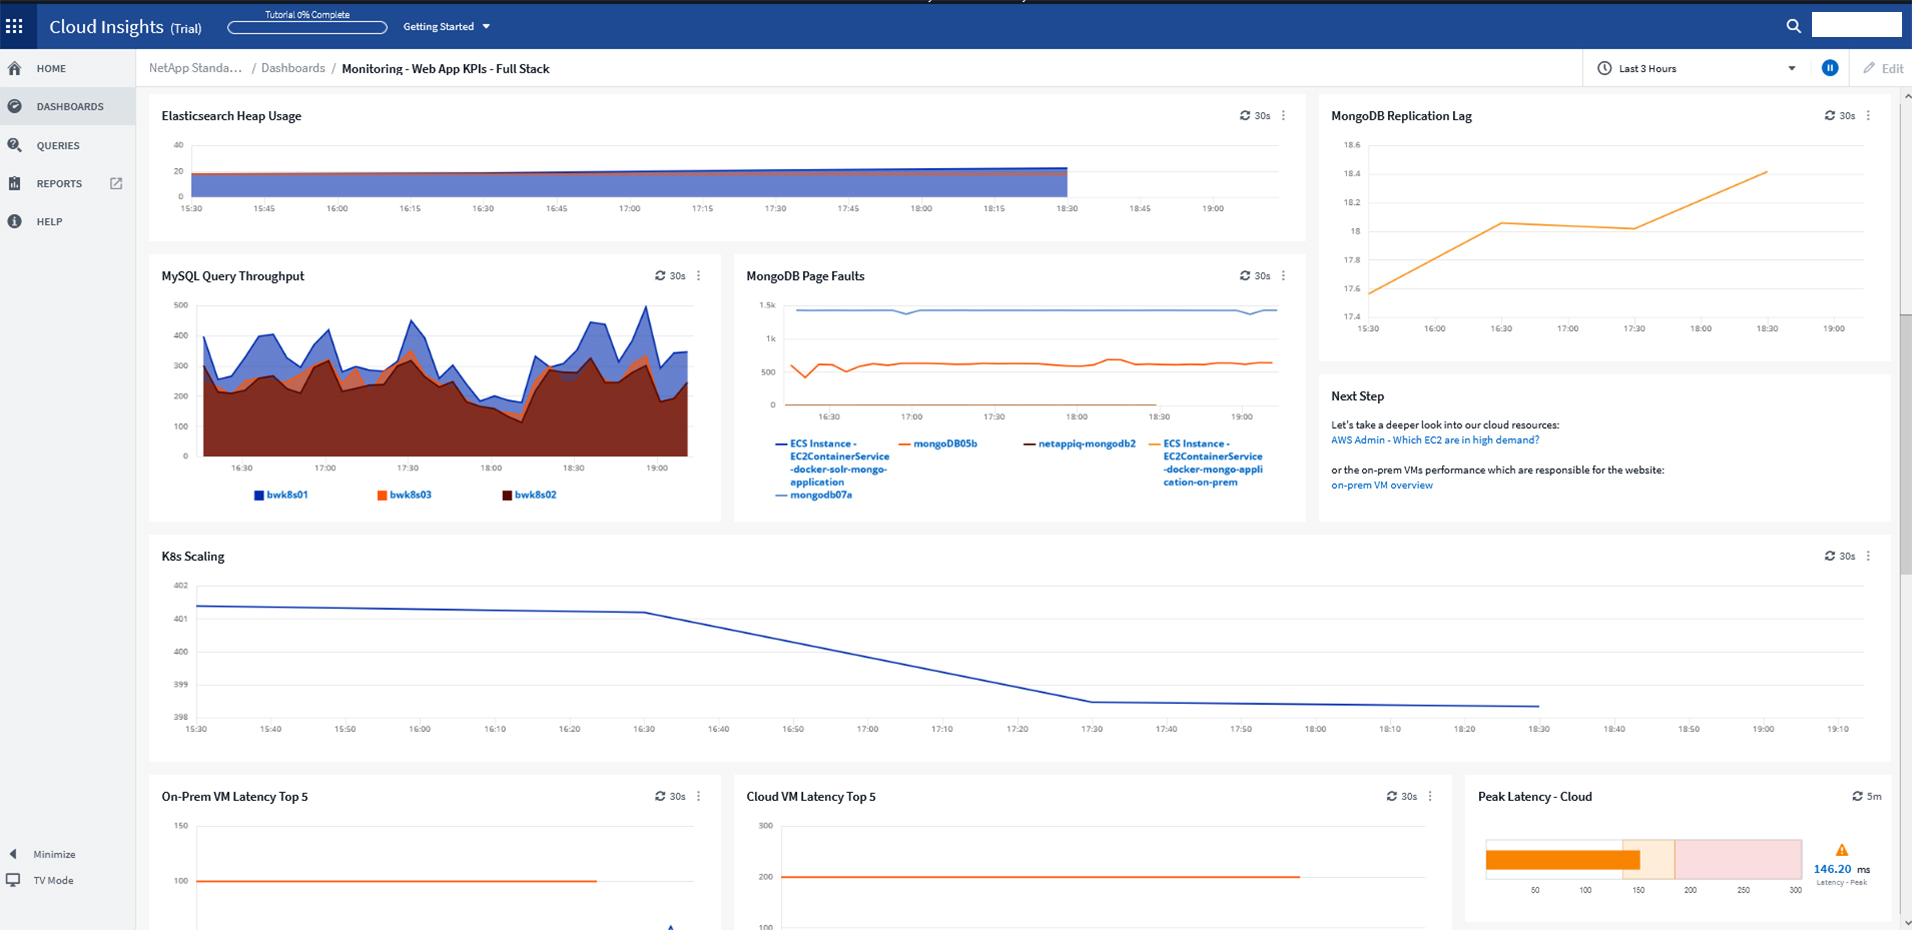
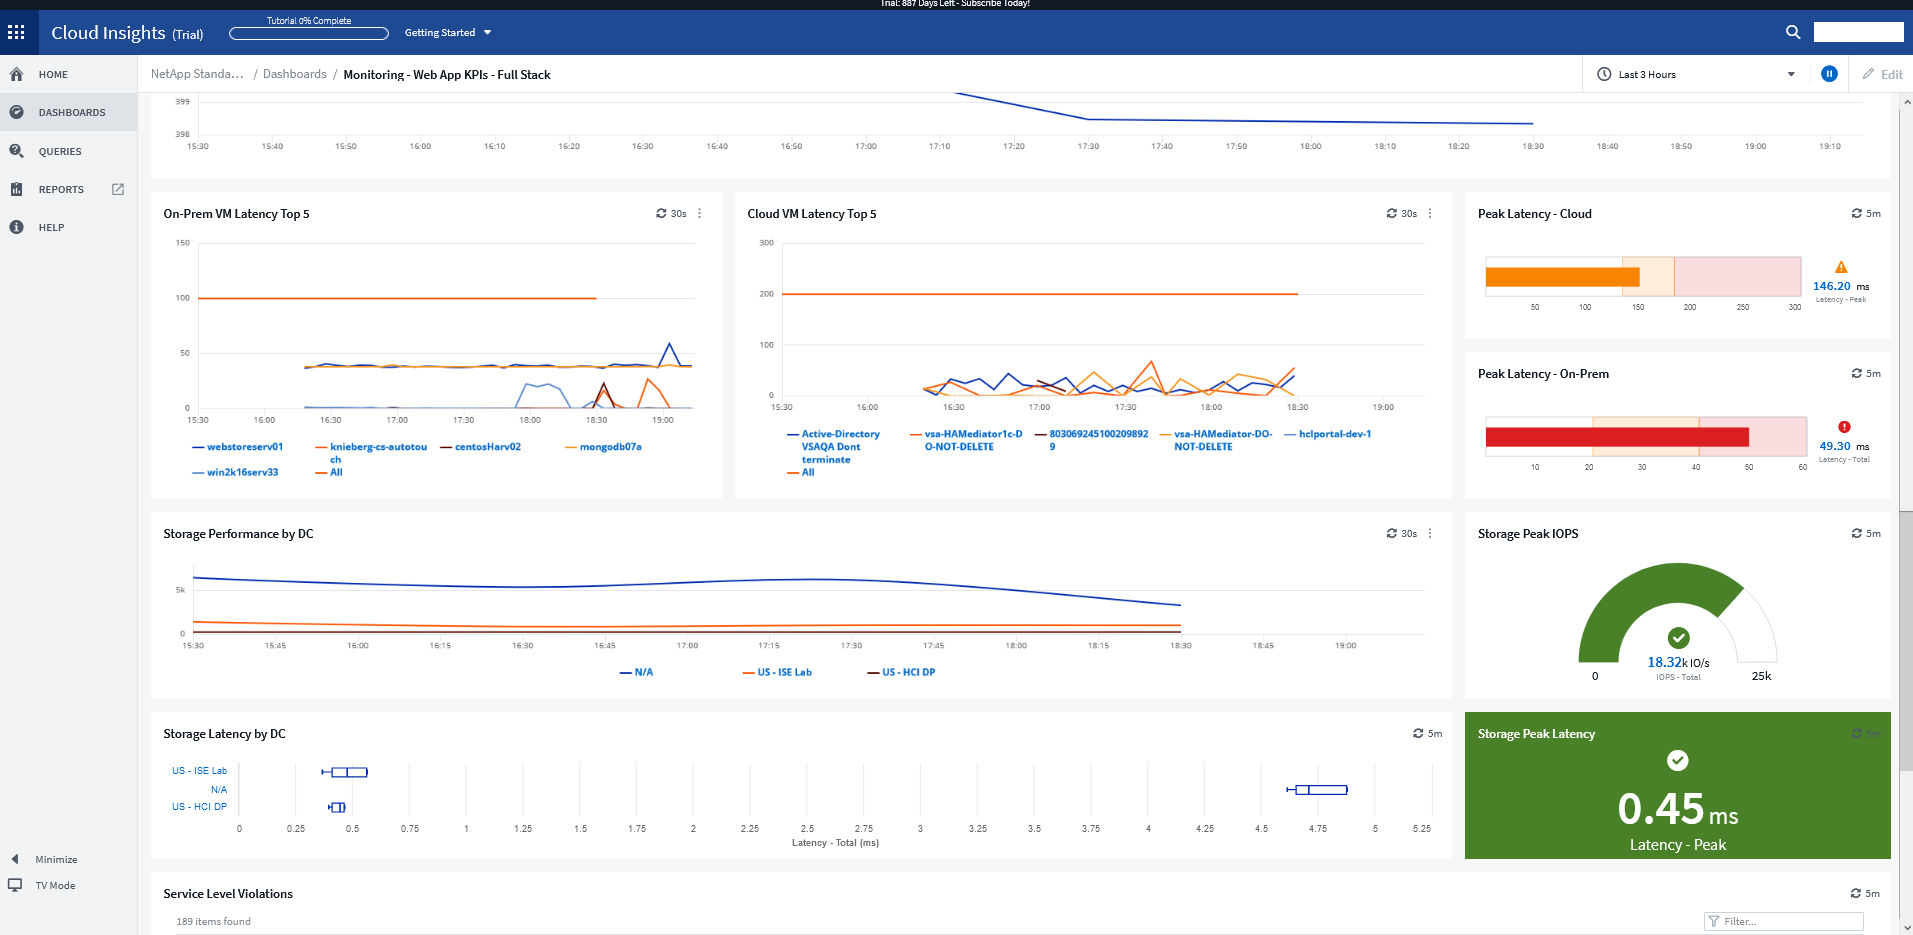
Cloud Insights allows us to create custom dashboards to monitor and trend any aspect of their infrastructure including CPU, memory, storage network utilization, IOPS, capacity utilization and more. Cloud Insights also provides visibility into the inter-connectivity of the …
Azure Bot Service isn't as responsive as Cloud Insights. Neither tool will pinpoint the problem exactly for you. If one did, that would be the clear choice. Work is still necessary to actually solve the problem, and Cloud Insights is more responsive to give the team more time …
If you're running bare-metal in a datacenter and your hosts are fairly static, it's probably okay to use something like Icinga to monitor your systems. In general, I would not recommend using any monitoring software based on Nagios (Icinga is a fork of Nagios) due to the outdated concepts inherent in those systems. There are a number of good SaaS monitoring solutions which are superior and several open source projects which implement an automation-centric approach to monitoring
For example, we had an application slowdown. It looked like the slowdown was storage. However, it was a malformed SQL query that no one realized was pulling data from the storage location that also housed the application. Cloud Insights saved us hours of downtime and frustration. Cloud Insights pinpointed which system was hogging resources. What makes Cloud Insights special is the way it looks at the data collected from the data sources. The insights it provides into the flow of data; sheds new light on how things work in your environment.
I think Icinga has a great search feature. I can always search for the hosts, host groups, or check names. When using just regular Nagios, I don't recall being able to do this search.
The fact that I can use Active Directory or LDAP for logins is a great feature.
If you are familiar with Nagios, it's very simple to combine the two products to get a polished finished product.
Icinga is a solid solution which does everything it promises. It is backwards compatible with most Nagios instances, making the transition very easy. Once you get the hang of installing new plugins and editing configuration files expanding its monitoring capabilities are easy.
I have been extremely happy with its usability. You can take thins as they are out of the box and it is useful. You can carry it as far as you want to go and every step you take improves your ROI.
Before using Cloud Insights, we quickly resolved all the issues we had by talking with the support team. The support team is eager to assist and technically well equipped. They quickly understood what we needed and helped us during the setup and the first use period so that we could adapt easily.
Icinga was initially a fork of Nagios. Over time, the configuration language was replaced with something more programmatic. This configuration language is one of the big sellers of this product. It allows flexible, quick configuration of large sets of hosts and services with minimal input. Comparing it to other products like WhatsUp Gold, Zenoss, Zabbix, etc., it stands out as incredibly flexible. Adding additional features to Icinga can be as simple as searching for them online. And if they don't yet exist, there is a full API available for custom extensions.
Cloud Insights allows us to create custom dashboards to monitor and trend any aspect of their infrastructure including CPU, memory, storage network utilization, IOPS, capacity utilization and more. Cloud Insights also provides visibility into the inter-connectivity of the components in our infrastructure by providing topology views of any component.