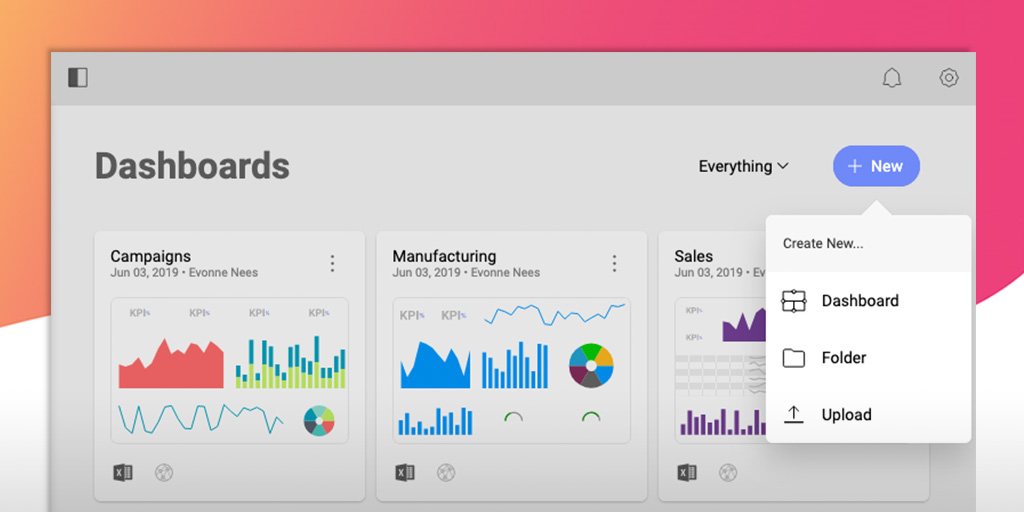
Reveal embedded analytics enables teams and customers to drive data insights with embedded intelligence, transforming the user experience of apps.
Built with embed in mind first, on modern architecture, Reveal’s API aims to remove the complexity of embedding analytics into applications. Reveal’s native SDKs can be integrated into applications on any
platform and tech stack including: .NET Core, Java, NodeJS (coming soon), and
front-end technologies such as React, Angular, WebComponent,…
$0
QlikView
Score 7.2 out of 10
N/A
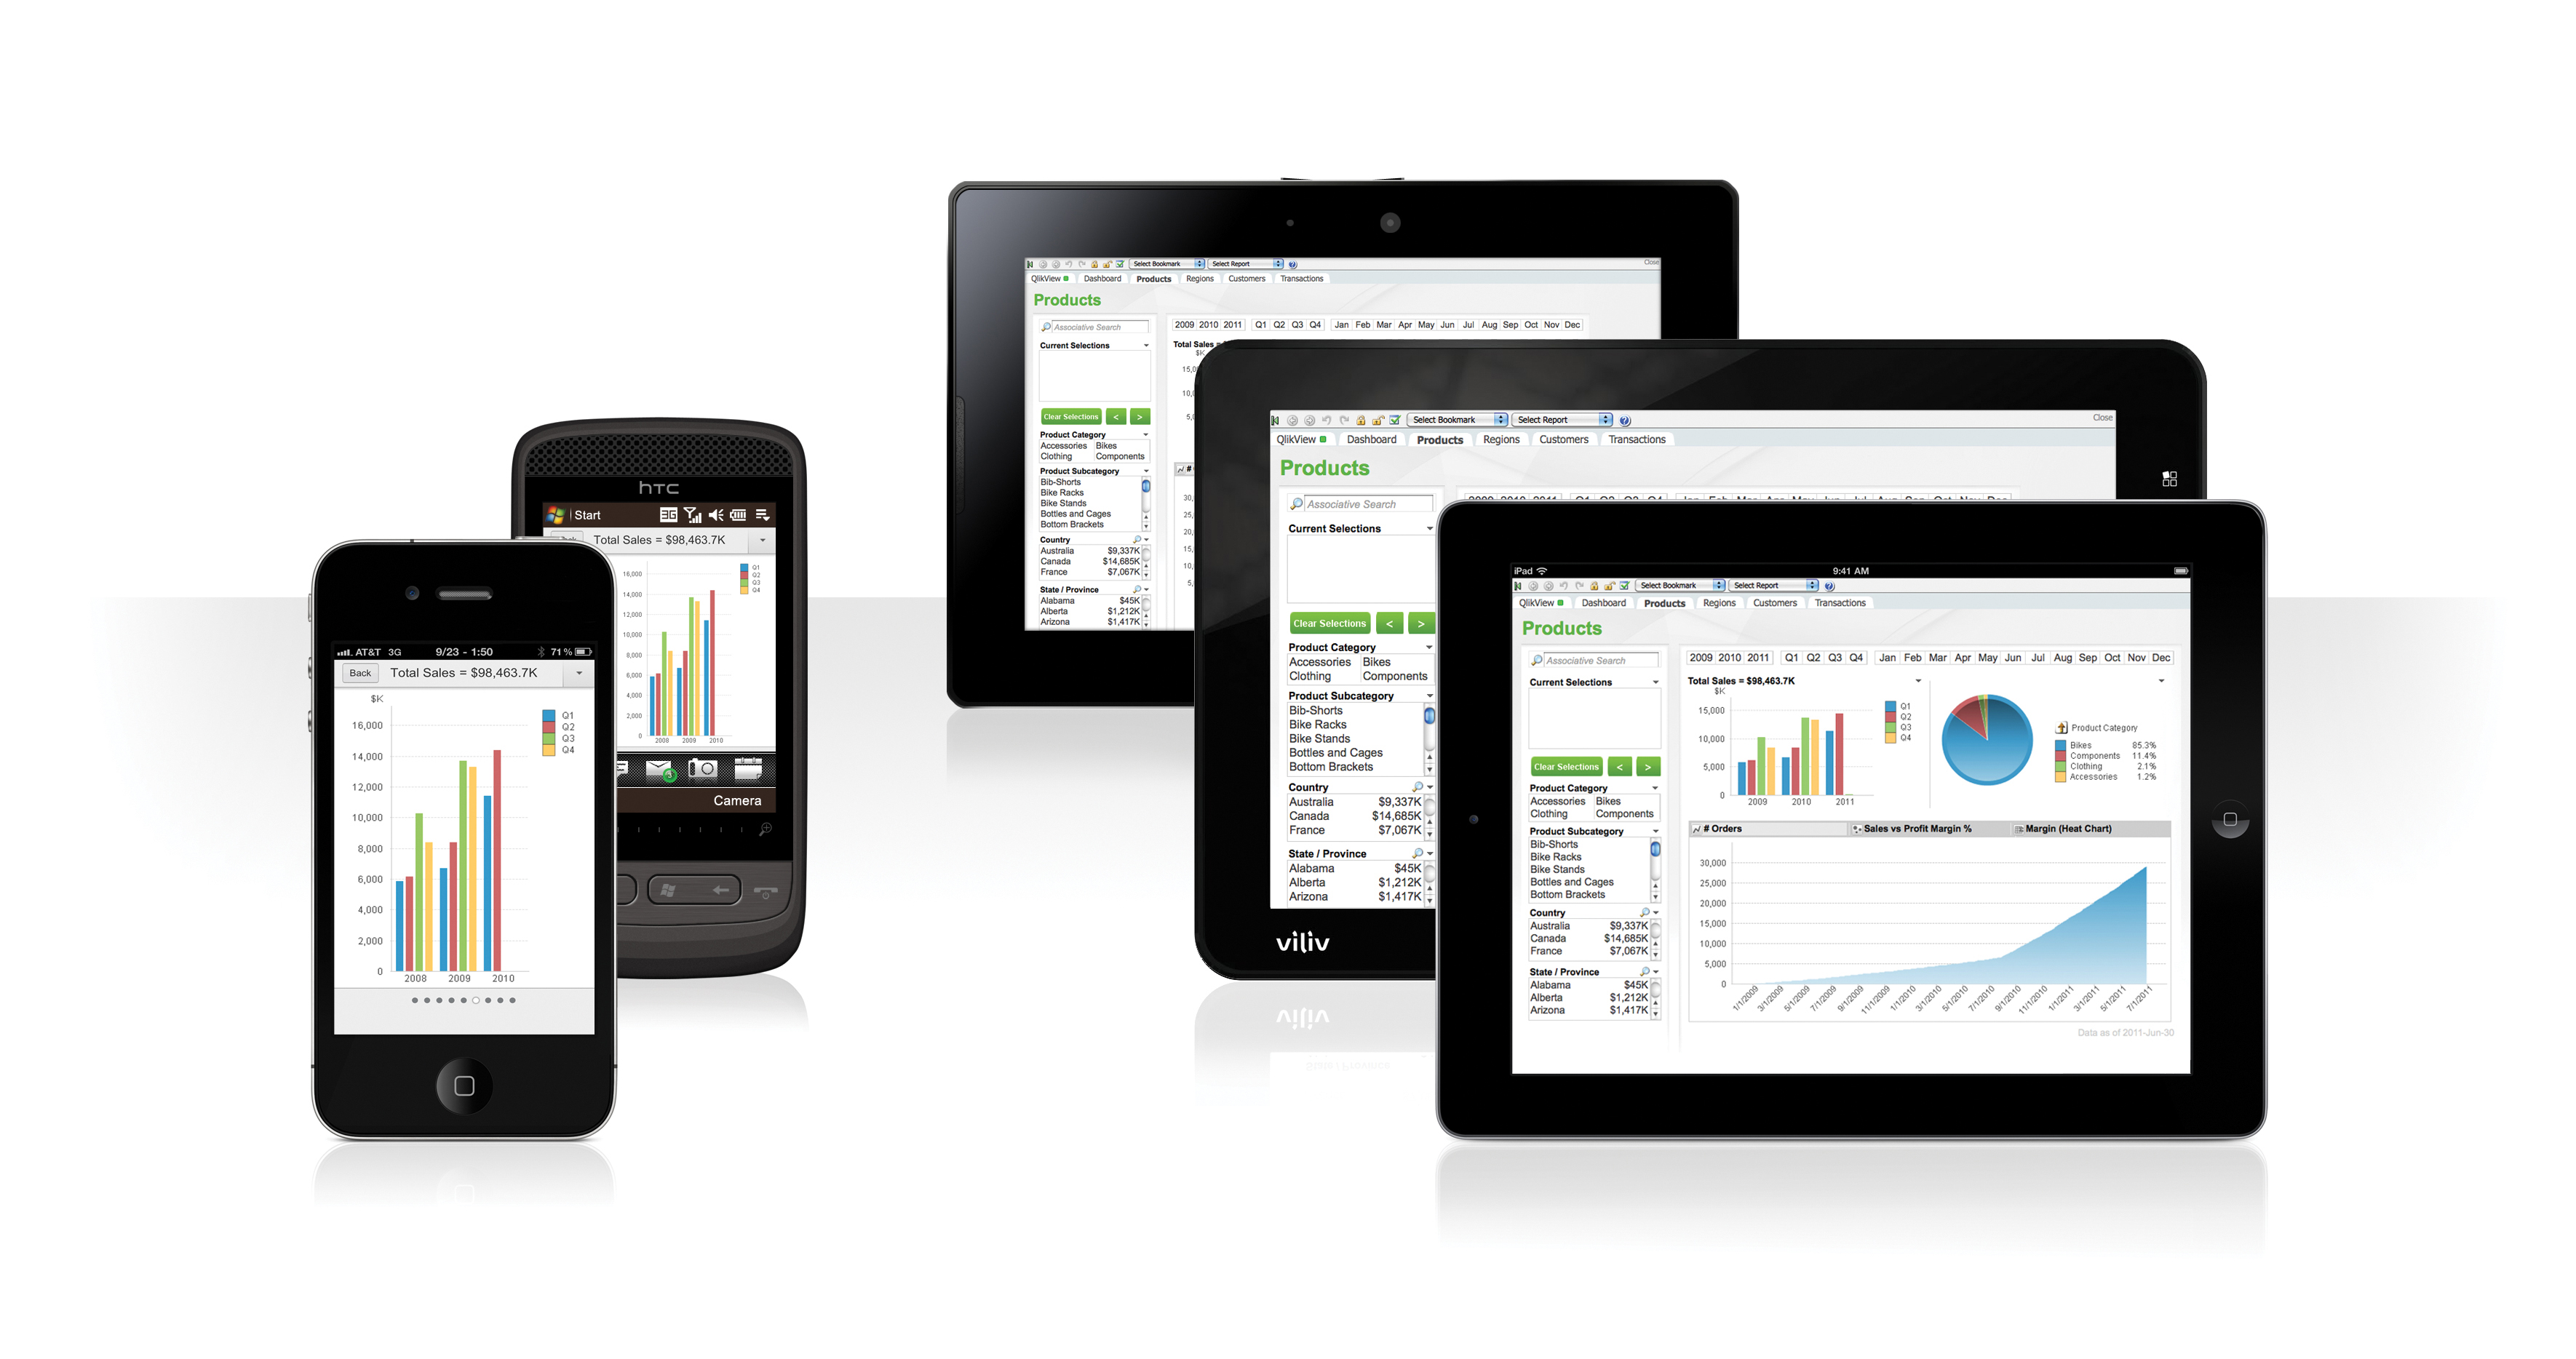
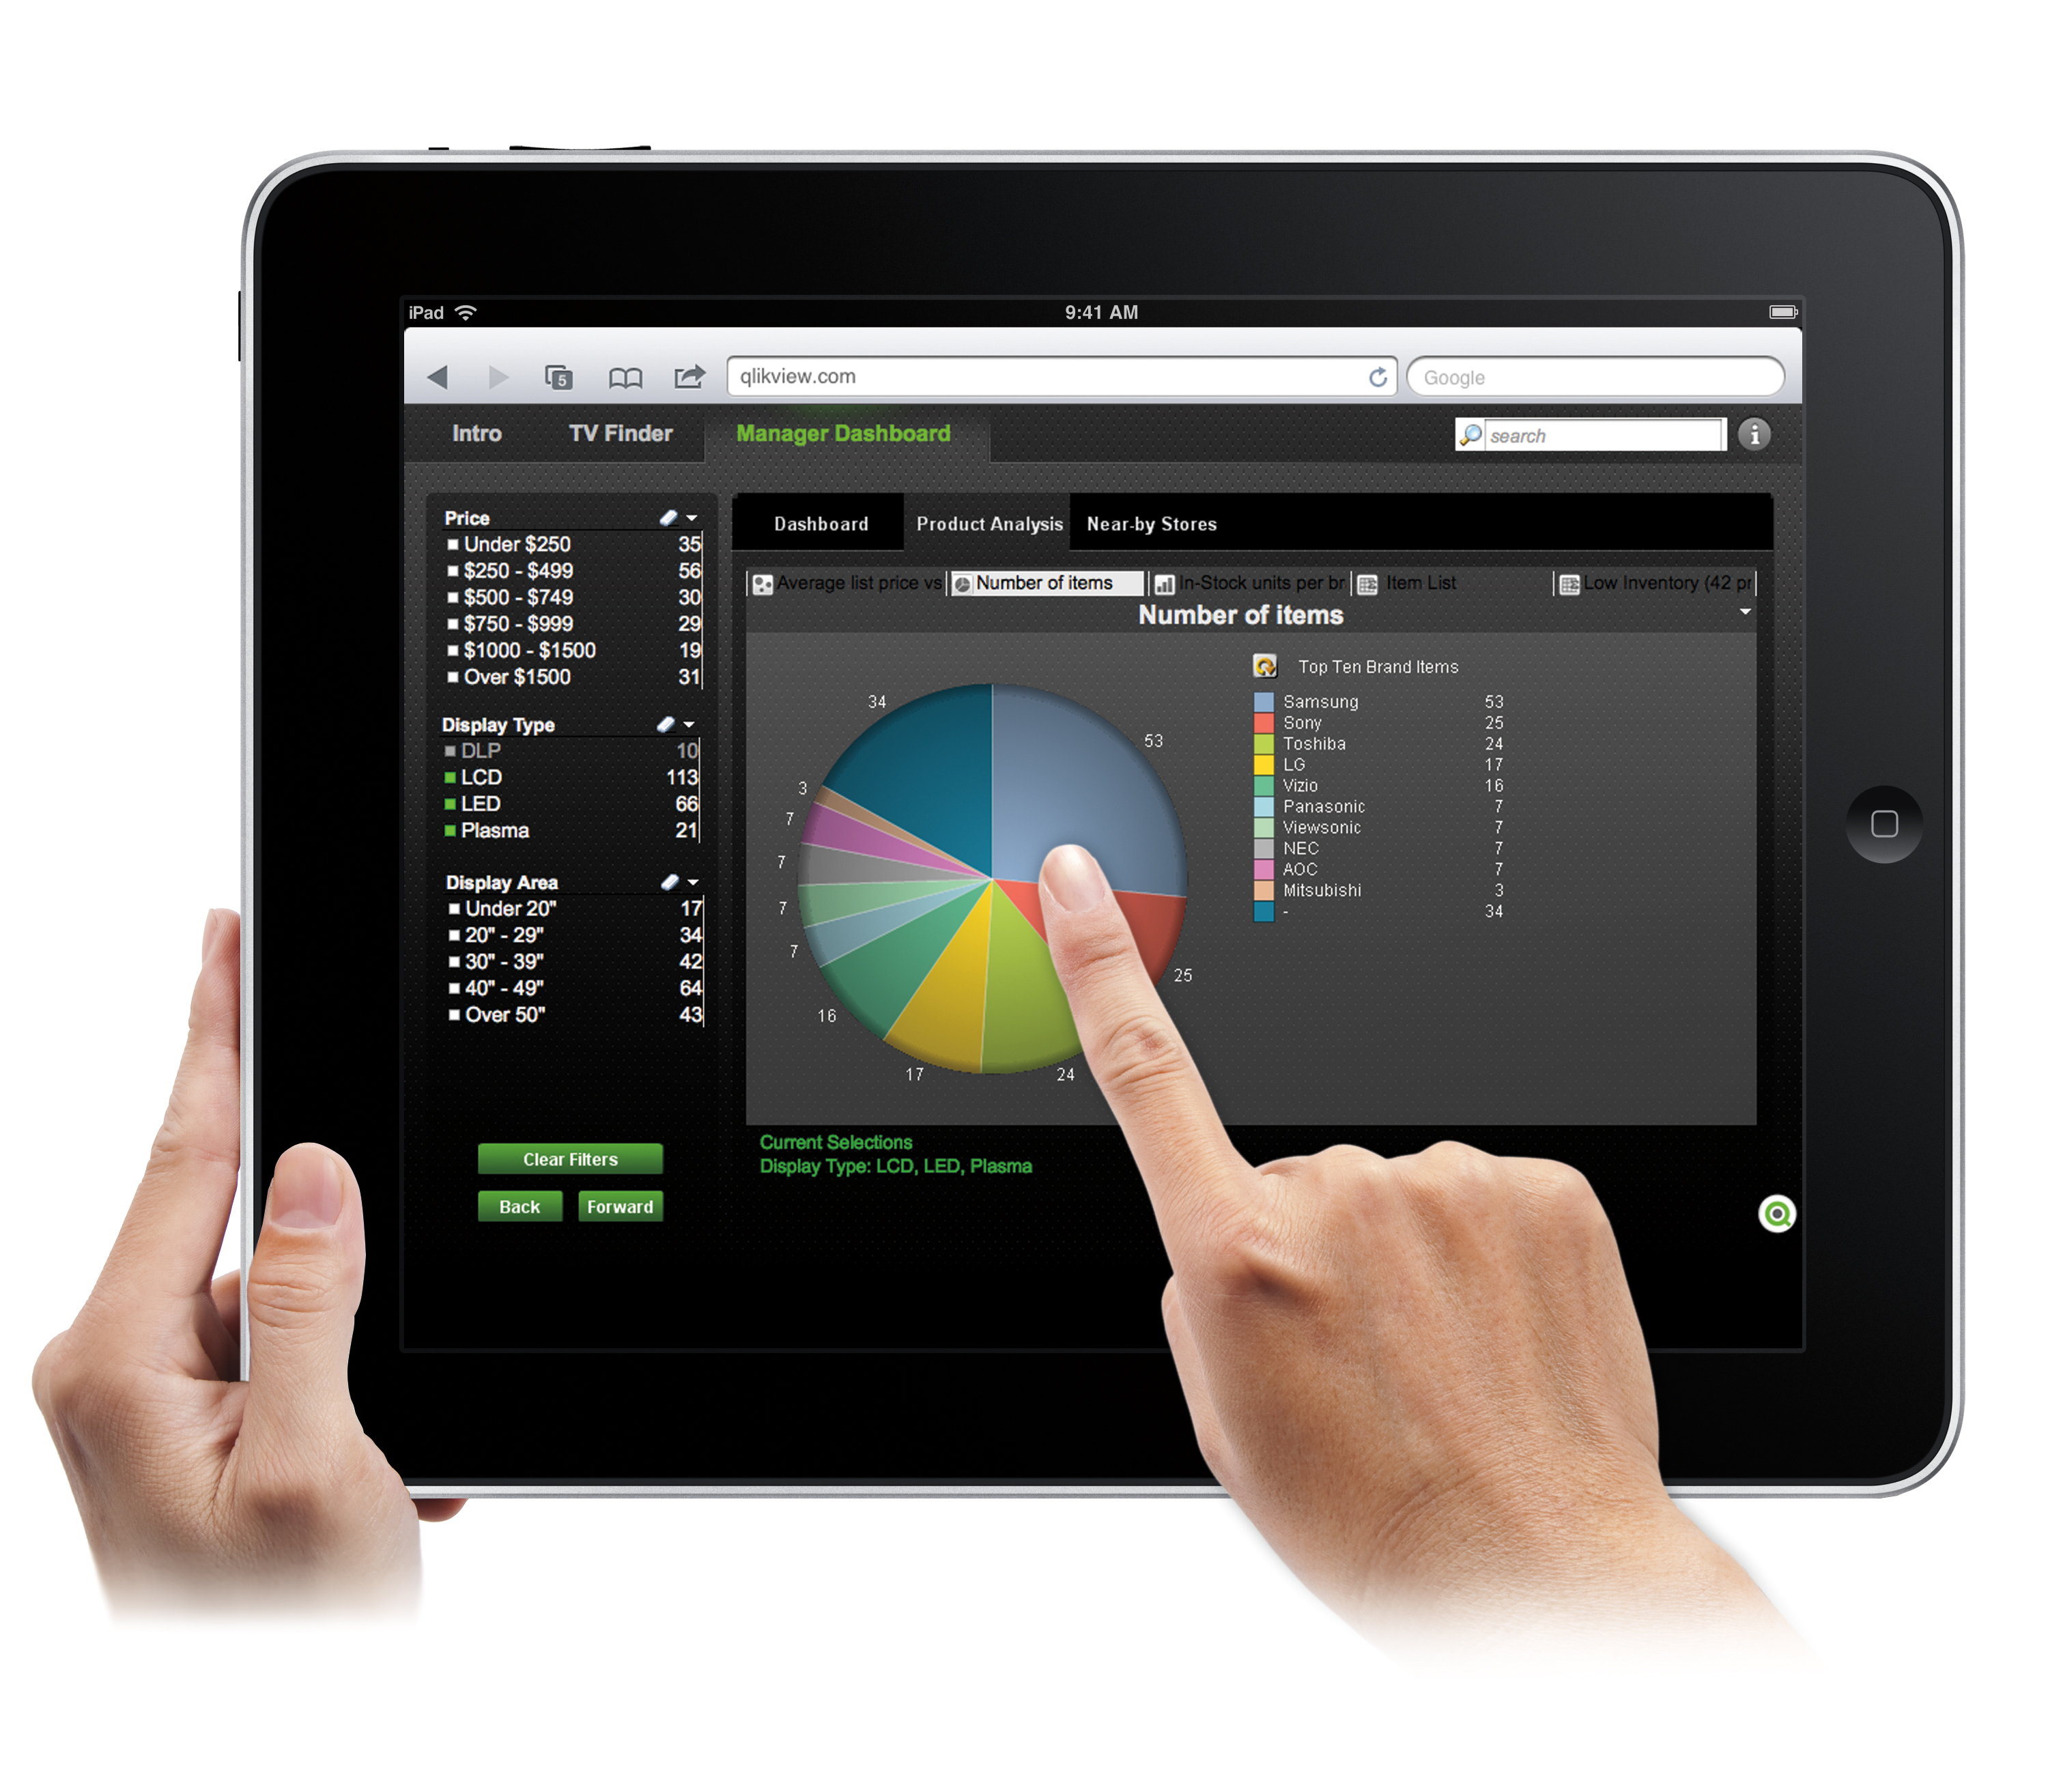
QlikView® is Qlik®’s original BI offering designed primarily for shared business intelligence reports and data visualizations. It offers guided exploration and discovery, collaborative analytics for sharing insight, and agile development and deployment.
N/A
Pricing
Reveal
QlikView
Editions & Modules
Embedded Analytics - Contact Us!
$0.00
QlikView
Custom
per user
Offerings
Pricing Offerings
Reveal
QlikView
Free Trial
Yes
Yes
Free/Freemium Version
No
No
Premium Consulting/Integration Services
No
No
Entry-level Setup Fee
Optional
Optional
Additional Details
—
On an perpetual license basis, based on server plus number of users.
Contact vendor for pricing.
More Pricing Information
Community Pulse
Reveal
QlikView
Considered Both Products
Reveal
Verified User
Anonymous
Chose Reveal
No much difference compared to major competitors regarding the cost. However, I find Reveal better equipped with lots of features. It also offers better data collaboration features which is a plus.

While understanding and using Reveal takes time to learn, it offers leading industry features. It is also a little bit expensive. However, the benefits are worth the trouble.
One reason why I would still consider Reveal despite being expensive is because it is more versatile. There are tons of features and there is so much a business can achieve with Reveal.
Reveal is more affordable compared to most competitors. Most importantly, there are no compromises on capabilities and therefore a better choice for business.
I tested these other platforms, but for what we are needing, they didn't have all the features that Reveal does. Reveal allows for more personalization and modifications. The other platforms also didn't have the plethora of templates that Reveal does.
Lacks ability to generate analytics as complex as Tableau and not as easy to embed and interface with other software and databases as Looker. But a very good option for those not needing the complexities found in other products.
Reveal promised a less steep learning curve and delivers on that promise, but that is partly because it does not provide the same depth of functionality which is available from Power BI. With Power BI, there is deeper drilling available and a wider range of tasks which can be …
The only alternative I have ever used have been internally built portals that are obviously flexible but don't have the portability and cross-platform support that Reveal has. We used ReportPlus, but it didn't have an Android alternative for my other handheld. In looking for …
Reveal's integrated .NET component approach is interesting. Many solutions have an iFrame only option, which limits your applications ability to interact with dashboards.
Reveal, compared to its competitors, has a much lower cost if we consider an audience of 100-130 end users. Not only is the initial/annual cost the advantage of Reveal, but also the simplicity of configuration, use and production of the reports. The other competitors have wider …
QlikView, Tableau, and SiSense are all very good BI tools for analysis and reporting. Tableau was better at intuitively matching fields of disparate data and more visually appealing, but I think QlikView is faster. Tableau was also easier for someone to use to build and …
I think it all comes down to personal preference and integration compatibility with the existing systems in the organization. However, I would argue that Qlik and PowerBI are the top-tier available solutions due to robust features and capabilities, and I would put solutions …
With QlikView and Qlik Sense the users can answer their own questions more interactively. They also can build their own visualizations without waiting [for] someone from IT to create a new report. The users can navigate through the data finding out relevant information. Through …
We have not necessarily used any direct competitors to QlikView, but we have used other analysis and reporting software that has worked better for us because of the type of data that we are analyzing. There are also cheaper options out there that are definitely better.
When integrating the tool years ago, we looked at other options including the out of the box reporting features from our current ERP software, The user interface and report-ability was very difficult to use and scale across may different business models in our group. We also …
There are more than 1700 partners in the world that could implement a QlikView solution, and these associates tend to have a long and close relationship with the customer, and ultimately lead up to understanding the customer's needs at 100%. Also, the software is very scalable …
MS Power BI and other BI tools have similar functions to QlikView and some of them also have much cheaper price. However, the strength of QlikView is that it is much easier to use and to learn. If you need to train a new person to learn the tool, it costs around 1-2 days.
QlikView has its own data warehouse, which is the most important reason why would I choose QlikView over any other tools. Apart from that, the feature options are good for the ones who know the tool well but created a steeper learning curve in the beginning. Once you went …
Qlik was less intuitive than Paxata, but less expensive than either MicroStrategy or PowerBI. Qlik has enough breadth to accommodate most use cases without breaking the bank.
It is inexpensive and cost prohibited software. Has alot of canned reports that you would need and doesn't request much development work. Widely adopted as an industry leader and works well with many of the top data source applications. Very easy to use and intuitive in the …
We use it as a part of our Office 365 tool. With that tool, we do not have an option to download the reports and send them to customers, but with Qlikview we can.
QlikView is very similar to Tableau. However, I believe it is a cheaper solution, and that is why our company has chosen QlikView. It has been able to handle large, large amounts of data sets, and has been pretty agile for our business needs.
My use of Cognos was as an embedded BI tool inside of a cloud HCM. At the time, you could not marry up data from other external sources with that version. QlikView makes it easy to connect data from multiple sources. As a BI tool I do prefer the Cognos set up, but that's more …
Data Quality Management Software Development Manager
Chose QlikView
QlikView was already chosen and implemented before I started [to work here], but it is very easy to learn (for me) and I started to solve problems within a day or two.
Product Specialist - Walls Product Line Management
Chose QlikView
While I may have to export the data, I was doing so anyway to get it into excel to drive better visualizations of the data. When I discovered PowerBI and all it had available I no longer had a need for QlikView.
The first thing we liked about QlikView was the price. For a small amount per user, I can have a very useful software to manage the whole data set our company uses. The Tableau desktop has very high pricing for the software, and for just one user, not the whole organization. …
Qlikview is more outdated compared to Qlik Sense. Qlik Sense puts more of the power onto the users to create their own dashboards while QlikView tends to be managed by BI teams.
As a company responsible for people money we have to deal with following challenges every day: Clients who want to track the status of their transfers. Licensing agencies who need to ensure professional standards are met. Internal team managers who need to track client and staff progress to ensure company progression and success. Reveal does a good job as self-service tool enabling the accountable parties to have full access to important insights 24/7. The prebuilt dashboard themes save time and investment as we don’t need to hire a dedicated data analyst. The interactive dashboards give full transparency. The ability to easily create, analyze and report keeps clients, partners and stuff on the same page.
Sales data validations have helped manage our justifications in the past, especially with regard to new product development and new business introduction. It has also been helpful in identifying trends with business impact and direction specific to quarter and monthly sales from ERP data as well as decisions to purchase equipment of staffing based on run rates and product demand.
One thing that can get out of hand is data output - if you aren't careful in your query, you may be overloaded with data dumps and drown in the amount of info you have to filter through. This is a user caution, not a comment on the software itself.
Ease of Use - Reveal is super intuitive when it comes to creating dashboards. You don't need to be a data expert, which is key for me.
Sharing - The ability to share across our teams, locations, and with clients is great. We create teams for our different clients and share dashboards there that also are connected to our company dashboards.
Support and Roadmap - Reveal support has been great. They care about the needs of their customers. They have released 3 updates in the last few months, and they are adding a lot of value.
We found that QlikView can be a bit slow in supporting some forms of encryption. It is web-based and we needed to upgrade all of our server to not support the older SSL and TLS 1 protocols, only support TLS 1.2 and TLS 1.3. However, QlikView could not run with TLS 1.2 and TLS 1.3. We had to wait over six months to get a version that would handle the newer TLS versions.
There are so many options with QlikView that you can get lost when developing a visualization. There are still items I have not yet figured out, such as labeling a graph with the name of a selected detail item.
QlikView works by pulling the data it is going to use for visualization into its database. I am a security reviewer and I need to make certain that PII and PHI is not pulled by QlikView for a visualization, otherwise this could become a reportable indecent.
As a developer of the project, I feel comfortable with this tool for its peculiarities: acceptable costs, simple configuration, creation and maintenance of simple reports, fairly complete account management, also, not least, I appreciate the work done by their technical support always timely intervention and, above all, resolutive. Furthermore, as far as end users are concerned, I found a good appreciation of the proposed reports
Ease of use, ability to load from pretty much any data source. today I created an application that loaded time sheets from excel that are not in a table format. With Qlik's "enable transformation steps" I was able to automate loads of multiple spreadsheets and multiple tabs easily. Could not do that with any other tool.
There's a little setup initially, but it's very simple. I would only ask for a few more options in font size. My iOS app screenshots perfectly, while the Android version is hard to get all the data to show in the field. I typically show total sales and percentage to LY as my primary team reports...as well as seeing how I'm doing versus the other Area Managers.
I do think there is a steep learning curve to the program and that it requires a high level of experience or a data scientist background to fully take advantage and implement dashboards, and users will require ongoing training to maximize ROI, but it is absolutely worth it considering the impact it can make on an organization.
This assessment is due to the fact that I have not yet found Reveal not available for use. Apart from some problems of development crash, then fixed by the product assistance service, I have not found any particular problems or loss of time caused by the instrument.
The pages load rather quickly even in the presence of several elevations in the same dashboard that insist on different data sources and with visualizations that insist on different types of graph. I can only be satisfied with these performances.
The documentation presented by QlikView is very clear and exact. This makes the process of implementation more easy. If any questions arise while creating the reports it is very easy to access the QlikView documents through the internet. QlikView also has a Qlik Community, full of different questions and answers. This helps a lot to resolve issues even without contacting the support team.
My team attended, but I cannot myself rate, but I think it was good as they've successfully launched a training program at our company themselves for users. It was 3-4 day training.
Training was as expected. The demo environments tend to be more fully featured that our own environment, but the training was clear and well delivered.
None in particular, however, would be welcome if improvements were made in the personalization of the prospects and in the connection between them (perhaps being able to transfer the selections present in one prospect to another recalled by the first).
It has taken some time to get used to Qlikview and the backend team behind it. From understanding the new regulations on using less images and also pushing for more tools (such as full compatibility on desktop, laptop, ipad, phone). We were given training on this and have helpful tips to find analytics behind Qlikview but it is very much also a learn as you implement system.
I tested these other platforms, but for what we are needing, they didn't have all the features that Reveal does. Reveal allows for more personalization and modifications. The other platforms also didn't have the plethora of templates that Reveal does.
With QlikView and Qlik Sense the users can answer their own questions more interactively. They also can build their own visualizations without waiting [for] someone from IT to create a new report. The users can navigate through the data finding out relevant information. Through QlikView color code, users can get aware of the relationship between the different data points.
This evaluation is the result of the fact that I have not had the opportunity to deepen the Reveal interface with other tools and / or other software, so the evaluation that I am giving follows what I have been able to read regarding the characteristics of the product online.
Speed to market is the really big thing. You can attach to multiple data sources quickly and build a consumable model for a dashboard. It doesn’t require IT talent to build. We have built more dashboards and added more users in the last year, then in our entire history. I was at a company of 30k+ employees before, and we didn't have near this level of BI adoption.
As a result, we are seeing benefits across business function. For example, within sales, our pipeline has much more visibility. It allows for much faster decisions on things like quotas. One of our biggest power users is in sales ops. She feels her dashboards load 10x faster than our previous tool and she can make changes on the fly.