Chose Reveal
No much difference compared to major competitors regarding the cost. However, I find Reveal better equipped with lots of features. It also offers better data collaboration features which is a plus.

| Product | Rating | Most Used By | Product Summary | Starting Price |
|---|---|---|---|---|
 Reveal | N/A | Reveal embedded analytics enables teams and customers to drive data insights with embedded intelligence, transforming the user experience of apps. Built with embed in mind first, on modern architecture, Reveal’s API aims to remove the complexity of embedding analytics into applications. Reveal’s native SDKs can be integrated into applications on any platform and tech stack including: .NET Core, Java, NodeJS (coming soon), and front-end technologies such as React, Angular, WebComponent,… | $0 | |
 Tableau Desktop | N/A | Tableau Desktop is a data visualization product from Tableau. It connects to a variety of data sources for combining disparate data sources without coding. It provides tools for discovering patterns and insights, data calculations, forecasts, and statistical summaries and visual storytelling. | $75 per month per user |
| Reveal | Tableau Desktop | |||||||||||||||
|---|---|---|---|---|---|---|---|---|---|---|---|---|---|---|---|---|
| Editions & Modules |
|
| ||||||||||||||
| Offerings |
| |||||||||||||||
| Entry-level Setup Fee | Optional | No setup fee | ||||||||||||||
| Additional Details | — | All pricing plans are billed annually. | ||||||||||||||
| More Pricing Information | ||||||||||||||||
| Reveal | Tableau Desktop | |
|---|---|---|
| Considered Both Products |  Reveal  Jason Kerluck Area Manager Chose Reveal The only alternative I have ever used have been internally built portals that are obviously flexible but don't have the portability and cross-platform support that Reveal has. We used ReportPlus, but it didn't have an Android alternative for my other handheld. In looking for …  Daniel Pickett, CFA Chief Data Scientist Chose Reveal Reveal's integrated .NET component approach is interesting. Many solutions have an iFrame only option, which limits your applications ability to interact with dashboards. |  Tableau Desktop  Manidipa Kundu Data Analyst Chose Tableau Desktop Both power bi and Tableau Desktop has its own pros and cons. Microsoft power bi is best to work with Microsoft products. however for fast connection with diverse range of integration with data sources Tableau Desktop is best. if you are cost sensitive power bi is best option …  Jannika Rasi Senior Business Analyst Chose Tableau Desktop Tableau is more flexible than these - I liked Qlikview old version a lot but have not used the Qlik Sense etc new ones. Tableau user logic is harder to understand than Looker Studio. However it's more trust worthy. Connecting internet sources to Tableau Desktop is much harder. …  Karol Kozłowski Project manager Chose Tableau Desktop We used to use products from the Google family in parallel. After migrating to GA4, we use Tableau much more.  Liz Brandon Sr Manager Performance Analytics Chose Tableau Desktop Tableau Desktop has a more easy to use drag and drop interface and is easier to learn. It also allows greater customization of charts than Power BI. However, Tableau Desktop costs more than Power BI which is bundled into our Microsoft contract at no additional charge. Power BI …  Amanda McCombs Director Client Operations & Analysis Chose Tableau Desktop The visualizations are far and away more powerful and it is more user friendly than Power BI. It would take 3-4 times as long to create the types of reports in Excel that I can create in Tableau Desktop and there are a slew of ways I can present the data in Tableau Desktop that …  Shubham Tiwari Data analyst Chose Tableau Desktop Tableau can create visually attractive customizable dashboards than can quickly by drag-drop while in power bi we can create simple dashboard. Power bi support lesser data source while in Tableau there is a lot of options When we talk about data handling tableau is a clear …  Tohidul Islam Information Technology Team Lead Chose Tableau Desktop With Tableau Desktop, it's easy to create a report in the
context quickly. It allows for the seamless management of the data sources,
which is convenient for the data users. Because it is simple to use, it is  Orin Mamun Junior Frontend Developer Chose Tableau Desktop For complex data visualization, Tableau Desktop shines. Even though it uses highly granular databases, it has a powerful engine that can process large amounts of data quickly and produce high-quality charts. It has the broadest range of APIs and is extremely simple. The …  Jeremy Pierce, MBA Data Warehouse Engineer Chose Tableau Desktop We decided to use Tableau Desktop as that's fairly standard in the industry, it is being taught in college, and is widely known. Tableau Desktop is nice, but in my opinion, it is VERY expensive. Unless you are really making money off of decisions, then your ROI is going to be …  Al Mubassir Muin Software Engineer Chose Tableau Desktop Using Tableau Desktop, we have found it the most actionable and user-friendly application ever. It has the broadest range of APIs and is exceptionally user-friendly. It can handle a large amount of data and produce smooth charts quickly. For data geeks, this is the ideal stack.  Afia Tamanna Information Technology Business Consultant Chose Tableau Desktop Tableau Desktop is preferred over other BI software because it allows for more data visualization, storytelling, and dashboards. Microsoft Power BI may be a better option if you need to perform data modeling, however. Tableau Desktop is an excellent tool for nearly all other …  Joseph Alleruzzo Director, Client Lead Chose Tableau Desktop Tableau Desktop is the most user-friendly and actionable application we have used in comparison to others. It has the best API connection potential along with easy start-up. They seem to always be updating the platform to solve newer problems which help keep my company up to …  Rafael Grandizoli Gerente de Operações Chose Tableau Desktop For databases or types of data that have high granularity and details, Tableau Desktop is better to plot and help visualize every detailed behavior with a great performance. It's engine can process a massive amount of data and generate a smooth chart without spending too much … |
| Reveal | Tableau Desktop | |||||||||||||||||||||
|---|---|---|---|---|---|---|---|---|---|---|---|---|---|---|---|---|---|---|---|---|---|---|
| BI Standard Reporting |
| |||||||||||||||||||||
| Ad-hoc Reporting |
| |||||||||||||||||||||
| Data Discovery and Visualization |
| |||||||||||||||||||||
| Access Control and Security |
| |||||||||||||||||||||
| Application Program Interfaces (APIs) / Embedding |
| |||||||||||||||||||||
| Report Output and Scheduling |
| |||||||||||||||||||||
| Mobile Capabilities |
|
| Reveal | Tableau Desktop | |
|---|---|---|
| Small Businesses |  BrightGauge Score 9.1 out of 10 | BrightGauge Score 9.1 out of 10 |
| Medium-sized Companies | BrightGauge Score 9.1 out of 10 | Reveal Score 10.0 out of 10 |
| Enterprises |  Infor Birst Score 5.3 out of 10 |  Kyvos Semantic Intelligence Layer Score 9.9 out of 10 |
| All Alternatives | View all alternatives | View all alternatives |
| Reveal | Tableau Desktop | |
|---|---|---|
| Likelihood to Recommend | 10.0 (0 ratings) | 8.7 (0 ratings) |
| Likelihood to Renew | 8.2 (0 ratings) | 8.9 (0 ratings) |
| Usability | 8.3 (0 ratings) | 8.6 (0 ratings) |
| Availability | 8.2 (0 ratings) | 8.0 (0 ratings) |
| Performance | 7.3 (0 ratings) | 6.1 (0 ratings) |
| Support Rating | - (0 ratings) | 7.0 (0 ratings) |
| In-Person Training | - (0 ratings) | 9.4 (0 ratings) |
| Online Training | - (0 ratings) | 8.0 (0 ratings) |
| Implementation Rating | 7.3 (0 ratings) | 8.0 (0 ratings) |
| Configurability | 7.3 (0 ratings) | 8.1 (0 ratings) |
| Ease of integration | 6.4 (0 ratings) | 10.0 (0 ratings) |
| Product Scalability | 6.4 (0 ratings) | 7.0 (0 ratings) |
| Vendor post-sale | 7.3 (0 ratings) | 10.0 (0 ratings) |
| Vendor pre-sale | 7.3 (0 ratings) | 10.0 (0 ratings) |
| Reveal | Tableau Desktop | |
|---|---|---|
| Likelihood to Recommend |
|
Karol Kozłowski Project manager |
| Pros |
|
|
| Cons |
|
|
| Likelihood to Renew |
|
 Mashhood Syed BI Analyst |
| Usability |
Jason Kerluck Area Manager |
Al Mubassir Muin Software Engineer |
| Reliability and Availability |
|
 Brad Llewellyn Associate Data Analytics Consultant |
| Performance |
|
|
| Support Rating | No answers on this topic |
|
| In-Person Training | No answers on this topic |
 Jon Boeckenstedt Associate Vice President |
| Online Training | No answers on this topic |
|
| Implementation Rating |
|
 Phillip Smith Sr. Financial Analyst (Finance Manager) |
| Alternatives Considered |
|
|
| Scalability |
|
|
| Return on Investment |
|
Afia Tamanna Information Technology Business Consultant |
| ScreenShots | Reveal Screenshots   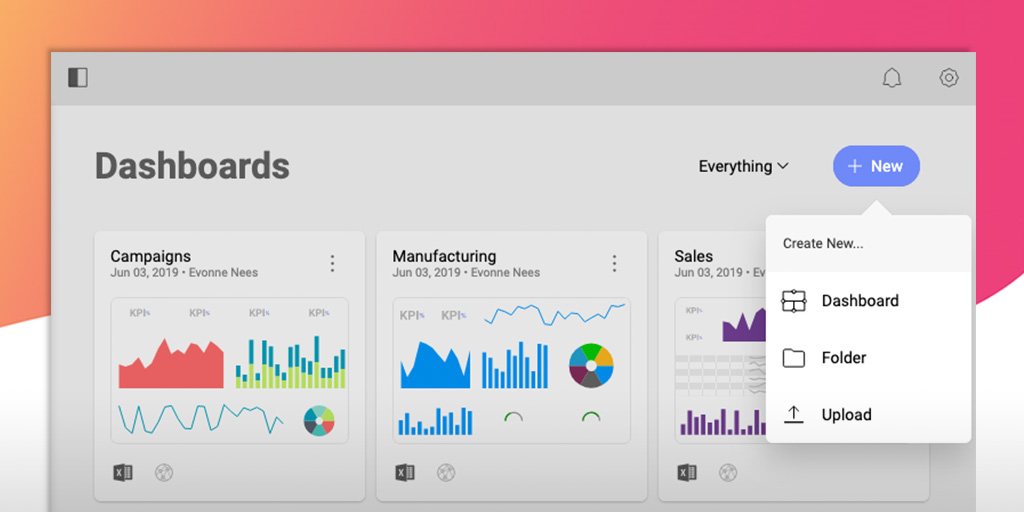   |