
JMP Pro vs. OpenText Magellan
JMP Pro vs. OpenText Magellan
| Product | Rating | Most Used By | Product Summary | Starting Price |
|---|---|---|---|---|
 JMP Pro | N/A | JMP Pro offers all the capabilities of JMP, plus advanced features for more sophisticated analysis including predictive modeling and cross-validation techniques. | N/A | |
 OpenText Magellan | N/A | OpenText Magellan Analytics Suite leverages a comprehensive set of data analytics software to identify patterns, relationships and trends through data visualizations and interactive dashboards. | N/A |
| JMP Pro | OpenText Magellan | |||||||||||||||
|---|---|---|---|---|---|---|---|---|---|---|---|---|---|---|---|---|
| Editions & Modules | No answers on this topic | No answers on this topic | ||||||||||||||
| Offerings |
| |||||||||||||||
| Entry-level Setup Fee | No setup fee | No setup fee | ||||||||||||||
| Additional Details | — | — | ||||||||||||||
| More Pricing Information | ||||||||||||||||
| JMP Pro | OpenText Magellan |
|---|
| JMP Pro | OpenText Magellan | ||||||||||||||||||
|---|---|---|---|---|---|---|---|---|---|---|---|---|---|---|---|---|---|---|---|
| BI Standard Reporting |
| ||||||||||||||||||
| Ad-hoc Reporting |
| ||||||||||||||||||
| Report Output and Scheduling |
| ||||||||||||||||||
| Data Discovery and Visualization |
| ||||||||||||||||||
| Access Control and Security |
| ||||||||||||||||||
| Mobile Capabilities |
| ||||||||||||||||||
| Application Program Interfaces (APIs) / Embedding |
|
| JMP Pro | OpenText Magellan | |
|---|---|---|
| Small Businesses |  IBM SPSS Statistics Score 7.7 out of 10 |  BrightGauge Score 9.1 out of 10 |
| Medium-sized Companies |  Posit Score 10.0 out of 10 |  Reveal Score 10.0 out of 10 |
| Enterprises | Posit Score 10.0 out of 10 |  Kyvos Semantic Intelligence Layer Score 9.9 out of 10 |
| All Alternatives | View all alternatives | View all alternatives |
| JMP Pro | OpenText Magellan | |
|---|---|---|
| Likelihood to Recommend | 9.0 (0 ratings) | 9.0 (0 ratings) |
| Likelihood to Renew | - (0 ratings) | 3.9 (0 ratings) |
| Usability | - (0 ratings) | 9.0 (0 ratings) |
| Support Rating | - (0 ratings) | 9.0 (0 ratings) |
| JMP Pro | OpenText Magellan | |
|---|---|---|
| Likelihood to Recommend |
| 
 Bri Gipson Sr. Systems Engineer |
| Pros |
|
 Martin Rubens IT solutions Manager |
| Cons |
 Bin Cai Graduate Research Assistant |
|
| Likelihood to Renew | No answers on this topic |
 Todd Bellamy Systems Analyst |
| Usability | No answers on this topic |
|
| Support Rating | No answers on this topic |
 Jeffrey Fischer Business and Channel Development Director |
| Alternatives Considered |
Bin Cai Graduate Research Assistant |
 Christopher Noyes Director Advertising Technology |
| Return on Investment |
Bin Cai Graduate Research Assistant |
|
| ScreenShots | OpenText Magellan Screenshots   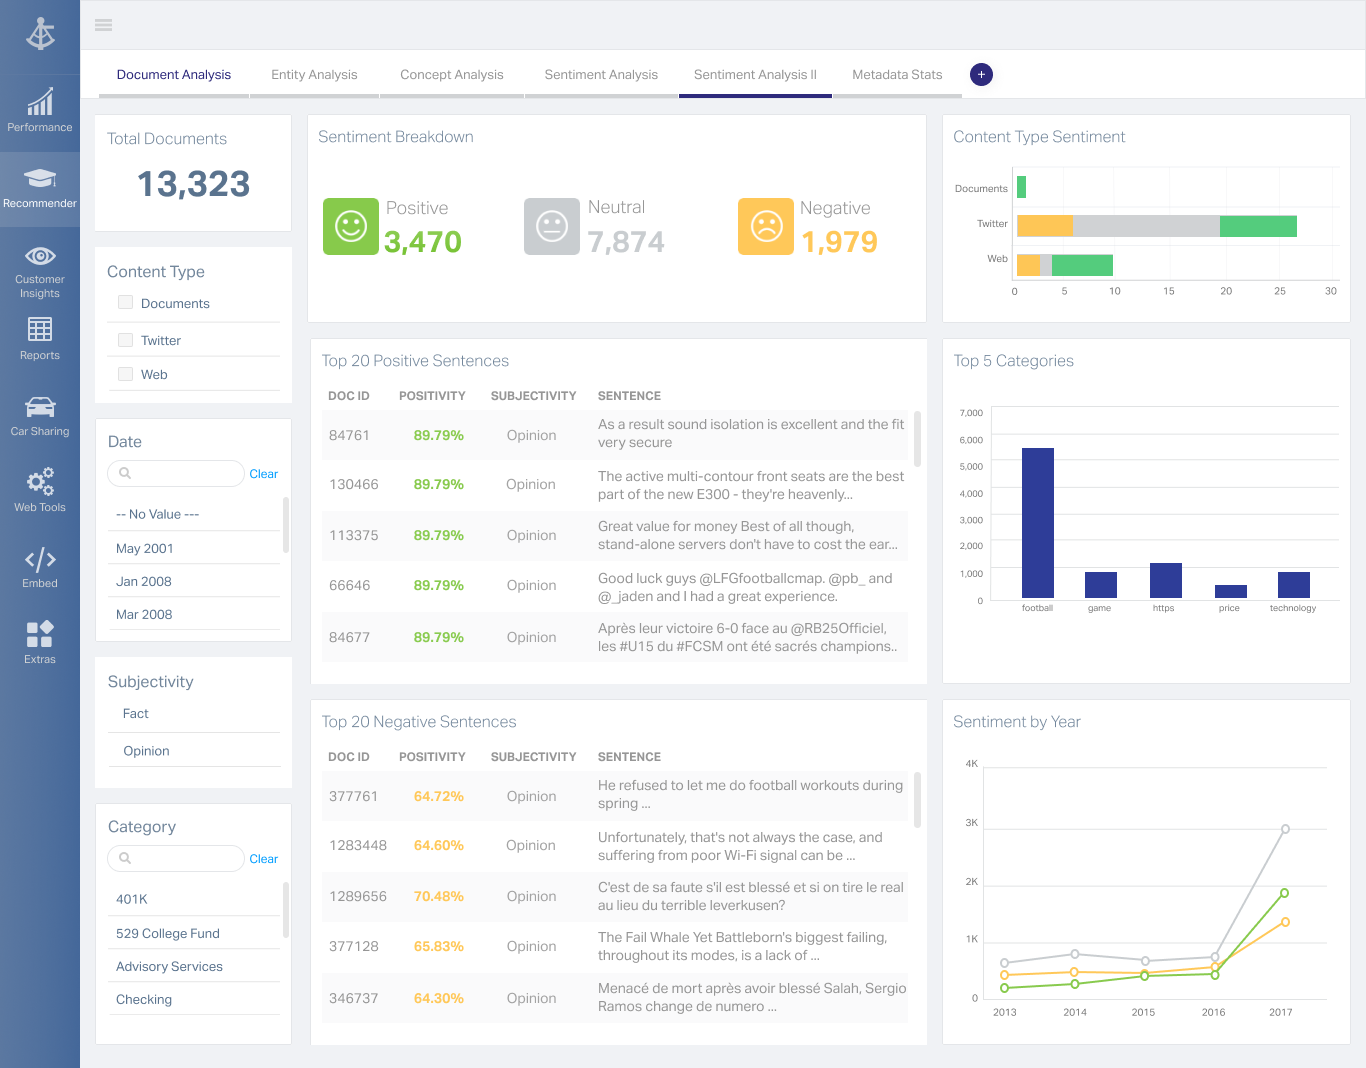 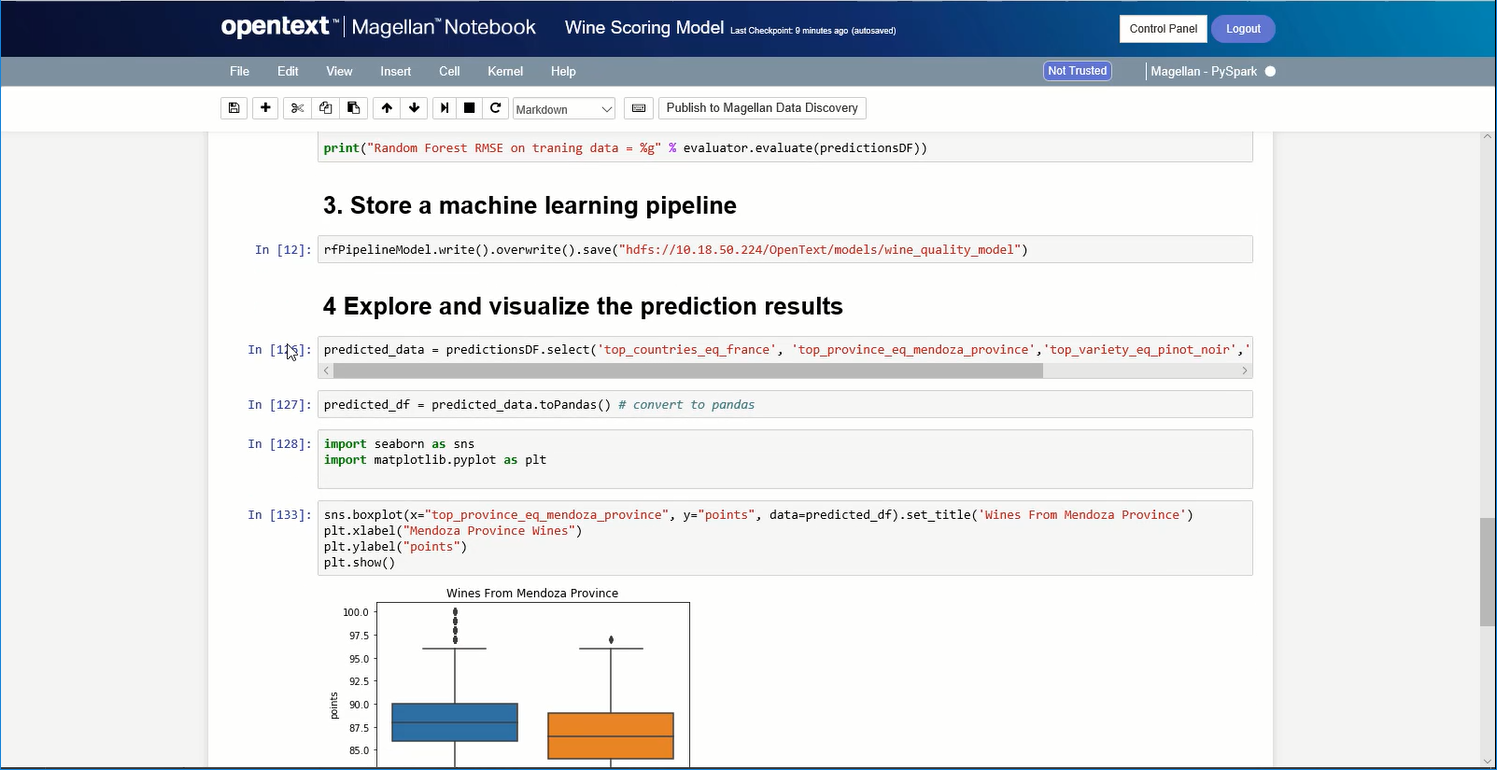 |