Chose Klipfolio Klips
Sisense

| Product | Rating | Most Used By | Product Summary | Starting Price |
|---|---|---|---|---|
 Klipfolio Klips | Small Businesses (1-50 employees) | Klipfolio is a customizable dashboard and reporting platform that provides real-time business insights. It is used by small to mid-sized businesses and agencies to track performance metrics and create tailored reports, and to consolidate, transform, and visualize data. | $90 per month | |
 SAS Visual Analytics | Enterprise companies (1,001+ employees) | SAS Visual Analytics provides a complete platform for analytics visualization, enabling users to identify patterns and relationships in data that weren't initially evident. Interactive, self-service BI and reporting capabilities are combined with out-of-the-box advanced analytics so everyone can discover insights from any size and type of data, including text. | N/A |
| Klipfolio Klips | SAS Visual Analytics | |||||||||||||||
|---|---|---|---|---|---|---|---|---|---|---|---|---|---|---|---|---|
| Editions & Modules |
|
| ||||||||||||||
| Offerings |
| |||||||||||||||
| Entry-level Setup Fee | Optional | No setup fee | ||||||||||||||
| Additional Details | Discount available for annual pricing. There are various implementation and training options available, from a 60 Day Proof of Concept, to Onboarding & Training, or ongoing dedicated Data Hero support. | SAS Visual Statistics and SAS Office Analytics are also available as add-ons. | ||||||||||||||
| More Pricing Information | ||||||||||||||||
| Klipfolio Klips | SAS Visual Analytics | |
|---|---|---|
| Considered Both Products |  Klipfolio Klips  Gulam Gaus Warsi Marketing Specialist Chose Klipfolio Klips Klipfolio is a more flexible tool when we consider its many functions. These functions allows the us to create a dashboard which can combine multiple data sources. These combinations of data sources often provide deeper insights when compared with other visualization tools. …  Nigel Runesu Digital Marketing Consultant Chose Klipfolio Klips Google Data Studio, Microsoft Power BI and Tableau Public  Art Stiefel VP, Digital Strategy Chose Klipfolio Klips Over the years, I have been required to work with other platforms to collect and analyze data for a variety of ad agencies and clients that I have worked with. It really came down to a Goldilocks comparison where we consistently found that dashboard platforms were bloated with …  Parker O'Very Manager of Marketing Operations Chose Klipfolio Klips These and many other BI tools are the most direct competitors. I only have experience with Klipfolio and Tableau. Tableau is definitely more capable, but much more difficult to learn and use. Klipfolio is simple and really packs a punch for its simplicity. I have yet to run …  Dave Moll Digital Marketing Manager Chose Klipfolio Klips Klipfolio had the best API. We could connect more MarTech with Klipfolio than any other BI tool we used. Klipfolio's API was also the most stable. We ran into connectivity issues with some of the competitors. The metrics wouldn't refresh because the API lost the connection …  Francois Salvert Web Analytics and Data dashboarding (consulting mandate) Chose Klipfolio Klips Klipfolio is certainly the best solution for dashboards. Compared to Power BI, Power BI is more of an analyst tool to build deep analysis and reports. Making and sharing dashboards in Power BI is a pain. Tableau is great but cost way more. Also, the skills needed to build …  Rubem Klein Jr. Product Performance Analyst Chose Klipfolio Klips We used Redash before. It isn't as friendly, easy to use and with a great customer support as Klipfolio. Klipfolio simply has way more features available that won't require you to hard-code.  Brian Dainis CEO Chose Klipfolio Klips Birst, Tableau, Grow, MS BI, Google Docs/Sheets, Sisense  Stephanie Dias Analista de conteúdo Chose Klipfolio Klips I never used other products  Arjanne Pruntel Head of Commerce Chose Klipfolio Klips Less sources to connect.  Colin Castle Director of Sales and Marketing Chose Klipfolio Klips They are all based on a similar methodology (Excel) but I felt Klipfolio had better integrations and their support team has been the difference maker. For a company that needs some hand-holding and guidance, Klipfolio is the right choice.  Henrik Christensen Ranger & Virtual CEO Chose Klipfolio Klips QuoteWerks  Roger Crist, Jr. Director of Finance Chose Klipfolio Klips Klipfolio is cloud-based, allows for customization, reliable, and intuitive. The competitors were all lacking in one or more areas.  Chris Williams Director of Marketing Chose Klipfolio Klips I have not personally tried any other products like Klipfolio, but based on my personal experience Klipfolio has a strong foundation for their platform and I feel its only going to get better over time as they grow. I would encourage people to give a few platforms a try and I … | SAS Visual Analytics  Raman Ahuja Associate Consultant Chose SAS Visual Analytics Visual Studio IDE  Tapan Jain Data Analyst Chose SAS Visual Analytics Tableau Desktop  Mike Narumiya Director, Data and Information Systems Chose SAS Visual Analytics Price and features we looked at seemed consistent. We chose this product because our staff already knew the product, plus users at the state had recommended it as it is what they use.  suva sahu Project Lead Chose SAS Visual Analytics SAS visual analytics has high sped LASR servers mounted on Hadoop filesystems which makes it more powrful for analytics.  Alex Rubin Sr. SAS Programmer (consultant) Chose SAS Visual Analytics Never used or evaluated other similar products  Erik Larsen Consultant SAS Business Intelligence Architect and Analyst Chose SAS Visual Analytics There is no contest. SAS is easier maintain and has much more in the way of analytics than MicroStrategy has. It can pull from more than one data source and when the underlying architecture changes, it is much easier to maintain. More savvy analysts can perform more with SAS … |
| Klipfolio Klips | SAS Visual Analytics | |||||||||||||||||||||
|---|---|---|---|---|---|---|---|---|---|---|---|---|---|---|---|---|---|---|---|---|---|---|
| BI Standard Reporting |
| |||||||||||||||||||||
| Ad-hoc Reporting |
| |||||||||||||||||||||
| Report Output and Scheduling |
| |||||||||||||||||||||
| Data Discovery and Visualization |
| |||||||||||||||||||||
| Access Control and Security |
| |||||||||||||||||||||
| Mobile Capabilities |
| |||||||||||||||||||||
| Application Program Interfaces (APIs) / Embedding |
|
| Klipfolio Klips | SAS Visual Analytics | |
|---|---|---|
| Small Businesses |  Supermetrics Score 10.0 out of 10 |  BrightGauge Score 9.0 out of 10 |
| Medium-sized Companies | Supermetrics Score 10.0 out of 10 |  Reveal Score 10.0 out of 10 |
| Enterprises |  Dataiku Score 7.6 out of 10 |  Kyvos Semantic Intelligence Layer Score 9.9 out of 10 |
| All Alternatives | View all alternatives | View all alternatives |
| Klipfolio Klips | SAS Visual Analytics | |
|---|---|---|
| Likelihood to Recommend | 8.8 (0 ratings) | 9.0 (0 ratings) |
| Likelihood to Renew | - (0 ratings) | 9.3 (0 ratings) |
| Usability | 9.5 (0 ratings) | 6.0 (0 ratings) |
| Support Rating | 9.1 (0 ratings) | 8.0 (0 ratings) |
| Implementation Rating | 8.2 (0 ratings) | - (0 ratings) |
| Klipfolio Klips | SAS Visual Analytics | |
|---|---|---|
| Likelihood to Recommend |
|
Raman Ahuja Associate Consultant |
| Pros |
Parker O'Very Manager of Marketing Operations |
Tapan Jain Data Analyst |
| Cons |
 Lisa Wester Email Marketing Strategist, Chief Engagement Officer & Founder |
|
| Likelihood to Renew | No answers on this topic |
Erik Larsen Consultant SAS Business Intelligence Architect and Analyst |
| Usability |
|
Raman Ahuja Associate Consultant |
| Support Rating |
|
 Nicole Jagusztyn Institutional Research Officer |
| Implementation Rating |
 Miguel Ángel del Hoyo Marketing & Analytics Consultant | No answers on this topic |
| Alternatives Considered |
|
|
| Return on Investment |
Art Stiefel VP, Digital Strategy |
suva sahu Project Lead |
| ScreenShots | Klipfolio Klips Screenshots      | SAS Visual Analytics Screenshots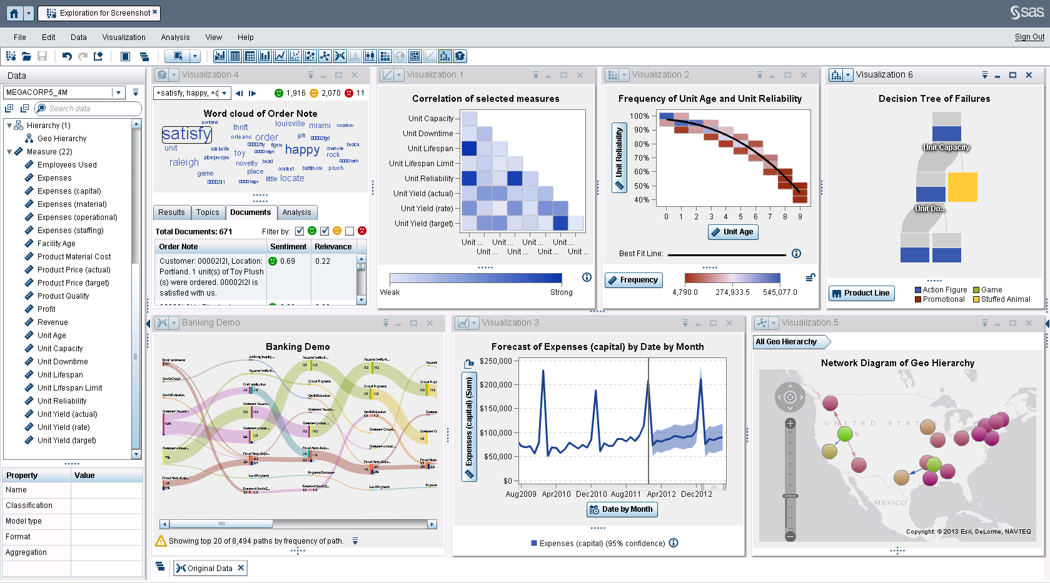 |