Microsoft Power BI is a visualization and data discovery tool from Microsoft. It allows users to convert data into visuals and graphics, visually explore and analyze data, collaborate on interactive dashboards and reports, and scale across their organization with built-in governance and security.
N/A
Quantrix
Score 7.4 out of 10
N/A
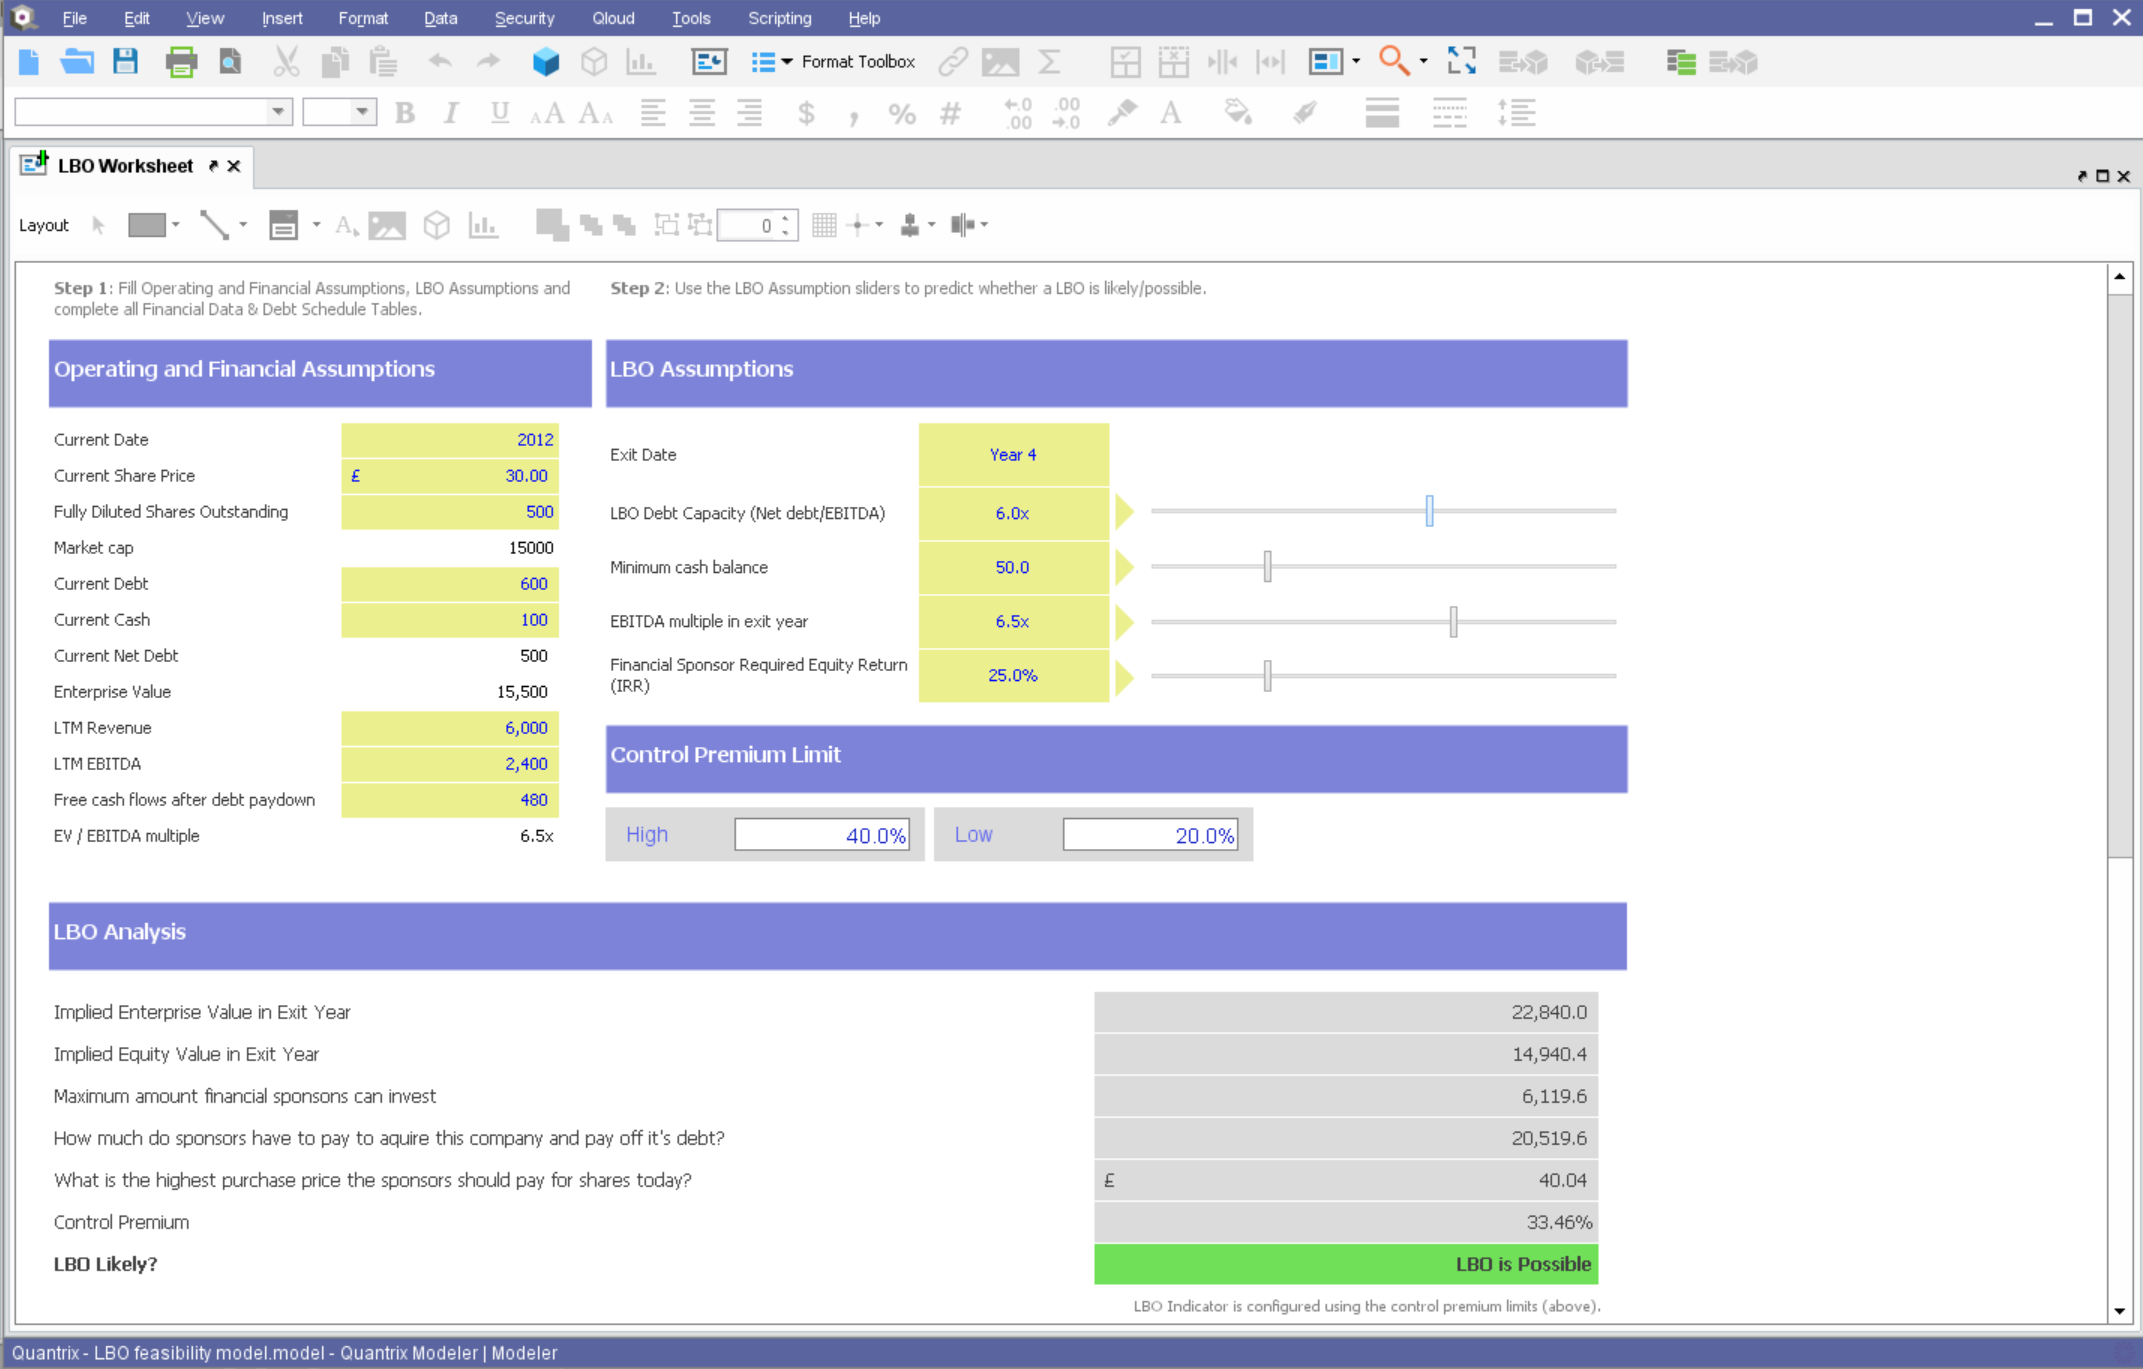
Quantrix is designed to allow users to address the limitations and risks inherent to spreadsheets when developing business-critical models. According to the vendor, this solution offers unmatched capability for forecasting, planning, budgeting, risk modeling and visual analytics, and also allows users to develop ‘what if’ scenarios and model the financial and operational impact of business decisions. Additionally, the vendor says sharing insight is made easier through the creation of interactive…
N/A
Pricing
Microsoft Power BI
Quantrix
Editions & Modules
No answers on this topic
Offerings
Pricing Offerings
Microsoft Power BI
Quantrix
Free Trial
Yes
Yes
Free/Freemium Version
Yes
No
Premium Consulting/Integration Services
No
No
Entry-level Setup Fee
No setup fee
No setup fee
Additional Details
—
Quantrix Modeler is licensed on a per user subscription basis.
All others apps are enablers and Microsoft Power BI is the visual that end user sees which often adds more value to the end user to make strategic decisions from this. All are equally great but Microsoft Power BI is the end result
Microsoft Power BI vs. Tableau Power BI cheaper and works well with Microsoft tools. Tableau has better visuals but is costly. Microsoft Power BII vs. Looker Looker is good for big data, but Microsoft Power BI is easier to use. Microsoft Power BI vs. Qlik Qlik is fast for big …
Microsoft Power BI provide a user friendly in many ways to analyse the data and visualization of the data .Stacking makes the works easier easily attach the table ,chart row and column through the various available tool ..it also reduces the work part and manpower mechanically …
Microsoft Power BI is more flexible and it requires less effort in order to create a working environment. The results have an attractive and customizable display. The model is a star schema therefore it do not require specific database adaptation. Excel and csv files could be …
Microsoft Power BI is free. If I didn't want to create a custom platform (i.e. my organization insisted on an existing platform that I *had* to use), I'd use Microsoft Power BI. For any start-up or SMB, I'd just use Claude & Grok to build it quickly, also for free. Would …
Microsoft Power BI is easier to learn, a lot of examples on YouTube, internet documentation books helps to the implementation and personalization of the dashboards easier to use than other platforms.
While excel can be useful for a very quick data dump, Microsoft Power BI is able to bring that data to life, and show trends and the actual story of what is happening. Microsoft Power BI is the ultimate display tool, and allows us to share information quickly to the CORRECT …
Compared to this tool, Microsoft Power BI doesn't involve heavy coding and provides user friendly interface to visualize data. Microsoft Power BI reports can be shared and published without exposing your source code. Also, the reports are interactive providing drill down …
Power BI is much simple to use, and more modern than BusinessObjects, which has now been discontinued. It costs much less to license than Tableau which is perhaps more niche and designed better. It is also much more powerful for data analysis than excel, smartsheet, airtable, …
Some of the strengths are 1. User-Friendliness 2. Self-Service BI (Caters to all levels of the employees 3. Cost-effective. 4. Easy integration with Microsoft Suits. 5. DAX Calculations 6. Familiar Interface like traditional Excel. 7. Easier Self-Service platform for …
It's got a larger user base and seems better supported. Personally it feels like alot more work getting comparable results from Tableau. Microsoft Power BI will be WAY easier to work with all your various data sources, if you are working in an environment with M365 already. …
After several years using Google Looker Studio and BigQuery, Microsoft Power BI is a step-up in terms of visualizations. It is also much more powerful, leading to less errors and has a more intuitive interface. Looker studio has a focus on google analytics whereas Microsoft …
NA - did not use any other software, yet. Happy with the services and features provided by Microsoft Power BI which helps us navigate through the client requests on a daily basis while also providing actionable insights / solutions with maximum efficiency and that too in a …
Each has a different function. I think Microsoft Power BI is easier to use than Tableau and cheaper but SQL and databricks have so much more versatility
I prefer Power BI because of its affordability and fewer complicated tools than Tableau. It's easy to use and compatible with other Microsoft products, which are mostly used in the IT industry. It's not limited to only one platform like Looker Studio, which is mostly used in …
Microsoft Power BI is more flexible and can also handle more complex reporting scenarios. While Microsoft Excel is a great tool for analyzing data building visuals is not what it is made for. It is complicated to create Excel reports that will be interactive as a use wants to …
Being Microsoft environment it is extremely easy to interconnect the application with other Microsoft tools, such as power point or excel. On top of that, also communication through Microsoft teams is enabled which can result in very good collaboration and exchange of feedback …
We actually chose both Power BI and Quantum Metric. We use them for different things, but they are very similar tools. Quantum does a good job of integrating with our website and app traffic, whereas we use Power BI for data analysis and importing data sets for further review. …
We have used Microsoft Power BI for almost seven years. When looking for a reporting platform, remember that you are about to make a long-term choice. Moving reports to another system isn't easy. If you have, for example, more than 100 reports, the move to a different platform …
Overall, I was not part of the ultimate decision to purchase Quantrix. I terms of user-friendliess and robust reporting capabilities I do think Tableau has Quantrix outclassed. That being said, Quantrix does provide more in-depth analyses for our relevant data and provides …
Microsoft Excel, Infor, Tagetik, Palantir Quantrix is not ready to use budgeting and planning tool, it is basically data modeling tool. That makes Quantrix different. You yourself or with help of consultant create model according to your specific business needs. You will get …
In our setting the typical alternative to Quantrix is represented by traditional bi-dimensional spreadsheet applications. We have no experience with business performance management and business analytics solutions aimed at the corporate market that can be considered another …
These are traditional spreadsheet-based software packages. Any trouble you have with Excel you have with these, but that is eliminated with Quantrix. Quantrix is an Excel/Access like application, but so much better because of the things I've previously described in this review.
R and a RDBS is less interactive. Time handling can be difficult. More for statistical purposes.
We use Access and SQL-Server for Data-Handling. RDBS is not multidimensional. Multidimensional databases have a limited function set. Quantrix has both.
Excel..think I beat this one to death already. Great for smaller datasets and simple analytical tasks, but difficult to compare to Quantrix when it comes to complex data modeling efficiently.
Tableau - Have only dabbled with it, and it has a great interface and produces some …
Quantrix handles financial forecasting far better than Excel because of it's object-oriented nature. It allows you to build very complex formulas without making cell range mistakes.
Microsoft Power BI is great for sales tracking, financial reporting, and real-time operations monitoring. It integrates data from multiple sources, creating interactive dashboards for better decision-making. However, it's less ideal for real-time big data processing, offline access, or when deep customization is needed. It works best for structured reporting but struggles with highly complex data models.
Quantrix Modeler is one of the most appropriate software tools for developing dynamic financial planning models in small teams composed by skilled power users. There is an also Enterprise version supporting larger user bases and stronger integration with company backend systems. It's not advisable to put Quantrix desktop application in the hands of non-skilled staff since the learning curve is much steeper than what's the typical experience with spreadsheets. Adding a table with ad hoc simple calculations can be done by anyone in a spreadsheet, but requires knowledgeable design in a Quantrix model. On the positive side, experience with students in our classes shows that with focused training an user can be become productive in a relatively short time. There is a web version of Quantrix Modeler, Qloud, that is aimed to end users that only modify input data and consume model results, without the possibility of changing the model logic (structure and formulas)
Quantrix gathers info from numerous sources in a single click. Thereby making structure to process sustainable and scale-able. Once the logic is written the data refreshes and you are good to go with furture analysis and planning. There is no need for rework, copying down formulas, etc. In our latest product wheel build process we reduced our time from 3 weeks of time to 2 days to build out product wheels. There was a sharp contrast between Excel ( previous method) and Quantrix.
Quantrix links perfectly to SQL Server which allows us to get actual data quickly, push out forecasts or other data for other systems to consume.
Quantrix range based formula writing and common term formulas are a HUGE time saver. Debugging formulas is a breeze in Quantrix using what is called the dependency inspector. There is no need to copy down formulas; make sure cell ranges are locked etc. It is one formula controlling a multitude of cells that scales as the data set shrinks or grows. Also if there is an error in the formula you have 1 formula to fix not hundreds or even thousands. Common terms in your formulas helps immensely and reduces the amount of headache of debugging your formulas.
Quantrix Scales with ease. Adding additional data or shrinking the data does not require (manual) structure updates to Quantrix. It accordions according to the data imported. Pivoting data and looking at it as well as filtering it and then building off of those filters and pivots is a joy to do in Quantrix!
Complexity - Excel does not have it! Where the vlookup ends in Excel the Quantrix Select statement is just warming up. Functions like: Select, Selects, SelectList, SelectGreaterThan, SelectBetween, SelectLessThan, and one of my new favorites SelectLike in addition to CASE and Switch Logic make Quantrix a dominating force when it comes to writing complex logic in your business model. Quantrix does is beautifully.
Quantrix was able to free the definition of calculation rules from cells. It would be interesting to be able to separate the default template structure from changes when importing data.
Just to be clear to prevent the import (example from a CSV or DB) the creation of new items in addition to those already existing.
An import navigation by level would be interesting. Or to obtain a split of the number on a tree structure (I bring as an example that of Corporate Planning (https://www.corporate-planning.com/de/).
As a further enhancement of the above, it would be interesting to be able to define reports like an explosion of a tree structure.
Microsoft Power BI is an excellent and scalable tool. It has a learning curve, but once you get past that, the sky is the limit and you can build from the most simple to the most complex dashboards. I have built everything from simple reports with only a few data points to complex reports with many pages and advanced filtering.
Takes a little bit to get used to it. Not natively intuitive but fairly straight forward to pick up. Also docking it a few points because you can create a really clean, simple UI in Claude very quickly that's faster than building all of this yourself in Microsoft Power BI.
It is a fantastic tool, you can do almost everything related with data and reports, it is a perfect substitutive of Power Point and Excel with a high evolution and flexibility, and also it is very friendly and easy to share. I think all companies should have Power BI (or other BI tool) in their software package and if they are in the MS Suite, for sure Power BI should be the one due to all the benefits of the MS ecosystem.
All others apps are enablers and Microsoft Power BI is the visual that end user sees which often adds more value to the end user to make strategic decisions from this. All are equally great but Microsoft Power BI is the end result
Microsoft Excel, Infor, Tagetik, Palantir Quantrix is not ready to use budgeting and planning tool, it is basically data modeling tool. That makes Quantrix different. You yourself or with help of consultant create model according to your specific business needs. You will get cost-effective, tailored solution. It is a modeling tool that allows the easy and quick creation of multiple scenarios, conducting “what-if” analysis to accommodate uncertainty associated with forecasts.
We're still early in the adoption process at this company, but we've illustrated how bad data keeps us from being more productive. ~25% of a team's work week was dedicated to effectively cleaning up entries, but it was always seen as a normal to them.
Quantrix has boosted profitability and has proven its worth time and again. The platform has put us on the radar doing things even our biggest competitors could only dream of. We are still early in the development and deployment of our Quantrix Qloud based system to clients, but we already have early adopters coming over from competitor systems that cost exponentially more and do significantly less than what we provide. We feel it is only a matter of time for our Qloud driven analytics to become more mainstream in our space.