Middesk is a business intelligence (BI) software used to onboarded clients working in three primary verticals — Fintech, Credit Reporting, and Business Marketplaces.
N/A
SAS Visual Analytics
Score 7.6 out of 10
Enterprise companies (1,001+ employees)
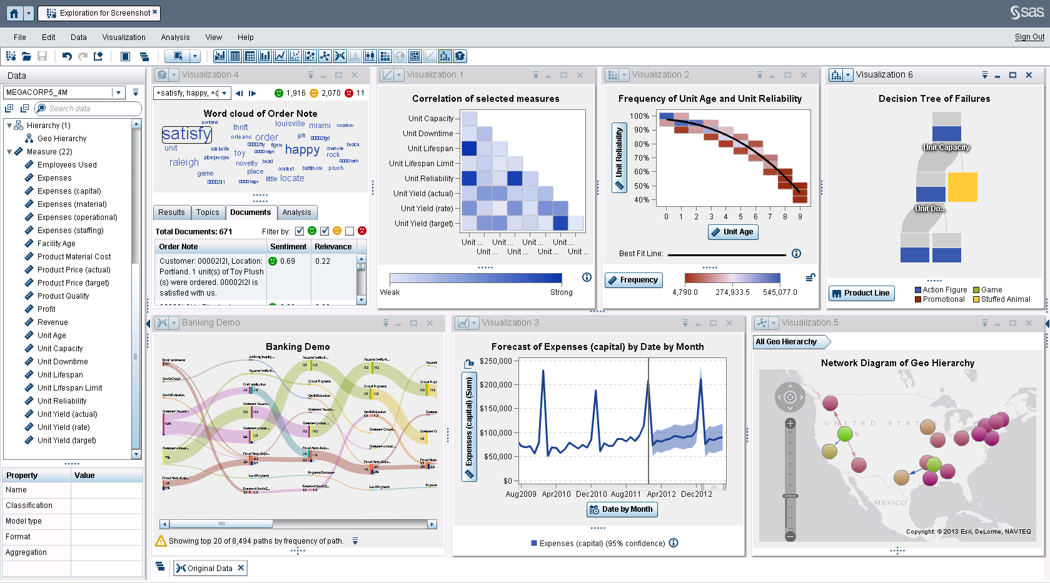
SAS Visual Analytics provides a complete platform for analytics visualization, enabling users to identify patterns and relationships in data that weren't initially evident. Interactive, self-service BI and reporting capabilities are combined with out-of-the-box advanced analytics so everyone can discover insights from any size and type of data, including text.
N/A
Pricing
Middesk
SAS Visual Analytics
Editions & Modules
No answers on this topic
SAS Visual Analytics for SAS Cloud
$0
Annual By Users: 5, 10, 20
Offerings
Pricing Offerings
Middesk
SAS Visual Analytics
Free Trial
No
Yes
Free/Freemium Version
Yes
No
Premium Consulting/Integration Services
No
No
Entry-level Setup Fee
No setup fee
No setup fee
Additional Details
Users may also pay per use if they are expecting a lower volume of usage.
SAS Visual Statistics and SAS Office Analytics are also available as add-ons.
It provides higher quality. Although the price is very costly compared to its competitors, the result after usage is exceptional. Although this product has less marketing, it is able to be reached a large number of people. The navigation is slightly better than the other …
ADP Workforce Now offers a module to handle payroll tax registrations. The interface is confusing and the information is hard to find. The service and support are awful - nobody ever knows who can answer tax account questions, they escalate to a different department and promise …
I have chosen SAS Visual Analytics because one of my colleagues suggests using the software for the same for our work. As earlier, we use to take a lot of time in analyzing the data but after using the SAS Visual Analytics software our work has improved and time has decreased. …
I have used Crystal Reports, Jaspersoft and SQL Server Reporting Services (SSRS). I would recommended Business Intelligence over SSRS and Crystal Reports. SSRS is very SQL-centric and Crystal Reports is more of an end-user tool. I would recommend Jaspersoft over Business …
We already have lot of SAS products in our organisation like Base SAS, SAS Grid, SAS EG, SAS Studio and Office Add-in. SAS VA works best for our situation.
I have used SAP Lumira as well. The reason for me to use both software is to see the user experience. With Lumira, it was easy for me to visualize data and data storytelling and with SAS it was easy for me to create an algorithm as I wanted them to be. SAS software allows me to …
Price and features we looked at seemed consistent. We chose this product because our staff already knew the product, plus users at the state had recommended it as it is what they use.
I have used Tableau desktop for which free access is provided for a limited time with limited features. Tableau is visually more appealing than SAS VA but SAS VA can handle data better. My use of Tableau with limited features may have effected my viewpoint.
We use both. But SAS is always the starting point to all analytics projects. It is a wider array of products and features. Gives robust results and reporting is easier. There is always this one or two things for which you turn to some other products to fill the holes.
Consultant SAS Business Intelligence Architect and Analyst
Chose SAS Visual Analytics
There is no contest. SAS is easier maintain and has much more in the way of analytics than MicroStrategy has. It can pull from more than one data source and when the underlying architecture changes, it is much easier to maintain. More savvy analysts can perform more with SAS …
Middesk is an excellent and vital tool for any business needing to set up operations in a new state. The process the seamless and easy. For businesses looking to transfer administration of existing state accounts, the process is a little more clunky. Either way, Middesk saves a ton of time and brainpower needed to maintain registrations with state agencies.
SAS Business Intelligence is more suited to organizations which are already using SAS as the primary software for their analytics needs. Learning curve is relatively shorter for teams already skilled in BASE SAS. For organizations already working with open source software like Julia and Python, it doesn't make much sense to use SAS BI.
SAS BI makes it very easy to create interactive dashboards even for someone who is not from an IT background. For some specific requirements, basic knowledge of SQL is good enough.
A lot of functions have been predefined which makes it very convenient to create dashboards and reports. One doesn't need to be from an IT or a programming background to understand and create dashboards.
It supports other programming languages like R and also has a seamless API integration with various data management platforms.
There is no other product that can match SAS. There are some products that can compare to ETL but lack the analytics that SAS has. Others can perform a limited set of analytical procedures but lack the data processing that comes with SAS. Using thin client allows users to access data whenever they have an internet connection.
UI is not as intuitive as other systems we use. For states that require income tax withholding, some of them require registration with multiple agencies - the UI doesn't easily tell you which login credentials are tied to which agency.
SAS BI is good for creating reports and dashboards and then sharing it with the users. It also has ability to manage access to the reports and dashboards but somehow with most of the world moving to open source languages R, Python and Julia, SAS BI feels to be archaic in terms of feature set and integrations it allow[s]. Also, comparing it with other Business Intelligence tools like Tableau and Microsoft BI, the functionality of SAS BI is very limited and doesn't justify the pricing.
The user experience of this tool must be rearchitected. I am able to observe a lot of lag in the process when initiated. There are sometimes when the tool's navigation becomes difficult. The time taken at times is large to process a request and this can also be highly improved in the future.
When you call tech support, you are immediately routed to a person who can answer your question. Often they can answer on the spot. However, if they cannot, you are given a track number and then followed up with. There have been times when I have had multiple track numbers open and they will actually TRACK YOU DOWN to ensure that your problem has been resolved. Issues do not fall into black holes with SAS. They are also willing to do a WebEx with you to diagnose the problem by seeing your environment, which is always helpful.
It provides higher quality. Although the price is very costly compared to its competitors, the result after usage is exceptional. Although this product has less marketing, it is able to be reached a large number of people. The navigation is slightly better than the other competitor tools. User experience is another important reason it attracts people.
I have chosen SAS Visual Analytics because one of my colleagues suggests using the software for the same for our work. As earlier, we use to take a lot of time in analyzing the data but after using the SAS Visual Analytics software our work has improved and time has decreased. It's very helpful for us.