Powerslide vs. Yellowfin

Overview
ProductRatingMost Used ByProduct SummaryStarting Price
Powerslide
Score 9.5 out of 10
N/A
Created in 2019, Powerslide is a data storytelling and data visualization solution. This software helps business users to create usages around data. Powerslide is a solution for data analysis, visualization and presentation. Interactive and collaborative, Powerslide aims to answer data issues in a simple, practical and design interface, and help users simplify the analysis and communication of…N/A
Yellowfin
Score 8.0 out of 10
Mid-Size Companies (51-1,000 employees)
Yellowfin is a cloud-based business intelligence and dashboarding platform.N/A
Pricing
PowerslideYellowfin
Editions & Modules
No answers on this topic
Offerings
Pricing Offerings
PowerslideYellowfin
Free Trial
YesYes
Free/Freemium Version
NoYes
Premium Consulting/Integration Services
NoNo
Entry-level Setup FeeOptionalOptional
Additional DetailsOur rates are flexible and adapt to the size and use of your organization. Contact us and let’s discuss about it.
More Pricing Information
Community Pulse
PowerslideYellowfin
Considered Both Products
Powerslide
Chose Powerslide
Powerslide stands out for having templates that help you easily organize hard data and more delicate information such as numbers and statistics. By having many ways to present and edit it in one place, it makes this a page with variety and empathy with its user.
Yellowfin
Chose Yellowfin
I feel like it is not as good as powerslides, basically does the same thing but not as well. The team basically found that it was using up more time and wasn't as easy to figure out as powerslide. We ended up switching programs after a while and still looking for a much better …
Chose Yellowfin
Alteryx Platform, Microsoft BI (MSBI) and Tableau Desktop
Chose Yellowfin
Tableau Online, Google Analytics and Amazon QuickSight
Chose Yellowfin
Yellow Fin platform is browser agnostic and is accessible from desktops as well as mobile devices. It is very simple and fast, it is integrated with Big Data, clients do not require a great training. It just works. But it’s easier to have things on the cloud, especially if you …
Chose Yellowfin
Yellowfin is much improved over this product, making the process much more simple and faster.
Chose Yellowfin
Yellowfin is no doubt, a stronger, more eloquent and polished tool compared to Microsoft's Power BI. The issue with our company specifically is that we are a big Microsoft shop, and pay for Power BI more or less in our bundle esp w/ O365. While the Yellowfin tool is a more …
Chose Yellowfin
The Yellowfin product technologies are superior and offers more flexibility in application. The Yellowfin product can be used in several different areas such a report engine over and above being a solid business intelligence tool. It further needs significant IT overhead to be …
Chose Yellowfin
We ran a full procurement project to select Yellowfin and started with a long list of over 20 BI products. Key reasons for choice were ease of use, visual looks, product integrations and cost (both licence purchase and development of content).
Chose Yellowfin
Yellowfin BI has a strong focus on a clear structured and easy to use user interface. Furthermore, the licence model was adequate for a BI system with a lot of end users.
Chose Yellowfin
Our reporting group uses Tableau extensively and compared to Yellowfin, Tableau is much easier to use (partially because more time was invested in setting it up properly, but also the design and features).
Chose Yellowfin
My selection of Yellowfin based on following criteria for the Indian market:

  • Availability in Linux platform to process high volume of transaction with CAL (concurrent user access license) model to use multiple server with high concurrent users
Features
PowerslideYellowfin
BI Standard Reporting
Comparison of BI Standard Reporting features of Product A and Product B
Powerslide
8.8
Ratings
5% above category average
Yellowfin
6.1
Ratings
29% below category average
Pixel Perfect reports8.50 Ratings5.80 Ratings
Customizable dashboards9.00 Ratings6.20 Ratings
Report Formatting Templates9.00 Ratings6.40 Ratings
Ad-hoc Reporting
Comparison of Ad-hoc Reporting features of Product A and Product B
Powerslide
9.5
Ratings
17% above category average
Yellowfin
6.6
Ratings
20% below category average
Drill-down analysis9.50 Ratings6.60 Ratings
Report sharing and collaboration9.50 Ratings6.50 Ratings
Formatting capabilities00 Ratings7.10 Ratings
Integration with R or other statistical packages00 Ratings6.30 Ratings
Report Output and Scheduling
Comparison of Report Output and Scheduling features of Product A and Product B
Powerslide
9.2
Ratings
9% above category average
Yellowfin
5.9
Ratings
34% below category average
Publish to Web9.00 Ratings6.30 Ratings
Publish to PDF9.50 Ratings6.20 Ratings
Report Versioning9.00 Ratings5.80 Ratings
Report Delivery Scheduling00 Ratings5.60 Ratings
Delivery to Remote Servers00 Ratings5.50 Ratings
Data Discovery and Visualization
Comparison of Data Discovery and Visualization features of Product A and Product B
Powerslide
9.0
Ratings
10% above category average
Yellowfin
5.8
Ratings
32% below category average
Location Analytics / Geographic Visualization9.00 Ratings5.70 Ratings
Pre-built visualization formats (heatmaps, scatter plots etc.)00 Ratings5.90 Ratings
Predictive Analytics00 Ratings5.80 Ratings
Access Control and Security
Comparison of Access Control and Security features of Product A and Product B
Powerslide
-
Ratings
Yellowfin
6.2
Ratings
31% below category average
Multi-User Support (named login)00 Ratings6.30 Ratings
Role-Based Security Model00 Ratings6.50 Ratings
Multiple Access Permission Levels (Create, Read, Delete)00 Ratings6.30 Ratings
Single Sign-On (SSO)00 Ratings5.90 Ratings
Mobile Capabilities
Comparison of Mobile Capabilities features of Product A and Product B
Powerslide
-
Ratings
Yellowfin
6.7
Ratings
16% below category average
Responsive Design for Web Access00 Ratings6.20 Ratings
Mobile Application00 Ratings6.30 Ratings
Dashboard / Report / Visualization Interactivity on Mobile00 Ratings6.20 Ratings
Application Program Interfaces (APIs) / Embedding
Comparison of Application Program Interfaces (APIs) / Embedding features of Product A and Product B
Powerslide
-
Ratings
Yellowfin
6.1
Ratings
24% below category average
REST API00 Ratings6.10 Ratings
Javascript API00 Ratings5.40 Ratings
iFrames00 Ratings6.00 Ratings
Java API00 Ratings6.30 Ratings
Themeable User Interface (UI)00 Ratings6.50 Ratings
Customizable Platform (Open Source)00 Ratings6.50 Ratings
Best Alternatives
PowerslideYellowfin
Small Businesses
Supermetrics
Supermetrics
Score 10.0 out of 10
BrightGauge
BrightGauge
Score 9.0 out of 10
Medium-sized Companies
Supermetrics
Supermetrics
Score 10.0 out of 10
Reveal
Reveal
Score 10.0 out of 10
Enterprises
Dataiku
Dataiku
Score 7.6 out of 10
Kyvos Semantic Intelligence Layer
Score 9.9 out of 10
All AlternativesView all alternativesView all alternatives
User Ratings
PowerslideYellowfin
Likelihood to Recommend
9.5
(0 ratings)
6.2
(0 ratings)
Usability
-
(0 ratings)
6.3
(0 ratings)
Availability
-
(0 ratings)
9.1
(0 ratings)
Performance
-
(0 ratings)
8.2
(0 ratings)
Support Rating
-
(0 ratings)
5.6
(0 ratings)
In-Person Training
-
(0 ratings)
9.1
(0 ratings)
Online Training
-
(0 ratings)
8.2
(0 ratings)
Implementation Rating
-
(0 ratings)
9.1
(0 ratings)
Configurability
-
(0 ratings)
8.2
(0 ratings)
Ease of integration
-
(0 ratings)
9.1
(0 ratings)
Product Scalability
-
(0 ratings)
8.2
(0 ratings)
Vendor post-sale
-
(0 ratings)
9.1
(0 ratings)
Vendor pre-sale
-
(0 ratings)
9.1
(0 ratings)
User Testimonials
PowerslideYellowfin
Likelihood to Recommend
It provides you with a Beautiful design and layout. Unique dashboards are very helpful. Collaborative functions and useful features are available.
Read full review
We can recommend this software without hesitation, as it has the ability to generate reports and data analysis, as well as process the data automatically, which saves time. It is ideal for small and medium-sized companies that wish to improve their services in the business world
Read full review
Pros
  • Collaborative fractures helped a lot.
  • Dashboards are really unique.
Read full review
  • The Yellowfin user interface fits seamlessly into our own web software as it too is designed in the latest web technologies making it easy to use and easily accessible to our client base.
  • The Yellowfin user interface is intuitive and easy to use, elevating VSV clients from needing in-depth training on the product before true value can be realised.
  • The Yellowfin architecture supports the Pintl architecture 100% due to a similar design strategy and as such no real overhead is added to the Pintl system for the addition of the Yellowfin product nor does it add any additional IT overhead to be used.
  • The Yellowfin product is quick and simple to develop reports and dashboards in cutting turn-around-time at the VSV development team and when new/custom reports are required by VSV clients.
Read full review
Cons
  • Increase the variety of fonts
  • Make templates less serious or business
Read full review
  • The ability to predefine a colour for a specific graph as a selection option dynamically.
  • The ability to customise the label of a chart, especially with respect to performance related reporting graphs we need an increase in dynamic charting options to meet our more specialised requirements.
Read full review
Usability
No answers on this topic
Yellowfin has large promises that did not meet our expectations after we got it installed. We tried to configure it but things did not go as planned. After 1 year of trying - we still cannot get it working. Be very careful when signing up with them - everything is not what it seems.
Read full review
Reliability and Availability
No answers on this topic
99.9% availability
Read full review
Support Rating
No answers on this topic
Anytime I needed a report, I ran into issues with this software. We used Yellowfin for a period of months, having switched from Salesforce. I found the reports were difficult to produce, and the data management was okay at best.
Read full review
In-Person Training
No answers on this topic
Yellowfin provides 3 levels of training to support consumers, business analytics, developers and Administrations :
  1. Yellowfin BI Training - Level 1 (Exploration)
  2. Yellowfin BI Training - Level 2 (Advanced)
  3. Yellowfin BI Training - Level 3(Expert)
Read full review
Online Training
No answers on this topic
Web-based training for large audiences for Level 1 and Level 2 I would suggest
Read full review
Implementation Rating
No answers on this topic
Design the data model and views for each dashboard is very important and it is the success factor Configuration of cluster for large implementation
Read full review
Alternatives Considered
Powerslide stands out for having templates that help you easily organize hard data and more delicate information such as numbers and statistics. By having many ways to present and edit it in one place, it makes this a page with variety and empathy with its user.
Read full review
Yellowfin is no doubt, a stronger, more eloquent and polished tool compared to Microsoft's Power BI. The issue with our company specifically is that we are a big Microsoft shop, and pay for Power BI more or less in our bundle esp w/ O365. While the Yellowfin tool is a more sleek tool, the cost to our company is something that we have to weight against a negligible cost with Power BI.
Read full review
Scalability
No answers on this topic
- Tested 500 con-current users in Linux platform with 4 cores systems - Tested with cloud based VM - Tested with 1000 reads per minutes
Read full review
Return on Investment
  • Our collaborators do not get bored in meetings and even if it is a lot of information, seeing it in an interesting design makes them pay attention and like to be informed of the numbers they manage to obtain with their work.

Read full review
  • made our org more data centric
  • Decisions are made based on data vs opinion
  • has created a single source of truth for the bulk of the organization
Read full review
ScreenShots

Powerslide Screenshots

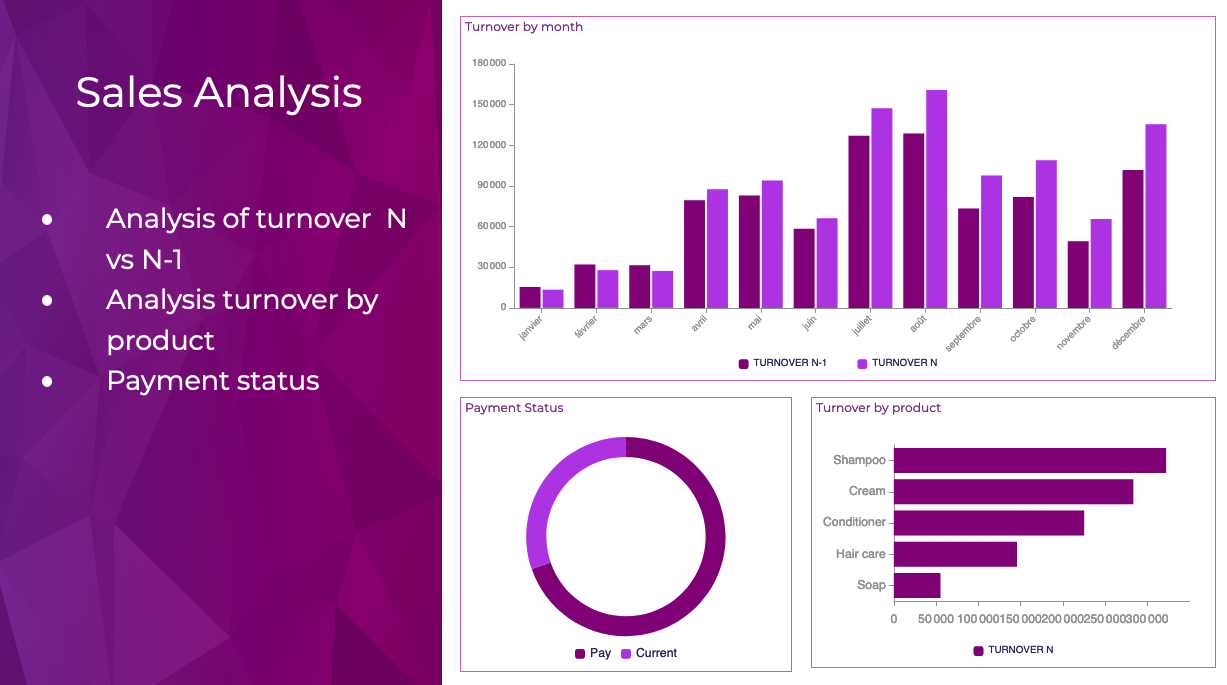
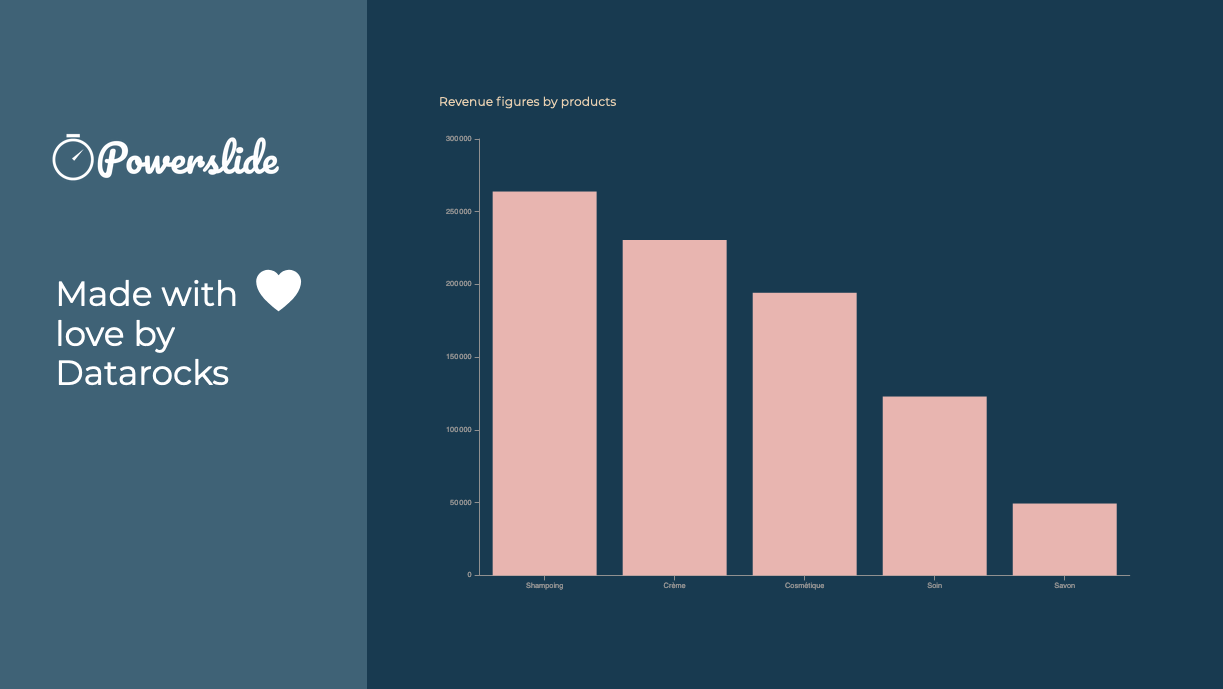
Screenshot of Reporting and dashboards have never been easier to achieve. Interactive, Powerslide takes you to the heart of your data and helps you take better decisions. Simple to use, you can build your graphics in seconds with drag-and-drop and let our suggestion algorithms guide you.Screenshot of Powerslide complies to your graphic chart. Define your color palette and Powerslide takes care of the rest.Screenshot of Powerslide is THE solution provided with love by DatarocksScreenshot of Take advantage of real-time collaboration to work as a team on the same project. Time-saving and flexibility await you !

Yellowfin Screenshots

Screenshot of Location IntelligenceScreenshot of Yellowfin DashboardScreenshot of Yellowfin SignalsScreenshot of Yellowfin MobileScreenshot of Yellowfin Sales KPIs