Qlik Analytics Platform vs. Toucan
Qlik Analytics Platform vs. Toucan
| Product | Rating | Most Used By | Product Summary | Starting Price |
|---|---|---|---|---|
 Qlik Analytics Platform | N/A | The Qlik Analytics Platform (QAP) is a developer platform for building custom analytic applications based on rich frontend and backend APIs. It gives full API access to the Qlik associative engine to build rich data-driven analytic applications, for example when building web applications for extranet and Internet deployment. | N/A | |
 Toucan | N/A | Toucan Toco, from the company of the same name headquartered in France, is an embedded BI solution that communicates contextualised and actionable insights to untrained business users, no matter their data literacy levels or device used, and without the need for training, coding or design skills, or hardware requirements. | N/A |
| Qlik Analytics Platform | Toucan | |||||||||||||||
|---|---|---|---|---|---|---|---|---|---|---|---|---|---|---|---|---|
| Editions & Modules | No answers on this topic | No answers on this topic | ||||||||||||||
| Offerings |
| |||||||||||||||
| Entry-level Setup Fee | No setup fee | Optional | ||||||||||||||
| Additional Details | — | — | ||||||||||||||
| More Pricing Information | ||||||||||||||||
| Qlik Analytics Platform | Toucan |
|---|
| Qlik Analytics Platform | Toucan | |
|---|---|---|
| Likelihood to Recommend | 8.6 (0 ratings) | 7.0 (0 ratings) |
| Support Rating | 8.0 (0 ratings) | 10.0 (0 ratings) |
| Qlik Analytics Platform | Toucan | |
|---|---|---|
| Likelihood to Recommend |
 Peter Nyffels Digital Community Content Manager | 
 Kathleen Paluso Director, Customer Success & Implementation |
| Pros |
|
Kathleen Paluso Director, Customer Success & Implementation |
| Cons |
Peter Nyffels Digital Community Content Manager |
Kathleen Paluso Director, Customer Success & Implementation |
| Support Rating |
|
Kathleen Paluso Director, Customer Success & Implementation |
| Alternatives Considered |
| No answers on this topic |
| Return on Investment |
 Filippo Orlando Advanced Analytics Manager |
Kathleen Paluso Director, Customer Success & Implementation |
| ScreenShots | Toucan Screenshots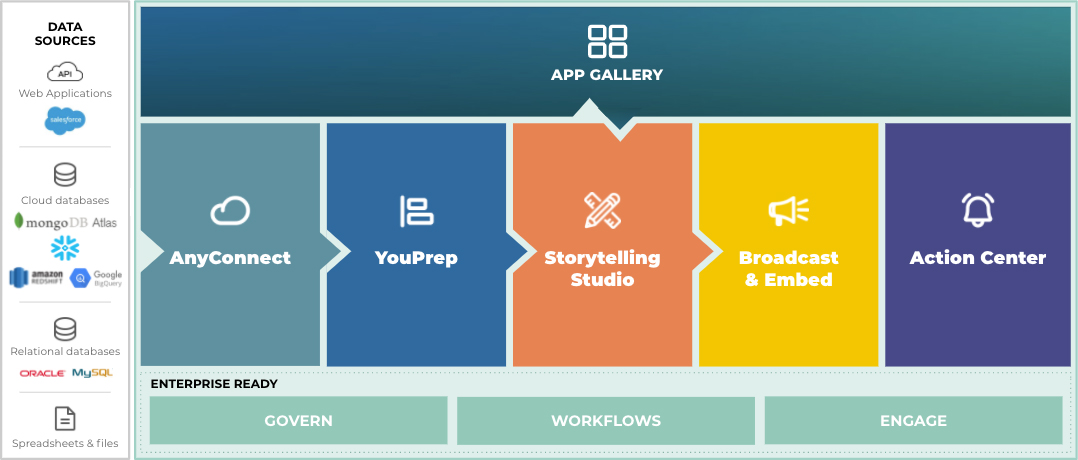   |