The Qlik Analytics Platform (QAP) is a developer platform for building custom analytic applications based on rich frontend and backend APIs. It gives full API access to the Qlik associative engine to build rich data-driven analytic applications, for example when building web applications for extranet and Internet deployment.
N/A
Rational BI
Score 7.7 out of 10
Enterprise companies (1,001+ employees)
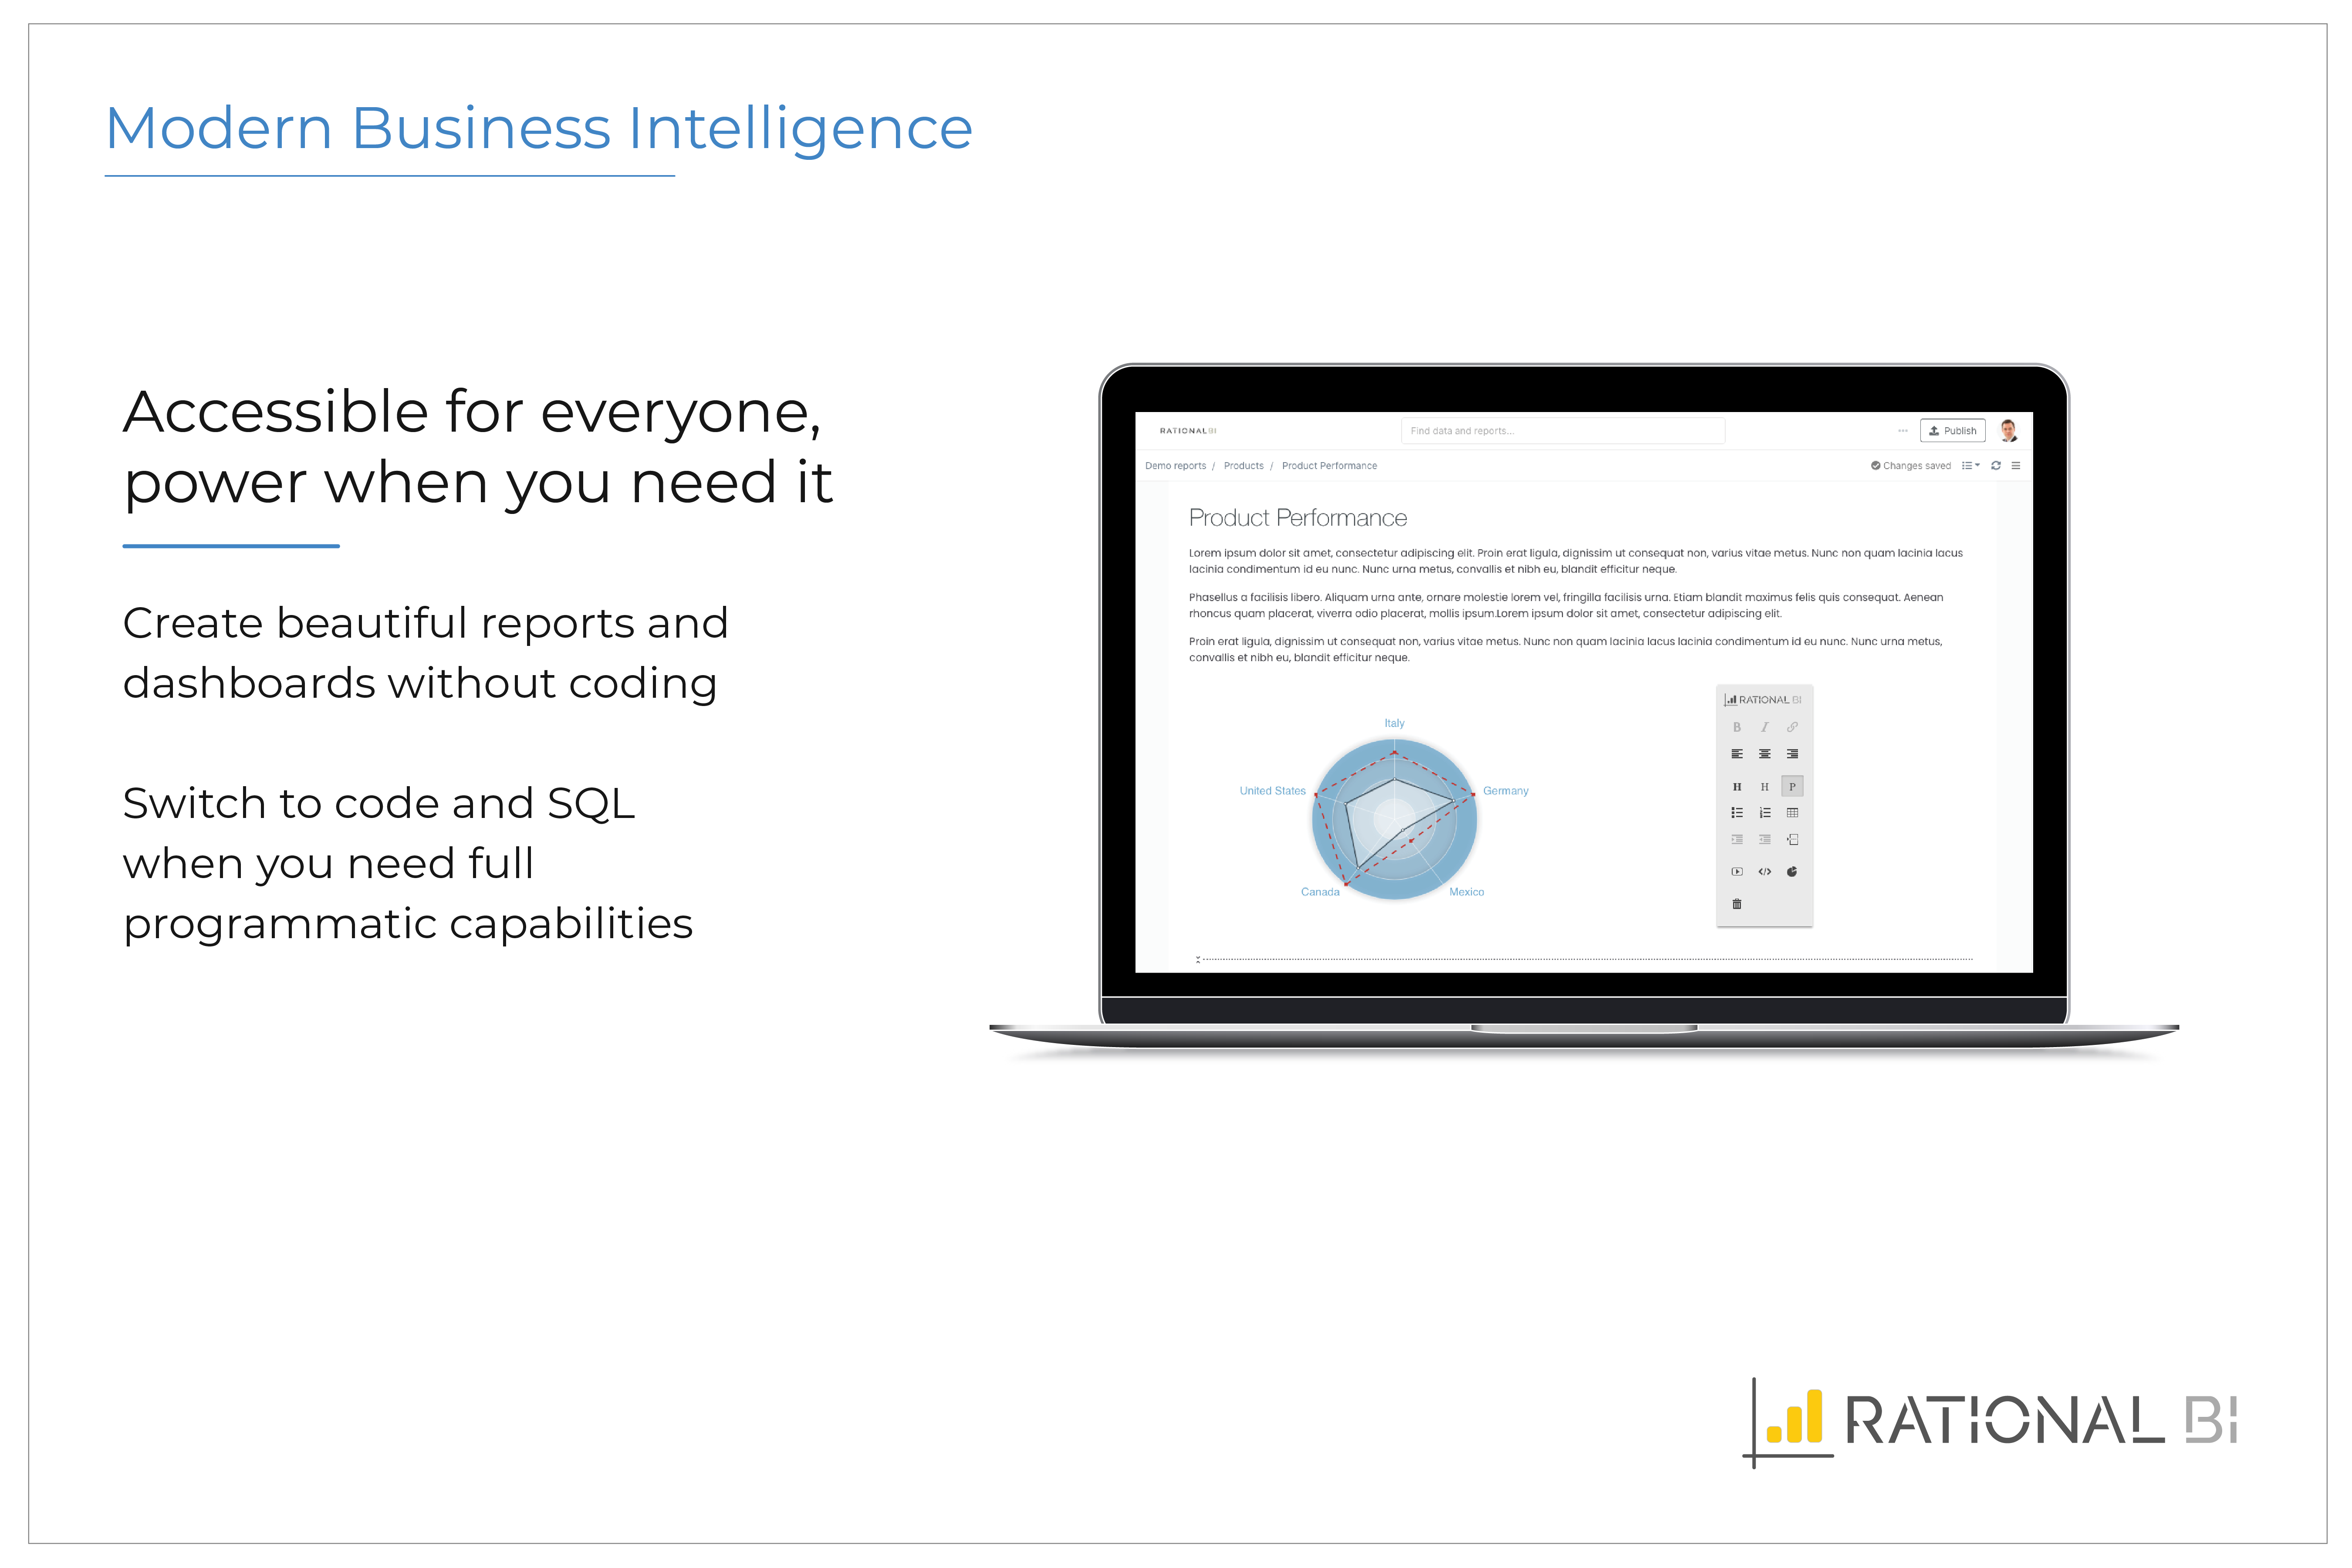
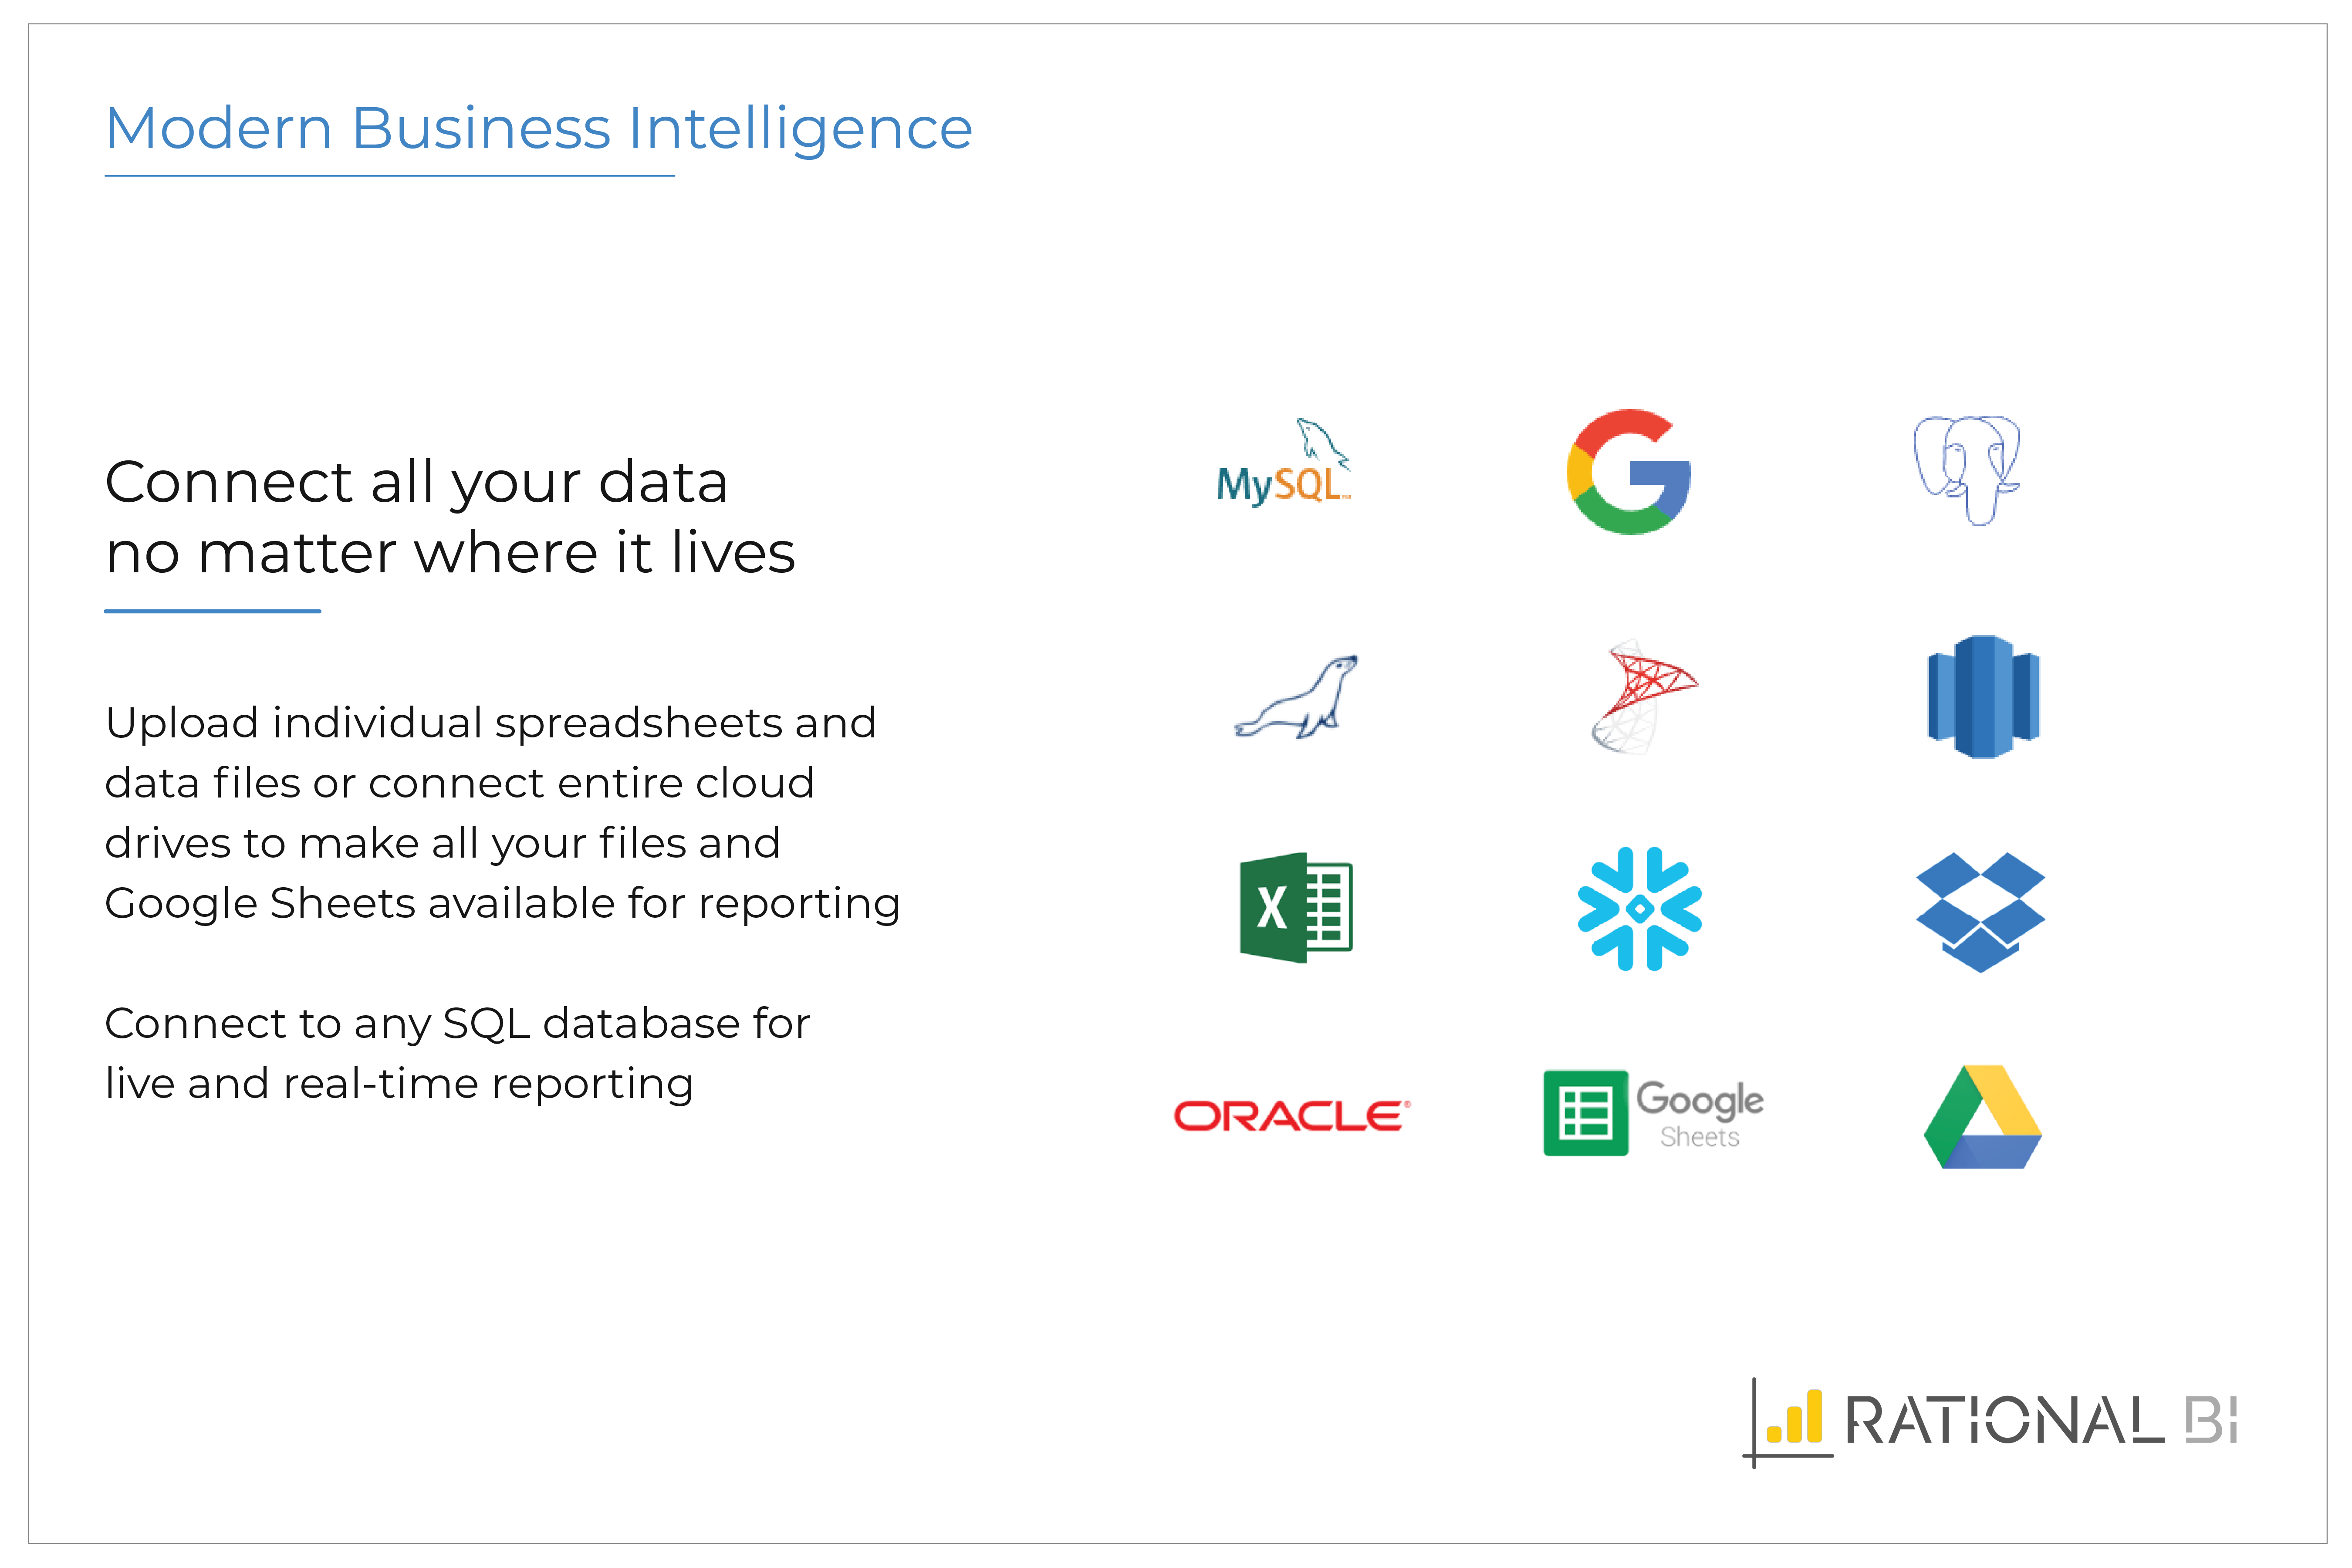
Rational BI provides analytics, data science and business intelligence in an analytical platform that connects to databases, data files and cloud drives including AWS and Azure data sources, enabling users to explore and visualize data. Users can build real-time notebook-style reports directly in a web browser with JavaScript and SQL with direct and live connections to data. Filter and query data with an SQL database embedded in the client, without network…
$0
single user
Pricing
Qlik Analytics Platform
Rational BI
Editions & Modules
No answers on this topic
Free
$0
single user
Professional
$129
single user
Enterprise
Varies
single user
Offerings
Pricing Offerings
Qlik Analytics Platform
Rational BI
Free Trial
No
Yes
Free/Freemium Version
No
Yes
Premium Consulting/Integration Services
No
No
Entry-level Setup Fee
No setup fee
Optional
Additional Details
—
Additional cost per extra user (varies by edition)
More Pricing Information
Community Pulse
Qlik Analytics Platform
Rational BI
Features
Qlik Analytics Platform
Rational BI
BI Standard Reporting
Comparison of BI Standard Reporting features of Product A and Product B
Qlik Analytics Platform
-
Ratings
Rational BI
8.3
Ratings
1% below category average
Pixel Perfect reports
00 Ratings
7.60 Ratings
Customizable dashboards
00 Ratings
8.70 Ratings
Report Formatting Templates
00 Ratings
8.50 Ratings
Ad-hoc Reporting
Comparison of Ad-hoc Reporting features of Product A and Product B
Qlik Analytics Platform
-
Ratings
Rational BI
8.3
Ratings
4% above category average
Drill-down analysis
00 Ratings
7.70 Ratings
Formatting capabilities
00 Ratings
8.20 Ratings
Integration with R or other statistical packages
00 Ratings
8.00 Ratings
Report sharing and collaboration
00 Ratings
9.20 Ratings
Report Output and Scheduling
Comparison of Report Output and Scheduling features of Product A and Product B
Qlik Analytics Platform
-
Ratings
Rational BI
9.0
Ratings
6% above category average
Publish to Web
00 Ratings
9.00 Ratings
Publish to PDF
00 Ratings
9.00 Ratings
Report Versioning
00 Ratings
8.60 Ratings
Report Delivery Scheduling
00 Ratings
9.20 Ratings
Delivery to Remote Servers
00 Ratings
9.30 Ratings
Data Discovery and Visualization
Comparison of Data Discovery and Visualization features of Product A and Product B
If you want to setup analytics dashboards for reporting or simple data analysis then Qlik is your tool of choice.
Complex data structures are handled well, but you’ll need to keep de amount of data on the low side. Integration with other software is possible and easy.
Rational BI allows managing data analysis coming from different projects in order to create useful reports and dashboards. I usually set up automatically scheduled reports. All the stakeholders can easily share a rational view with the possibility to filter between the interesting arguments. Sometimes different user profiles could be needed, optimize the view.
It's flexible in allowing the development of fully-fledged analysis tools and dashboards, but also smaller "widgets" to embed in our websites to bring stories to life, and enables us to develop things once and then re-use them in different contexts.
The development platform and management console are both easy to use, and, with proper data development by our expert developers, can be used by relatively junior colleagues to produce great-looking and very useful products.
The way the platform handles a mix of data sources from different APIs and internal data stores is good.
We like the visualizations and from a corporate perspective find it easy to develop one-size-fits-all visualizations that present a wide range of data items well in a responsive way.
Documentation for new users could be better. Sometimes it's hard for my users that are not that skilled in IS/IT to set up data connectors are understand the dynamics of data sources.
I have used several other BI solutions as well, and their GUI is okay, but surely there is also room for improvement here. Not all things are made entirely logically.
Understanding their price structure. Generally, their website looks nice, but it's not very informative when it comes to pricing, and support options. I really miss some kind of transparency and overview.
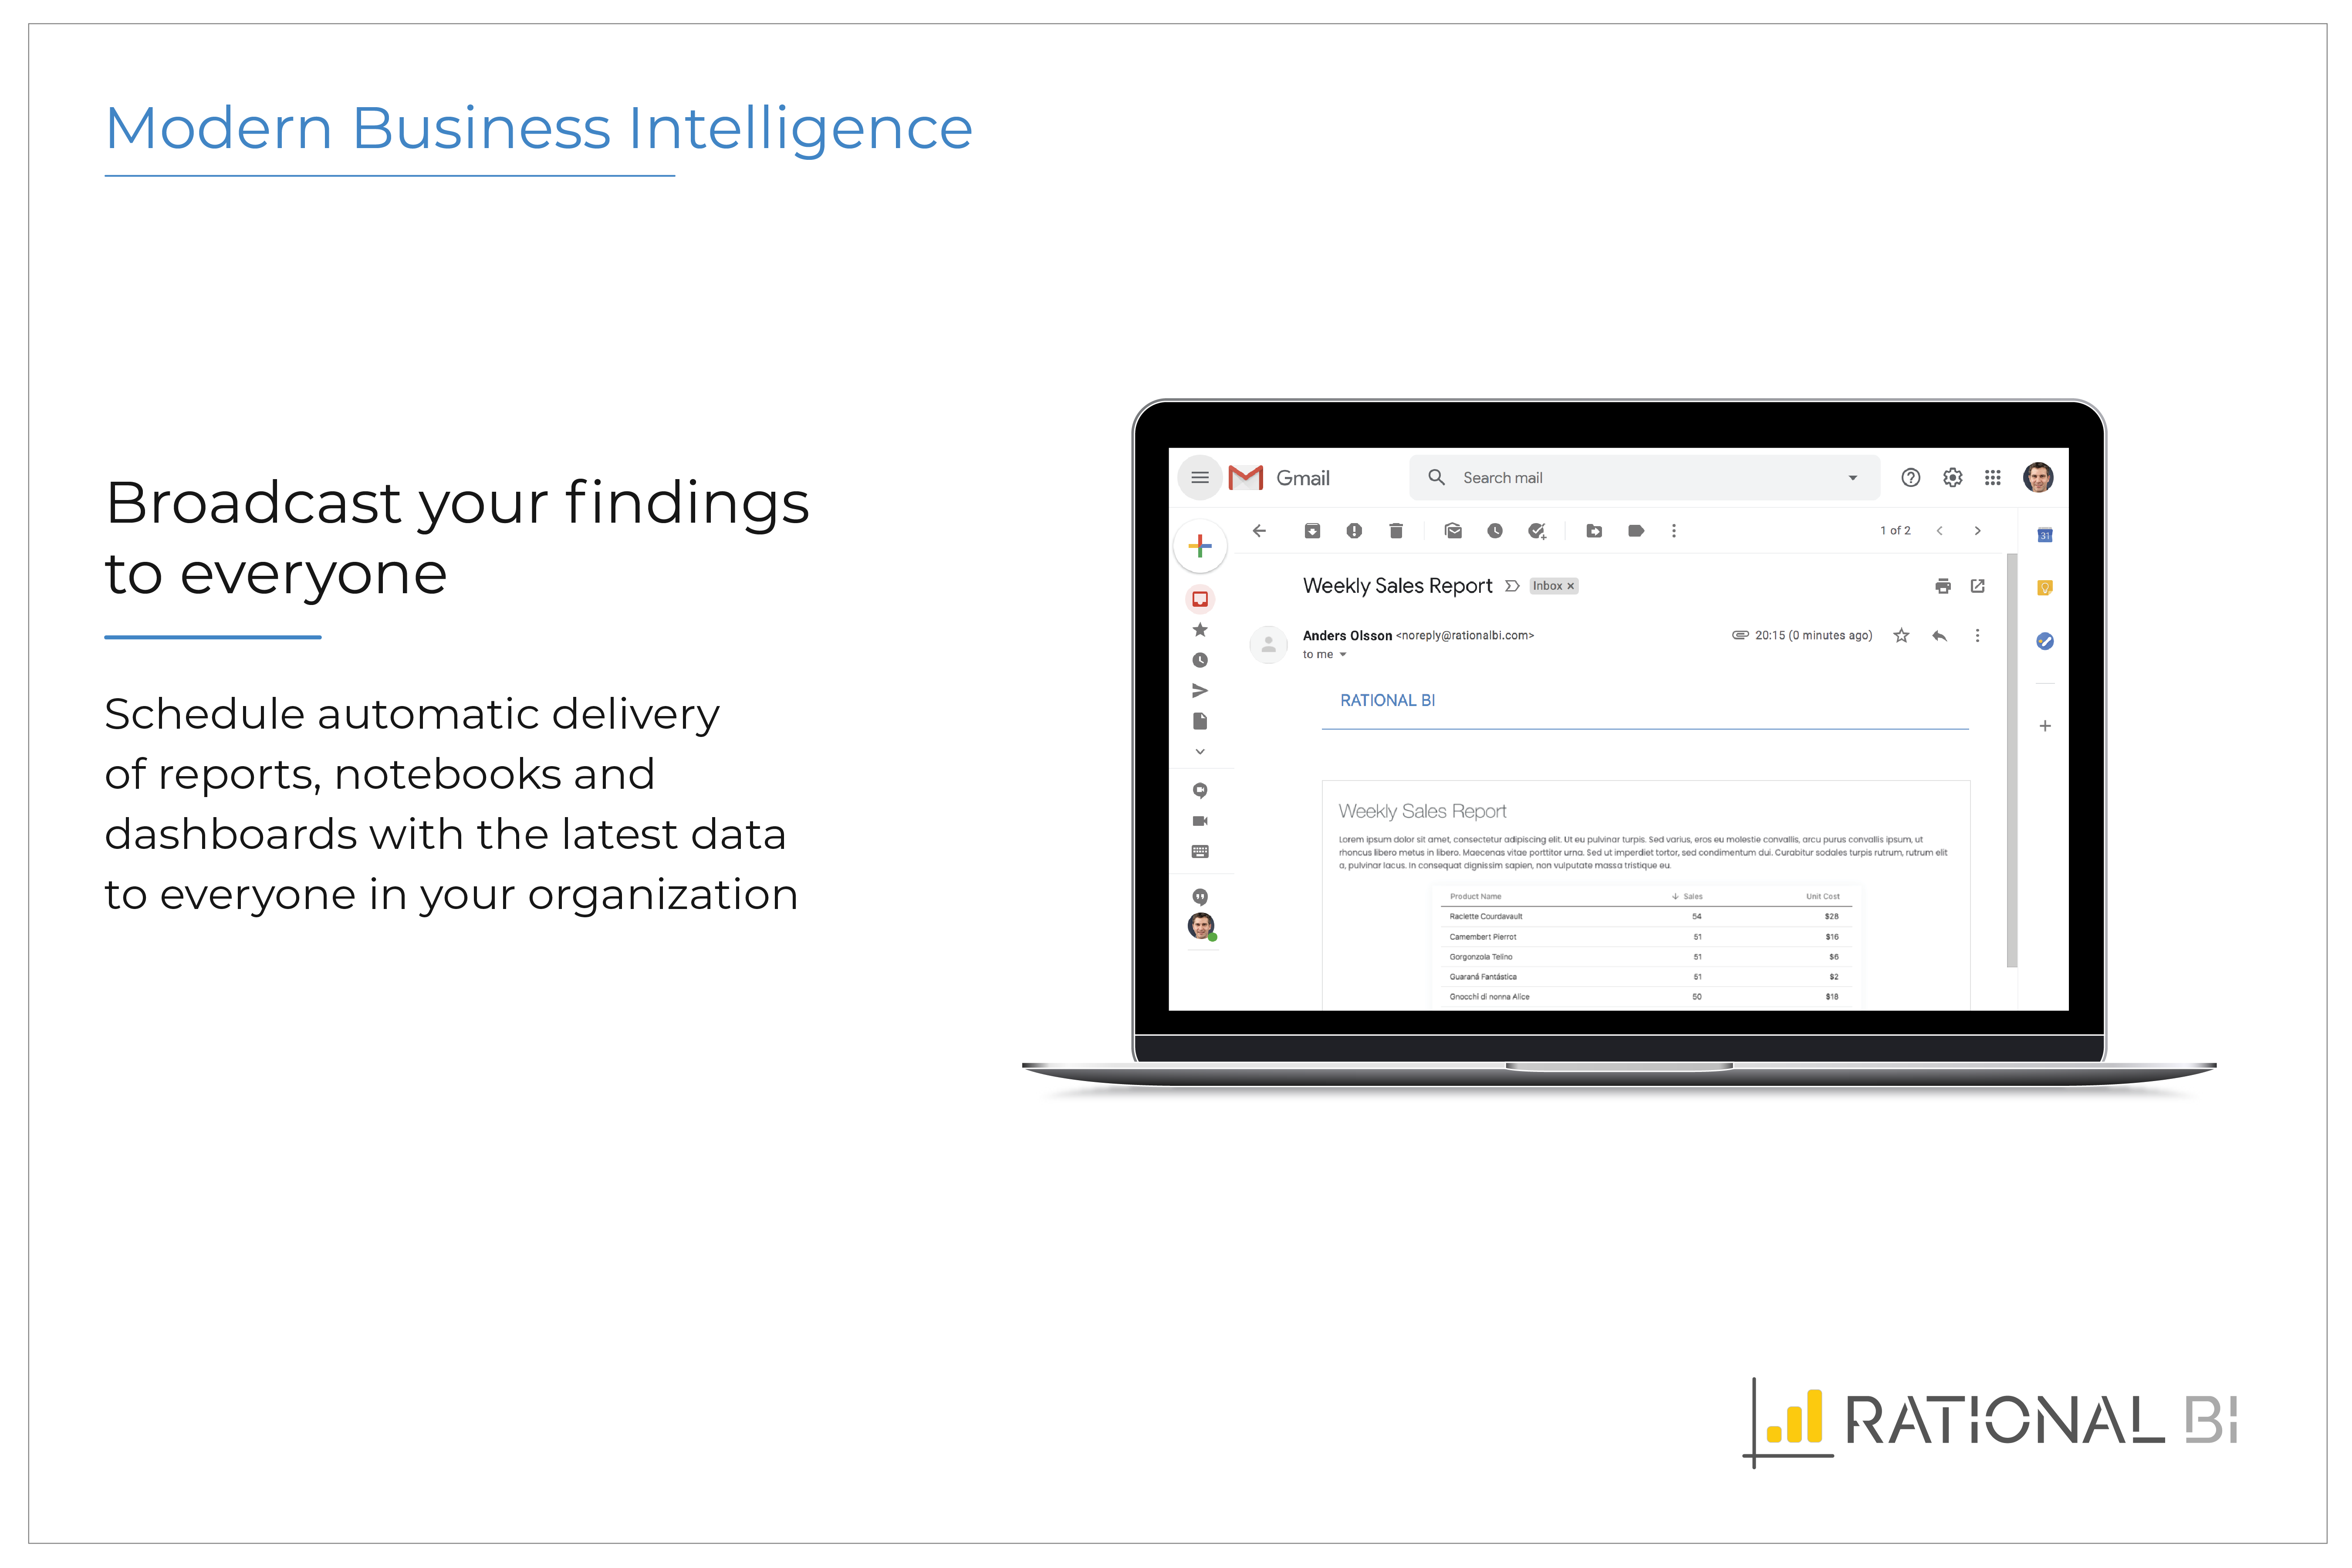
Rational BI allows managing data analysis coming from different projects. The outputs are one or more reports, that can be delivered automatically to the stakeholders or other communication media inside the organization. Nice dashboards help to describe and analyze data. Sometimes different user profiles could be needed, optimize the view.
Qlik is great for companies with lots of business domains and departments because it scales well, especially if data that is reported is saved in SQL and similar structures. Its ease of use and good UI enables business units to create and manage their own reports. That removes a great burden of creating and managing/modifying these pages from the IT team. Overall, it's a win-win for both IT and business units.
They are all good tools, each having their own pros and cons. Qlik Analytics Platform was easy to set up, more than affordable, and has a good user base. Though not as large as some of the other tools, it is growing every day and for the price, it is very hard to beat. I would recommend it. Microsoft Power BI is a little more intuitive to some users, many of them engineers, because of its similarities to Excel. I do like that it follows a similar structure to Excel but I think that it also has the same old-school GUI, which could be improved on. I prefer the way Qlik Analytics Platform's visualizations look because they appear more modern and smooth rather than rigid.
Today there are many companies providing BI solutions, and generally, I think Microsoft Power BI is the easiest go-to solution as it is part of the Office365 software. However all software solutions have their limitations, advantages, and disadvantages, but sometimes you don't need the perfect solution. You just need a solution that delivers 80-90 percent of the full potential to reach your goal and in this scope, we were really happy with Rational BI.