Chose QlikView
We use Qlik Sense to feed QlikView reports.

| Product | Rating | Most Used By | Product Summary | Starting Price |
|---|---|---|---|---|
 QlikView | N/A | QlikView® is Qlik®’s original BI offering designed primarily for shared business intelligence reports and data visualizations. It offers guided exploration and discovery, collaborative analytics for sharing insight, and agile development and deployment. | N/A | |
 SAP Lumira Discovery | N/A | SAP Lumira Discovery is SAP’s data visualization and discovery application. It facilitates data discovery, visualization, and analysis by assisting users with creation of dashboards, infographics, presentations, data facets, tag clouds, and more. | $185 per user |
| QlikView | SAP Lumira Discovery | |||||||||||||||
|---|---|---|---|---|---|---|---|---|---|---|---|---|---|---|---|---|
| Editions & Modules |
|
| ||||||||||||||
| Offerings |
| |||||||||||||||
| Entry-level Setup Fee | Optional | No setup fee | ||||||||||||||
| Additional Details | On an perpetual license basis, based on server plus number of users. Contact vendor for pricing. | — | ||||||||||||||
| More Pricing Information | ||||||||||||||||
| QlikView | SAP Lumira Discovery | |
|---|---|---|
| Considered Both Products |  QlikView  Mark McHenry Marketing Chose QlikView QlikView, Tableau, and SiSense are all very good BI tools for analysis and reporting. Tableau was better at intuitively matching fields of disparate data and more visually appealing, but I think QlikView is faster. Tableau was also easier for someone to use to build and …  Gabriel Krahn ECM Consultant Chose QlikView QlikView was a customer requirement, so we did not evaluate any other product with these functionalities. It was the only option presented to us.  Guillermo Villamizar Account Manager Chose QlikView There are more than 1700 partners in the world that could implement a QlikView solution, and these associates tend to have a long and close relationship with the customer, and ultimately lead up to understanding the customer's needs at 100%. Also, the software is very scalable …  Nestor Ramirez Strategic Technical Director Chose QlikView Qlik was less intuitive than Paxata, but less expensive than either MicroStrategy or PowerBI. Qlik has enough breadth to accommodate most use cases without breaking the bank.  Jason Xiao Senior Analyst, Fraud Data Science & Analytics Chose QlikView QlikView is cost-efficient and has a free desktop version to try out the different functions of it before you make the purchase decision.  Joshua Pekar HRIS Manager Chose QlikView My use of Cognos was as an embedded BI tool inside of a cloud HCM. At the time, you could not marry up data from other external sources with that version. QlikView makes it easy to connect data from multiple sources. As a BI tool I do prefer the Cognos set up, but that's more …  Gurcan Orhan Data Quality Management Software Development Manager Chose QlikView QlikView was already chosen and implemented before I started [to work here], but it is very easy to learn (for me) and I started to solve problems within a day or two.  Tim Dorscher Product Specialist - Walls Product Line Management Chose QlikView While I may have to export the data, I was doing so anyway to get it into excel to drive better visualizations of the data. When I discovered PowerBI and all it had available I no longer had a need for QlikView.  Yemsi Pino Planificador Territorial II Chose QlikView The first thing we liked about QlikView was the price. For a small amount per user, I can have a very useful software to manage the whole data set our company uses. The Tableau desktop has very high pricing for the software, and for just one user, not the whole organization. …  Andrew Khonje Financial Analyst Chose QlikView Qlikview is more outdated compared to Qlik Sense. Qlik Sense puts more of the power onto the users to create their own dashboards while QlikView tends to be managed by BI teams. | SAP Lumira Discovery  Pritama Kundu Manager - Business Integrator Chose SAP Lumira Discovery Wanted to have overall SAP platflorm  Arkadip Kundu Doing a BootCamp Chose SAP Lumira Discovery I stack up against 360 dialog Whatsapp Business API tools as it has very weak internet connection and it cannot store data and sometimes in WhattsApp BI tools the searching, connecting, acquiring, and merging data is becoming difficult. I choose SAP Lumiera Discovery as the …  Trever Voit TPS Chose SAP Lumira Discovery Lumira offered more in depth visualization for reporting and presentation, this tool took some time to learn the ins and outs to but after training this was a pretty straightforward data display software tool that was very helpful showing data searched and narrowed down to …  Himanshu Singh Product Manager Chose SAP Lumira Discovery SAP Lumira is mainly for non technical persons. When one is not into much data and doesn't want to dig dip into data models and algorithms, it is very handy. But, if you are dealing with lots of data with huge variety and volume you should consider the alternatives, as the …  Andrew Griffin SAP CRM and CEC Consultant Chose SAP Lumira Discovery Compared with the built-in Cloud for Customer reporting suite, Lumira was quicker at processing figures and provides a greater range of reporting visualisations, as well as being much more user friendly for non-technical end users to pick up and use with minimal direction. …  Leonardo Hernandez SAP Consultant Chose SAP Lumira Discovery we choose SAP Lumira because comes from SAP and we trust in the quality of their products, also we saw a very potetial tool for out clients to explore their data and add value to their erp implementation  Parimelalagan Kumaraguru -Pari- SAP BI Consultant Chose SAP Lumira Discovery For a full featured SAP environment, Lumira is the suitable platform for a BW, Hana, ECC universe or third party DB universe sourced reporting compared to all of the other analytical platforms.  Frédérick Samson Software Architect Chose SAP Lumira Discovery - Power BI has more features (like ETL) and more integration. Power BI Desktop is free. - Tableau has better visual and better interactivity. Tableau is expensive. - SAP Lumira is affordable as long as you don't need the Web Portal.  Avishek Chakraborty Solutions Architect Chose SAP Lumira Discovery Easy to use, one time license cost, close integration with BI/BO, custom user story for case based data presentation.  Kuldeep Vaishnav SAP B1 Functional Consultant Chose SAP Lumira Discovery In India, users are already using this product and have got adapted to it. It's tough because it is not as beneficial as Lumira, but to bring a change in an Indian company is hard to implement. |
| QlikView | SAP Lumira Discovery | |||||||||||||||
|---|---|---|---|---|---|---|---|---|---|---|---|---|---|---|---|---|
| BI Standard Reporting |
| |||||||||||||||
| Ad-hoc Reporting |
| |||||||||||||||
| Report Output and Scheduling |
| |||||||||||||||
| Data Discovery and Visualization |
| |||||||||||||||
| Access Control and Security |
| |||||||||||||||
| Mobile Capabilities |
|
| QlikView | SAP Lumira Discovery | |
|---|---|---|
| Small Businesses |  BrightGauge Score 9.1 out of 10 | BrightGauge Score 9.1 out of 10 |
| Medium-sized Companies |  Reveal Score 10.0 out of 10 | Reveal Score 10.0 out of 10 |
| Enterprises |  Kyvos Semantic Intelligence Layer Score 9.9 out of 10 | Kyvos Semantic Intelligence Layer Score 9.9 out of 10 |
| All Alternatives | View all alternatives | View all alternatives |
| QlikView | SAP Lumira Discovery | |
|---|---|---|
| Likelihood to Recommend | 7.3 (0 ratings) | 5.0 (0 ratings) |
| Likelihood to Renew | 8.8 (0 ratings) | - (0 ratings) |
| Usability | 8.2 (0 ratings) | 8.0 (0 ratings) |
| Availability | 9.8 (0 ratings) | 9.0 (0 ratings) |
| Performance | 8.6 (0 ratings) | 7.0 (0 ratings) |
| Support Rating | 3.3 (0 ratings) | 7.0 (0 ratings) |
| In-Person Training | - (0 ratings) | 6.0 (0 ratings) |
| Online Training | 8.0 (0 ratings) | 6.0 (0 ratings) |
| Implementation Rating | 7.4 (0 ratings) | 10.0 (0 ratings) |
| Configurability | - (0 ratings) | 2.0 (0 ratings) |
| Ease of integration | - (0 ratings) | 5.0 (0 ratings) |
| Product Scalability | 8.9 (0 ratings) | 6.0 (0 ratings) |
| Vendor post-sale | - (0 ratings) | 8.0 (0 ratings) |
| Vendor pre-sale | - (0 ratings) | 8.0 (0 ratings) |
| QlikView | SAP Lumira Discovery | |
|---|---|---|
| Likelihood to Recommend |
|
|
| Pros |
 Jake Tolbert Director of Development - Data Services |
|
| Cons |
|
Andrew Griffin SAP CRM and CEC Consultant |
| Likelihood to Renew |
 Debbie Pyykkonen, MBA Director of Business Analytics |
Pritama Kundu Manager - Business Integrator |
| Usability |
|
|
| Reliability and Availability |
 Oleg Troyansky President |
 Ravi Ada Founder + CTO |
| Performance |
 Raymond Younan Senior Database Administrator and Integrator |
Ravi Ada Founder + CTO |
| Support Rating |
|
|
| In-Person Training |
|
Ravi Ada Founder + CTO |
| Online Training |
 Robert Goodman Director, Business Intelligence & Analytics |
Ravi Ada Founder + CTO |
| Implementation Rating |
|
Ravi Ada Founder + CTO |
| Alternatives Considered |
|
|
| Scalability | No answers on this topic |
Ravi Ada Founder + CTO |
| Return on Investment |
|
 Rehan Kanuga Data Analyst |
| ScreenShots | QlikView Screenshots 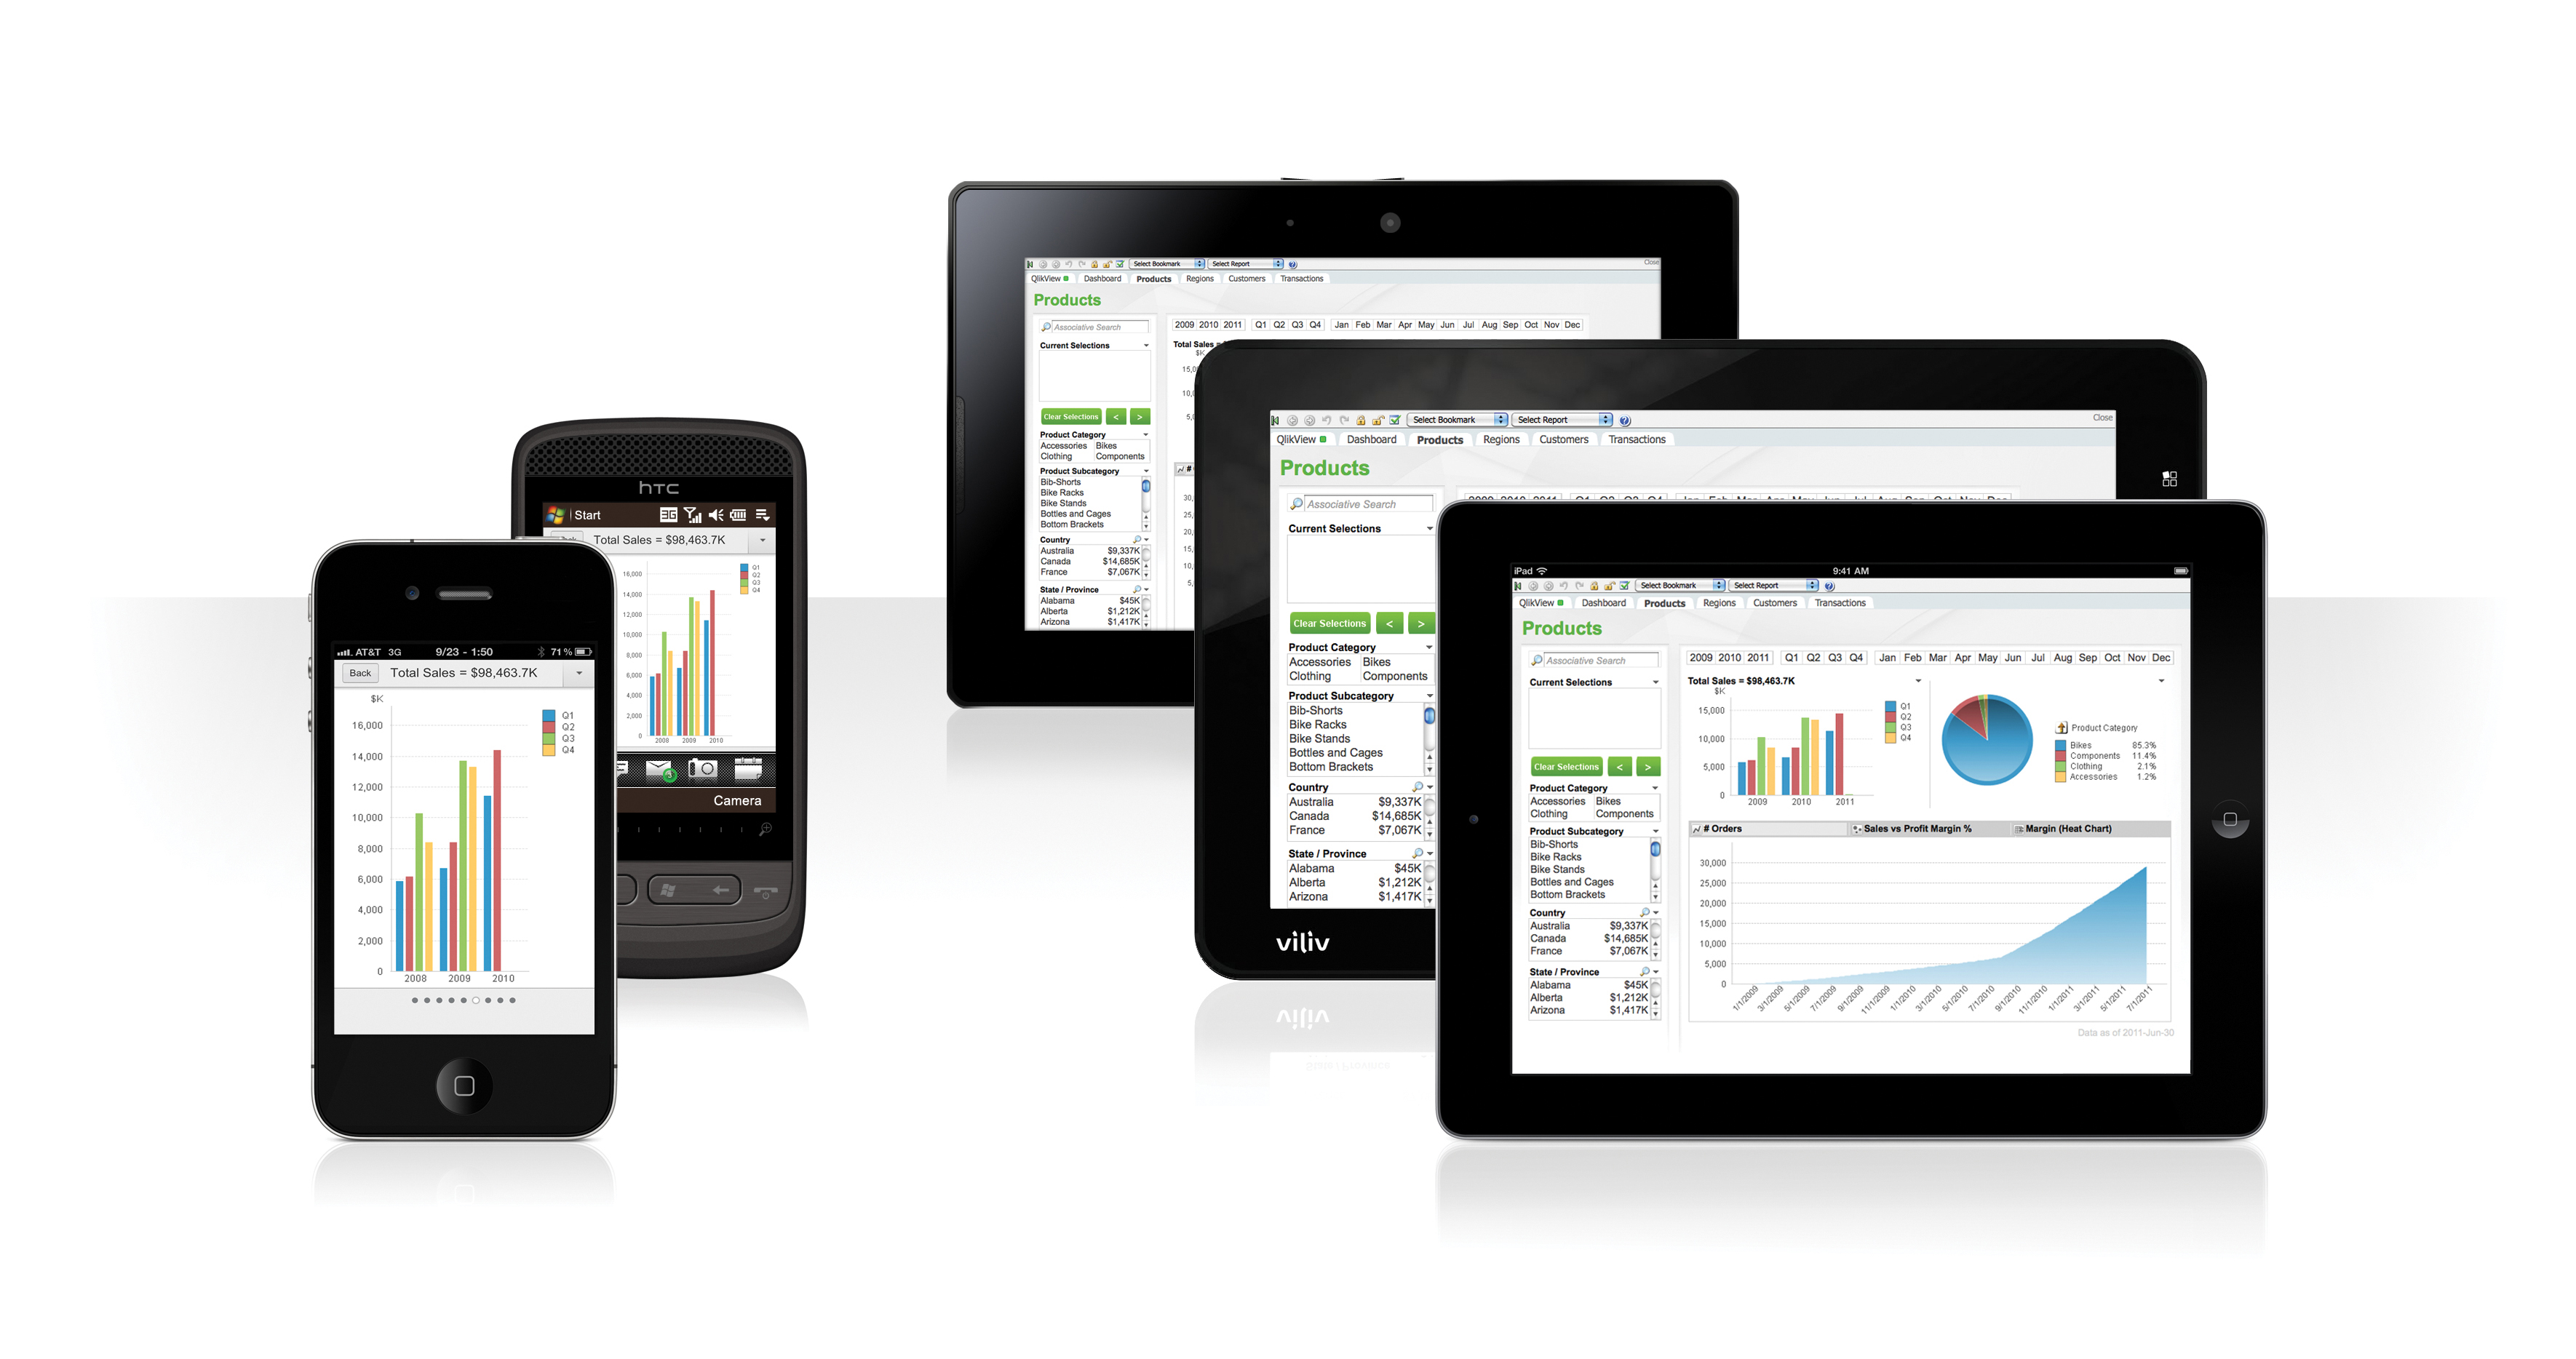 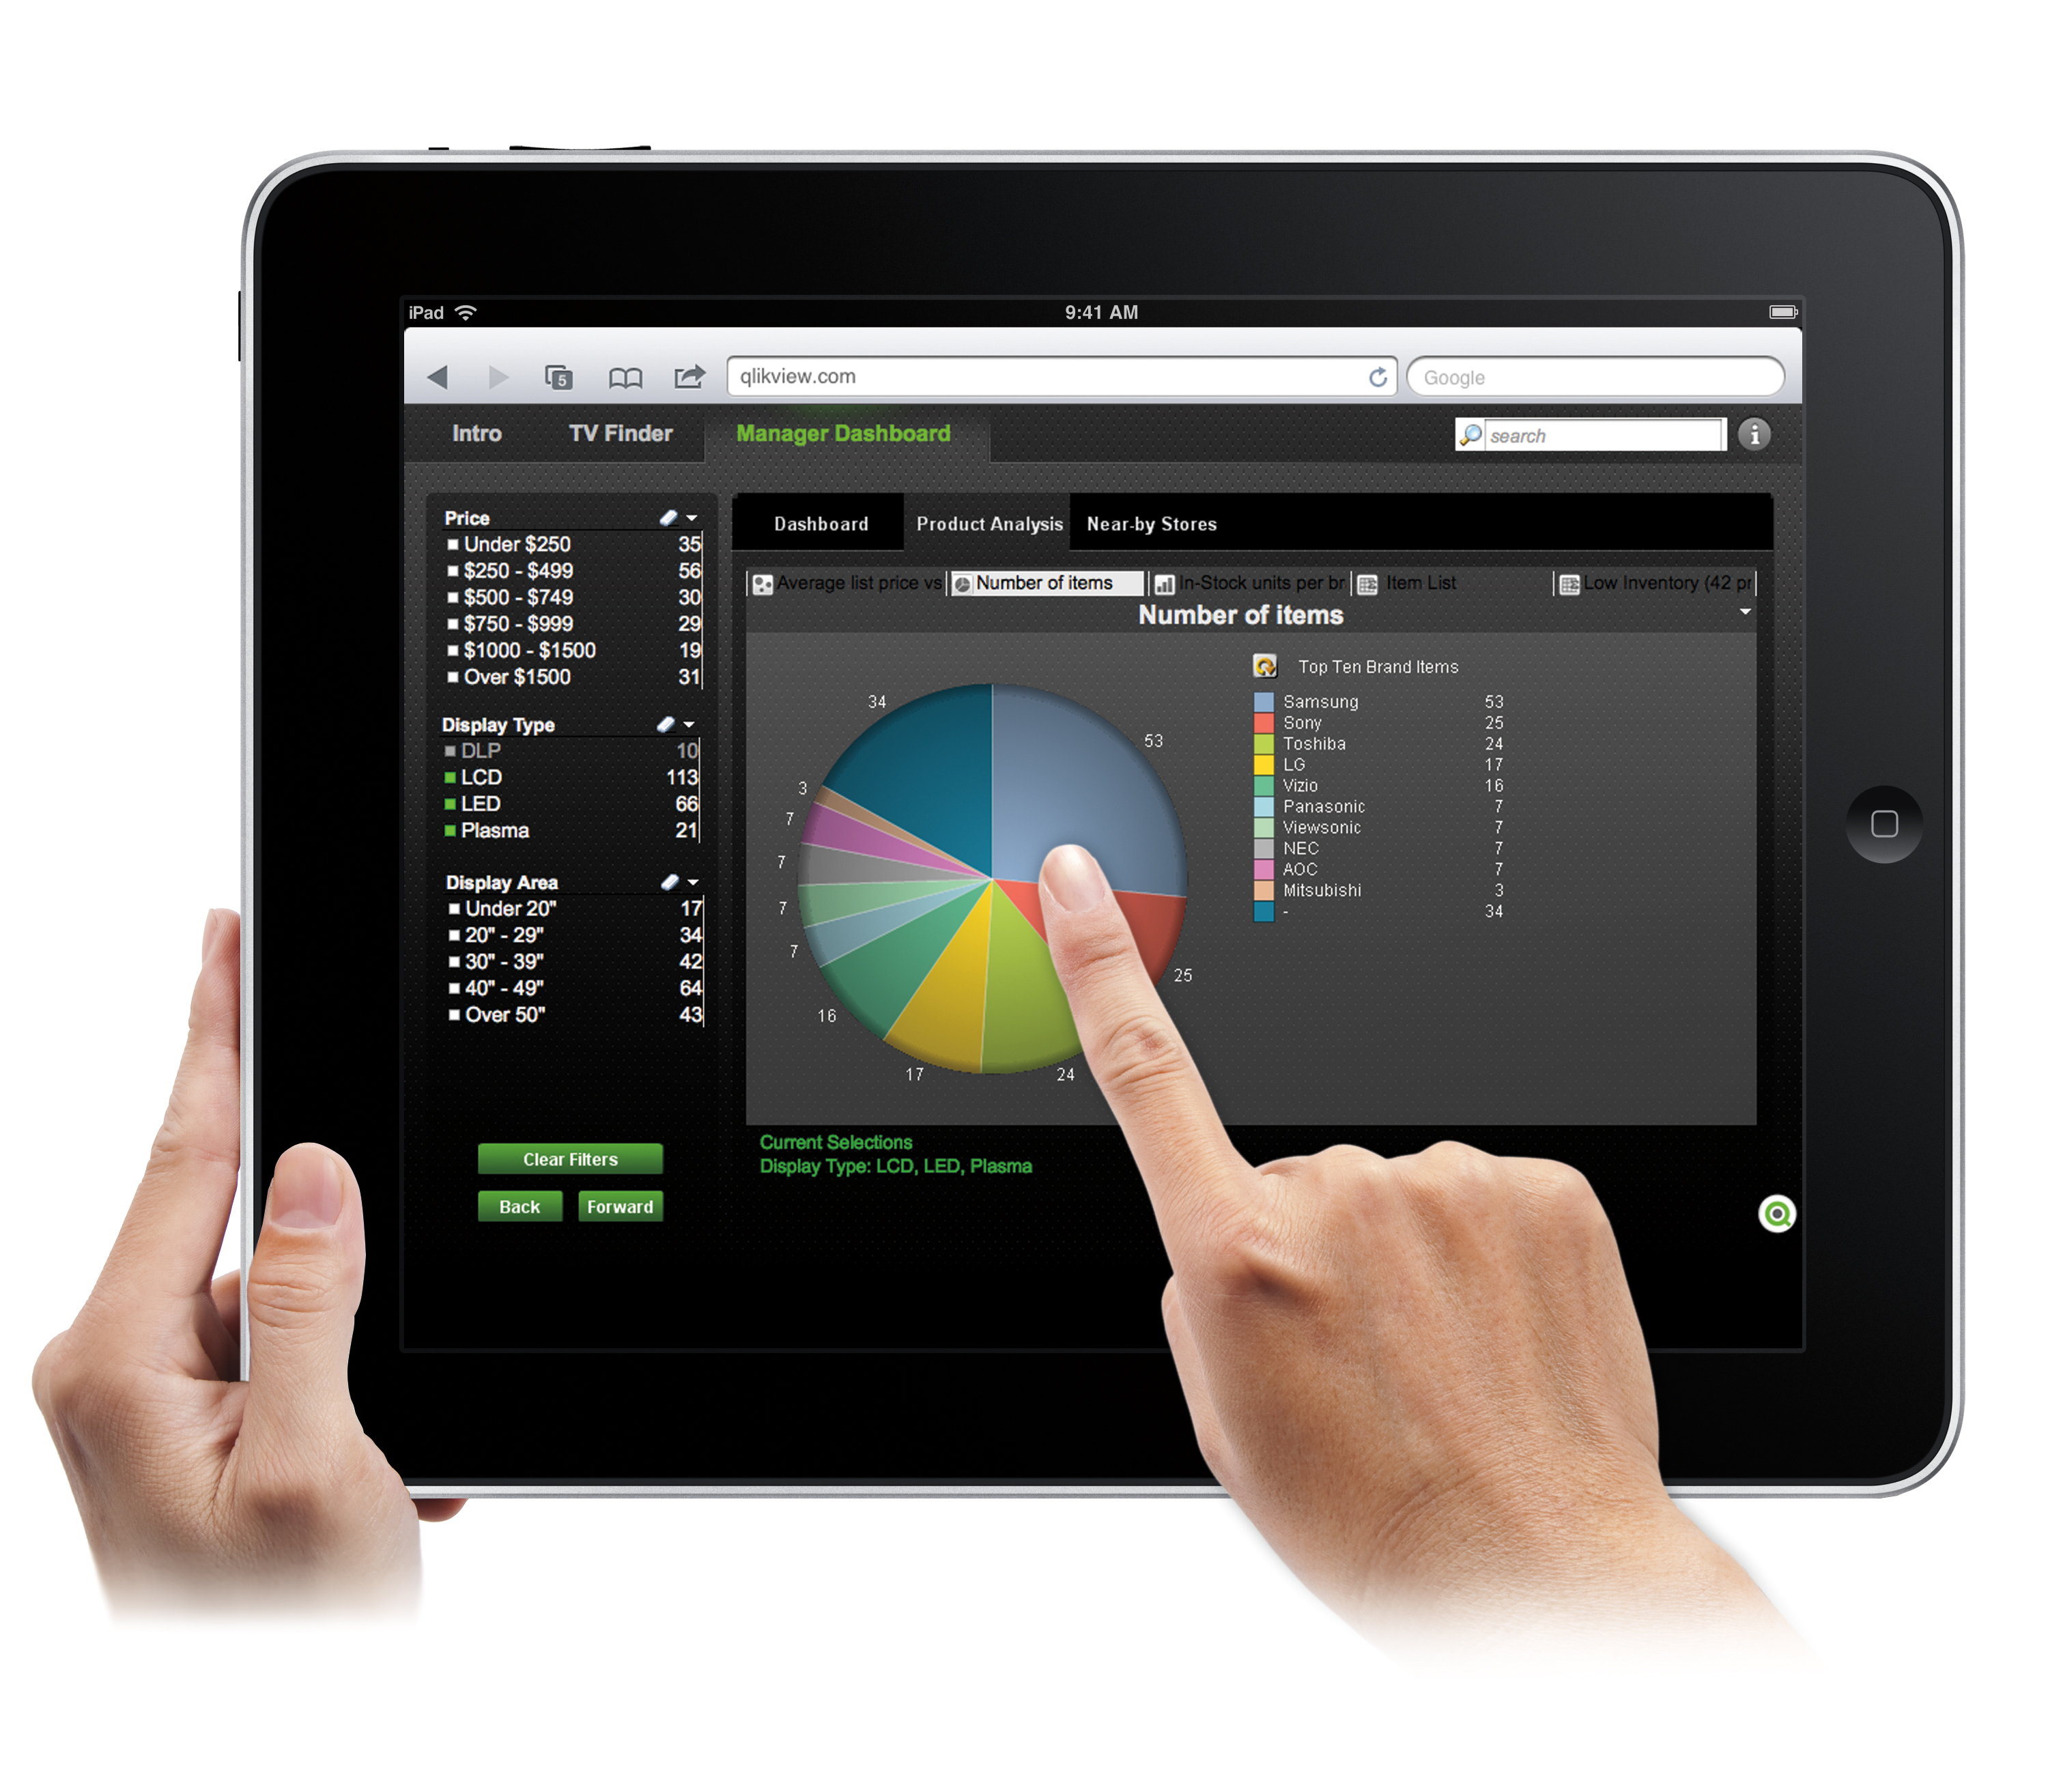 | SAP Lumira Discovery Screenshots 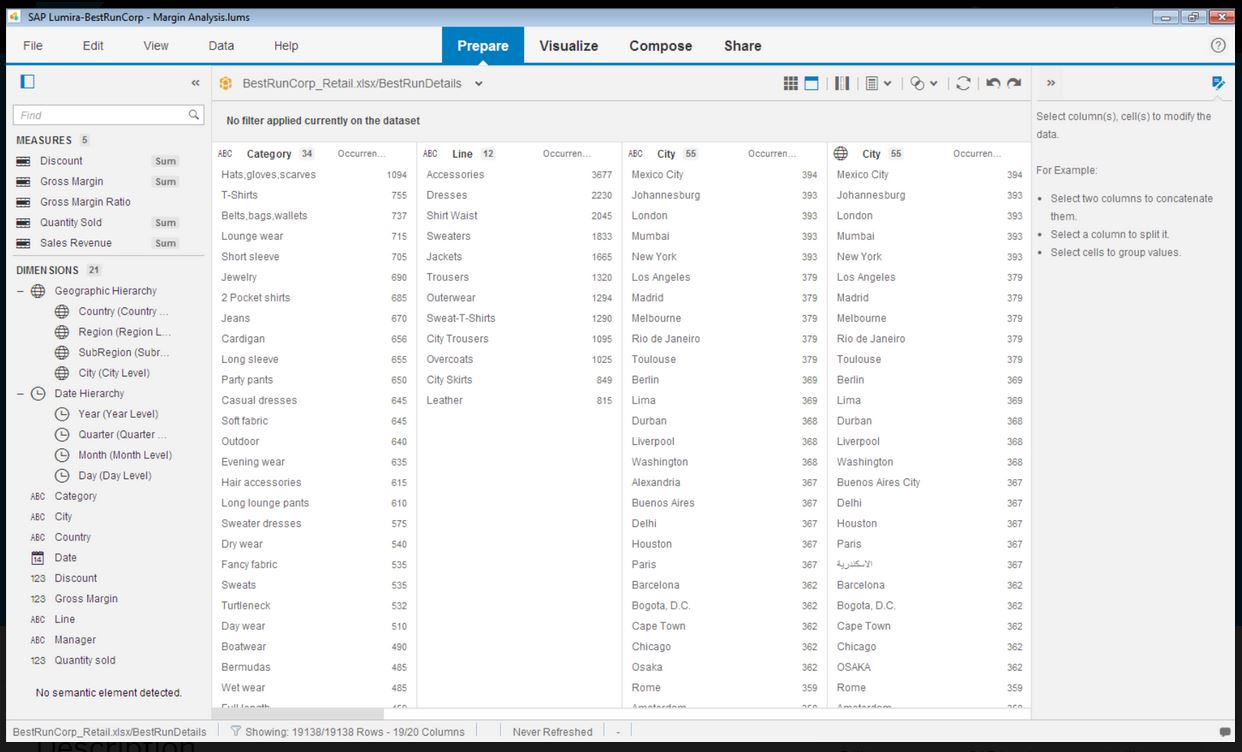     |