Chose SolarWinds AppOptics
Prometheus and Amazon CloudWatch

| Product | Rating | Most Used By | Product Summary | Starting Price |
|---|---|---|---|---|
 SolarWinds AppOptics | N/A | SolarWinds AppOptics (formerly Librato) is an IT infrastructure monitoring service and APM, based on technology acquired by SolarWinds with Librato in 2015 to expand its cloud monitoring portfolio. | N/A | |
 SolarWinds Pingdom | N/A | SolarWinds Pingdom is a website uptime monitoring and alert tool, with additional reporting and Real User Monitoring capabilities. Pingdom is part of SolarWinds’s DevOps package, enabling full-stack monitoring as a service. | $10 per month |
| SolarWinds AppOptics | SolarWinds Pingdom | |||||||||||||||
|---|---|---|---|---|---|---|---|---|---|---|---|---|---|---|---|---|
| Editions & Modules | No answers on this topic |
| ||||||||||||||
| Offerings |
| |||||||||||||||
| Entry-level Setup Fee | No setup fee | No setup fee | ||||||||||||||
| Additional Details | — | — | ||||||||||||||
| More Pricing Information | ||||||||||||||||
| SolarWinds AppOptics | SolarWinds Pingdom | |
|---|---|---|
| Considered Both Products |  SolarWinds AppOptics  Nikhil Kumar Sharma Associate Consultant Chose SolarWinds AppOptics Everyone used to know the names of AppDynamics and Dynatrace when it comes to APM or Application Tracing Monitoring. Since these tools were the evolver of this particular technology, I still believe that these tools are the market player. But SolarWinds AppOptics is not less, …  Dave Costantino CTO (Chief Technical Officer) Chose SolarWinds AppOptics We felt the competitors were both more expensive and more difficult to configure and deploy. We selected SolarWinds AppOptics because it provided better value both in terms of cost and user experience. |  SolarWinds Pingdom  Eric Kimminau Sr. Principal Engineer Chose SolarWinds Pingdom At least during our investigation thus far, all of these companies have a more responsive support organization and are more actively maintaininbg and supporting their products. They are also all significantly more expensive.  Phil Barker CTO Chose SolarWinds Pingdom Uptime.com Chose SolarWinds Pingdom Pingdom is the best for uptime as it's affordable and relatively simple but powerful enough. Other products offer other features.  Juan Orlando Cartagena Duran DevOps Engineer Chose SolarWinds Pingdom New Relic  Luiz Eduardo Garcia System Administrator Chose SolarWinds Pingdom Global points around the world. Availability reports. RUM and transactions.  Dan Harmon Senior System Analyst Chose SolarWinds Pingdom SolarWinds Dameware Remote Support (DRS), SolarWinds NetFlow Traffic Analyzer (NTA), SolarWinds Network Performance Monitor (NPM) and SolarWinds Security Event Manager (SEM)  Raghav Gupta Associate Chose SolarWinds Pingdom It is very suitable for our organization as metrics that it provides like disk space, CPU usage and availability of application, etc. And the main thing is it has good integration with OpsGenie and Jira software so when our application is down or has any issue then we get a …  Yaniv Vararu Director, Quality & Processes Chose SolarWinds Pingdom Some of the products mentioned here are much more "holistic solutions" for monitoring, analyzing, logging, alerting, etc., but for the use case, we use SolarWinds Pingdom. I think that SolorWinds Pingdom is much simpler and friendlier for configuring and maintaining. We …  Fazal Azeem Implementation & Support Specialist Chose SolarWinds Pingdom we migrated from site 24x7 to pingdom because we have been facing issues with the monitoring and alerting. Our customers would reach out to us first rather than our monitoring tool notifying us that there is a problem. Its administration is also very complicated and compared to …  Jay Moore CIO Chose SolarWinds Pingdom We selected SolarWinds Pingdom based on the feature set we desired, which was simply a monitoring solution for our websites and other critical network services. The decision to use SolarWinds Pingdom was based on the simplicity of their mobile app and website. |
| SolarWinds AppOptics | SolarWinds Pingdom | |||||||||||||||||||||||||||||||||||||||
|---|---|---|---|---|---|---|---|---|---|---|---|---|---|---|---|---|---|---|---|---|---|---|---|---|---|---|---|---|---|---|---|---|---|---|---|---|---|---|---|---|
| Application Performance Management |
|
| SolarWinds AppOptics | SolarWinds Pingdom | |
|---|---|---|
| Small Businesses |  GitLab Score 8.7 out of 10 | No answers on this topic |
| Medium-sized Companies |  ManageEngine Site24x7 Score 9.8 out of 10 |  Cisco ThousandEyes Score 8.9 out of 10 |
| Enterprises | ManageEngine Site24x7 Score 9.8 out of 10 |  Nexthink Score 7.0 out of 10 |
| All Alternatives | View all alternatives | View all alternatives |
| SolarWinds AppOptics | SolarWinds Pingdom | |
|---|---|---|
| Likelihood to Recommend | 7.8 (0 ratings) | 4.5 (0 ratings) |
| Likelihood to Renew | 9.1 (0 ratings) | 10.0 (0 ratings) |
| Usability | 9.6 (0 ratings) | 10.0 (0 ratings) |
| Performance | - (0 ratings) | 6.0 (0 ratings) |
| Support Rating | 9.0 (0 ratings) | 4.1 (0 ratings) |
| SolarWinds AppOptics | SolarWinds Pingdom | |
|---|---|---|
| Likelihood to Recommend |
|
|
| Pros |
|
|
| Cons |
|
Fazal Azeem Implementation & Support Specialist |
| Likelihood to Renew |
|
 Ted White Sr. Mgr., Information Systems Production Operations |
| Usability |
|
|
| Performance | No answers on this topic |
Ted White Sr. Mgr., Information Systems Production Operations |
| Support Rating |
Nikhil Kumar Sharma Associate Consultant |
|
| Alternatives Considered |
|
|
| Return on Investment |
|
|
| ScreenShots | SolarWinds AppOptics Screenshots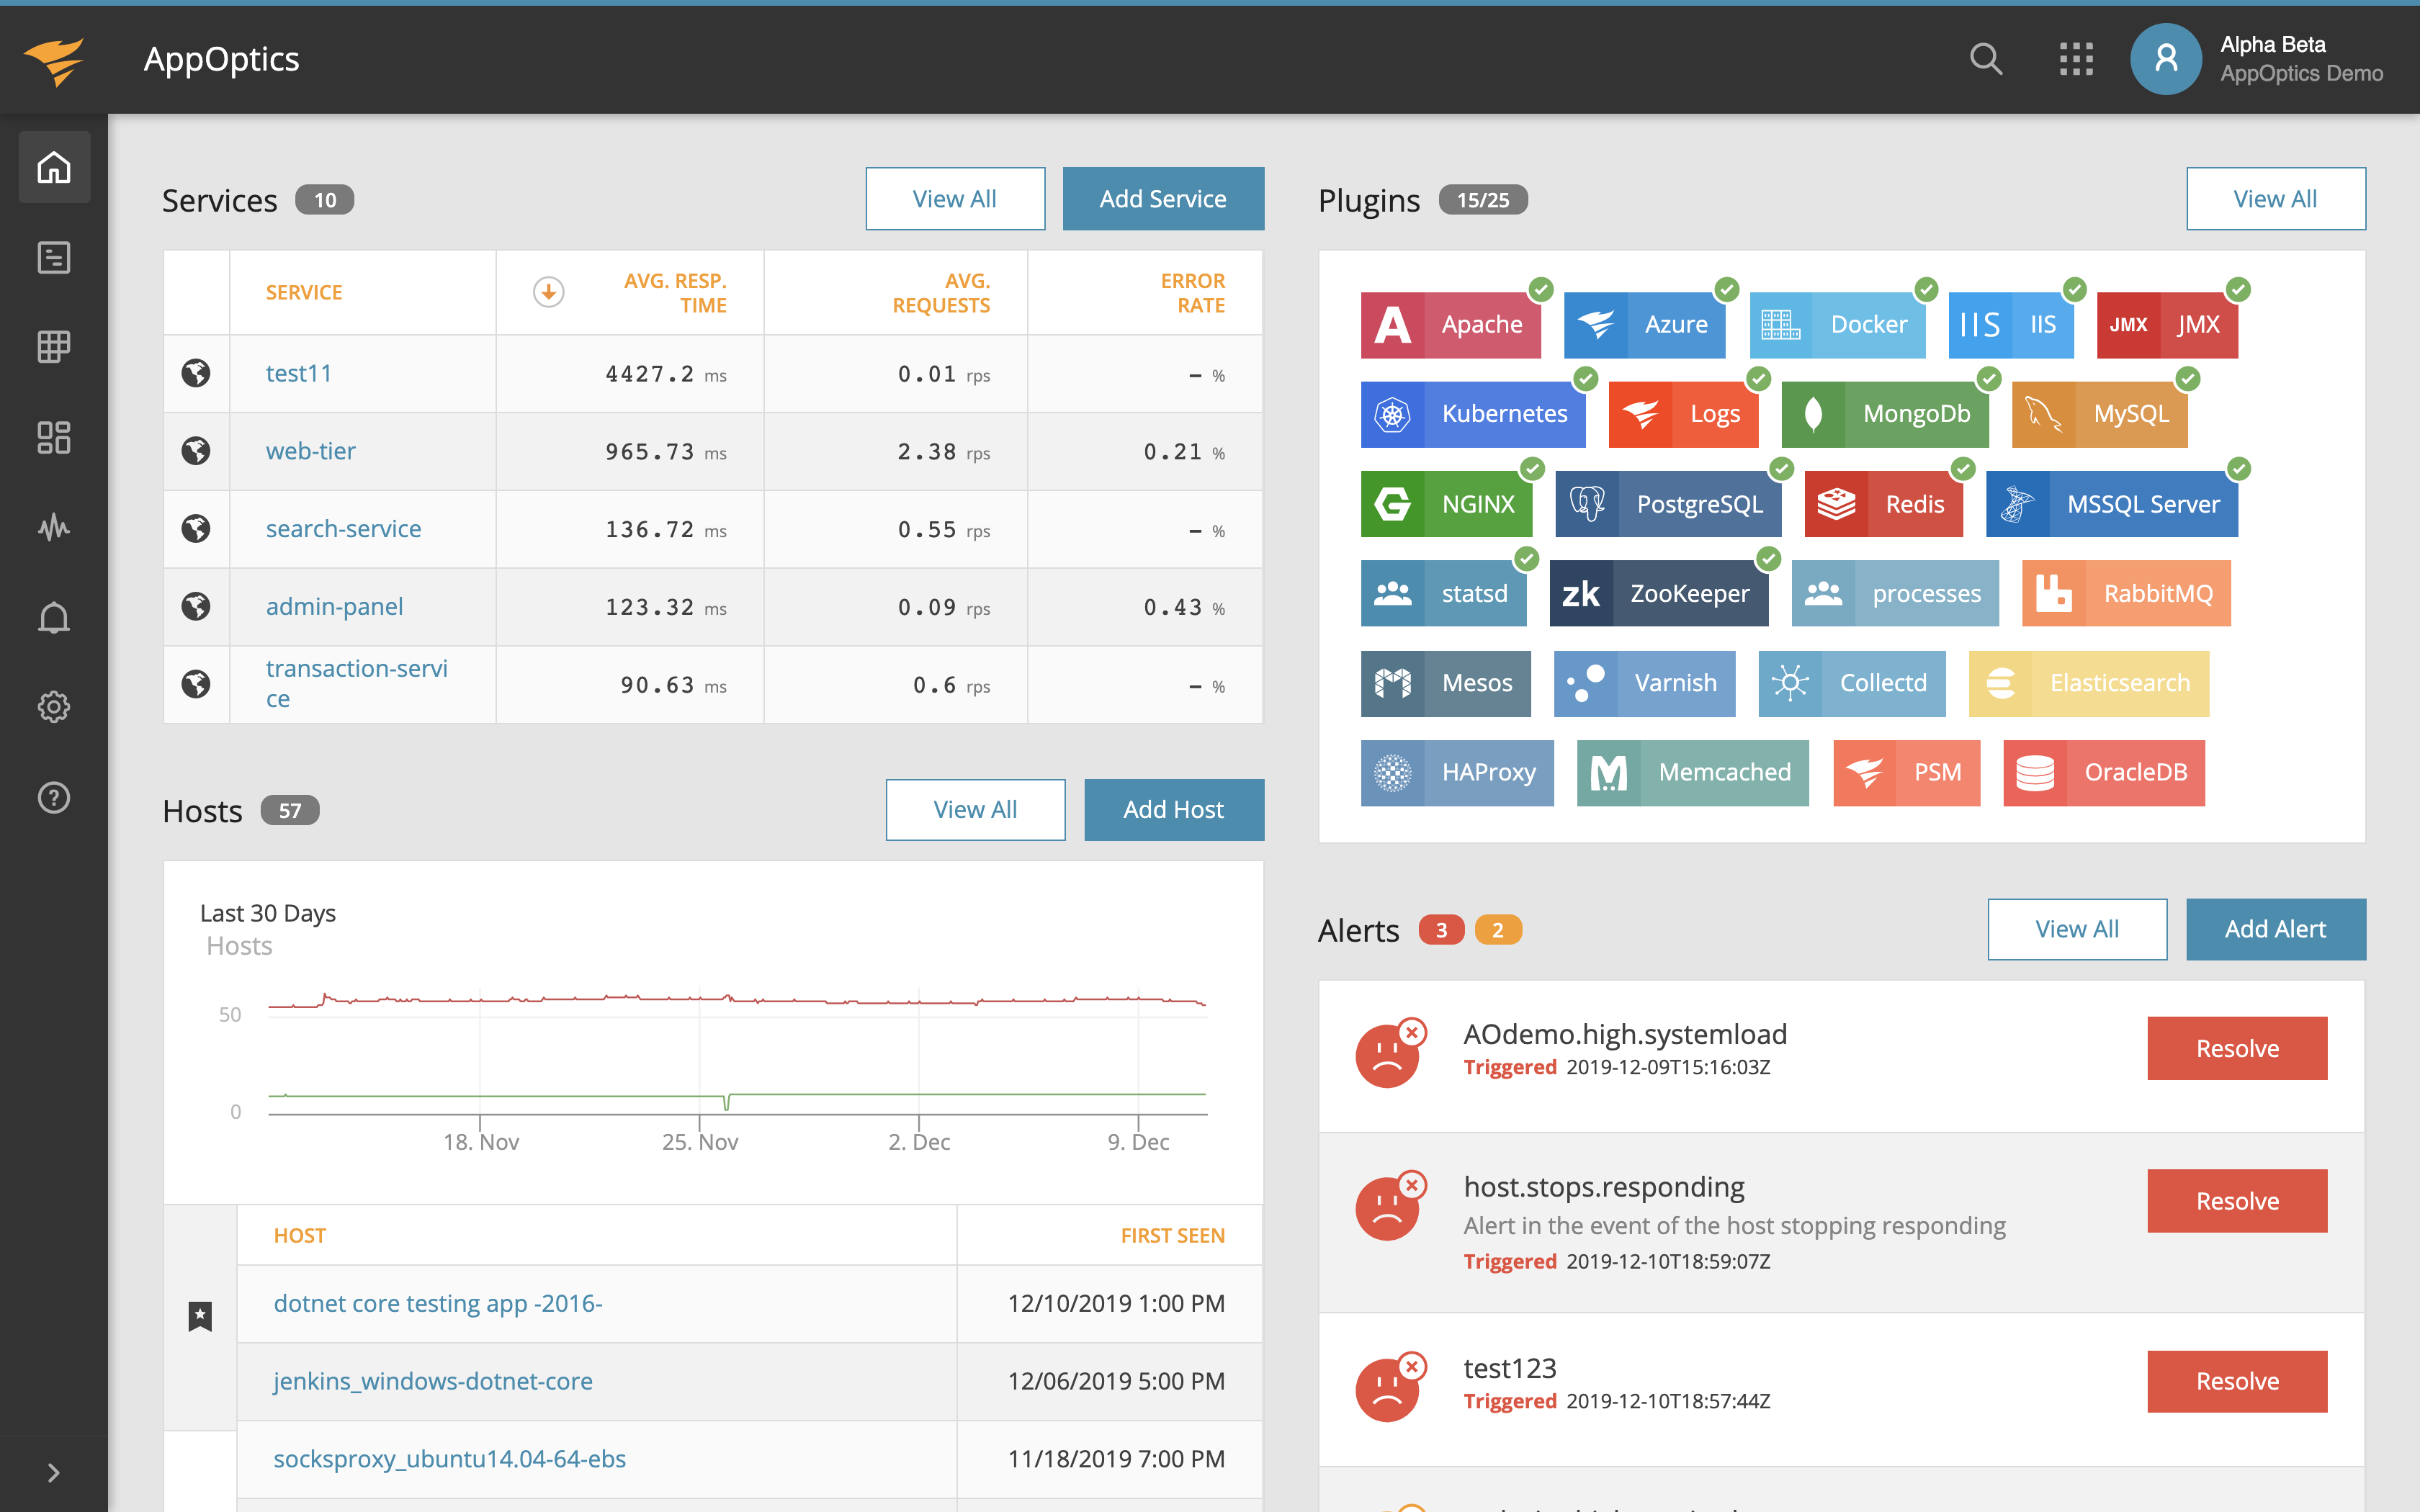   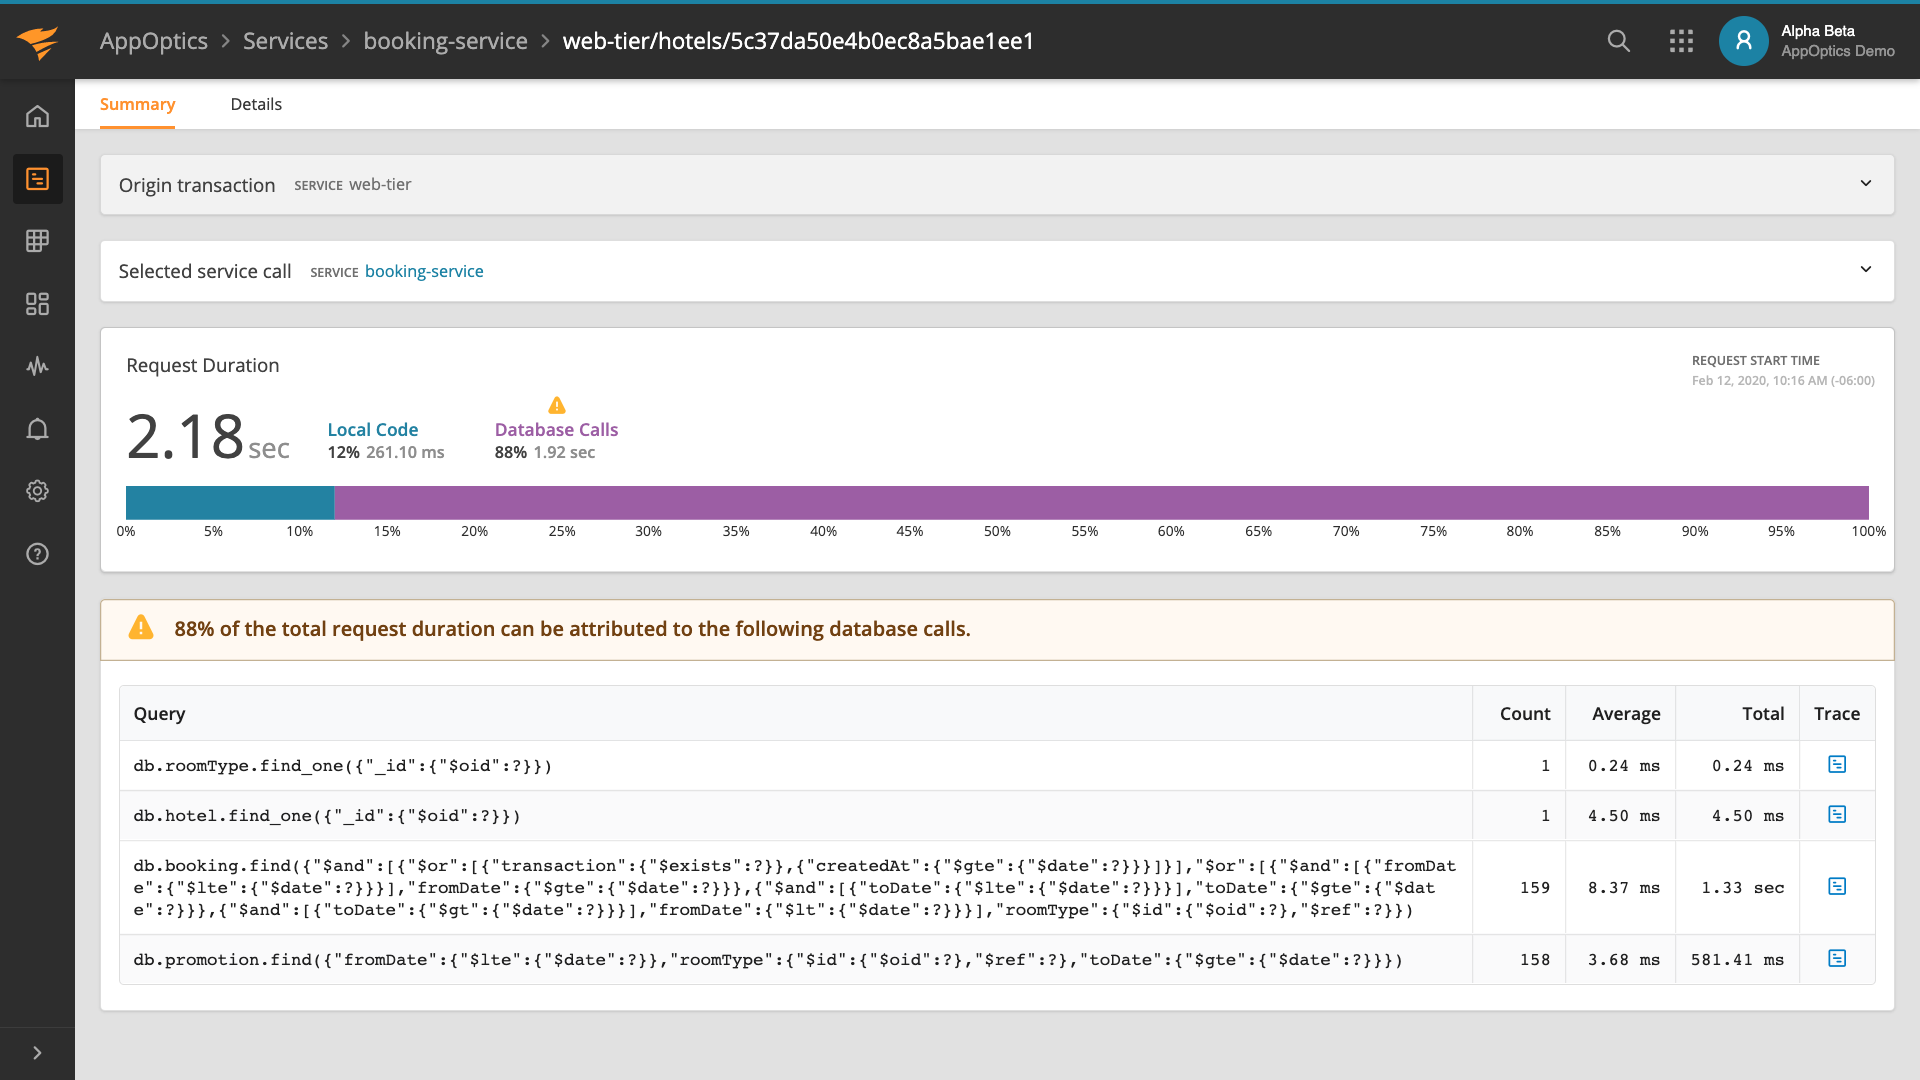   | SolarWinds Pingdom Screenshots    |
