Tableau Cloud (formerly Tableau Online) is a self-service analytics platform that is fully hosted in the cloud. Tableau Cloud enables users to publish dashboards and invite colleagues to explore hidden opportunities with interactive visualizations and accurate data, from any browser or mobile device.
$15
per month billed annually per user
ThoughtSpot
Score 8.2 out of 10
N/A
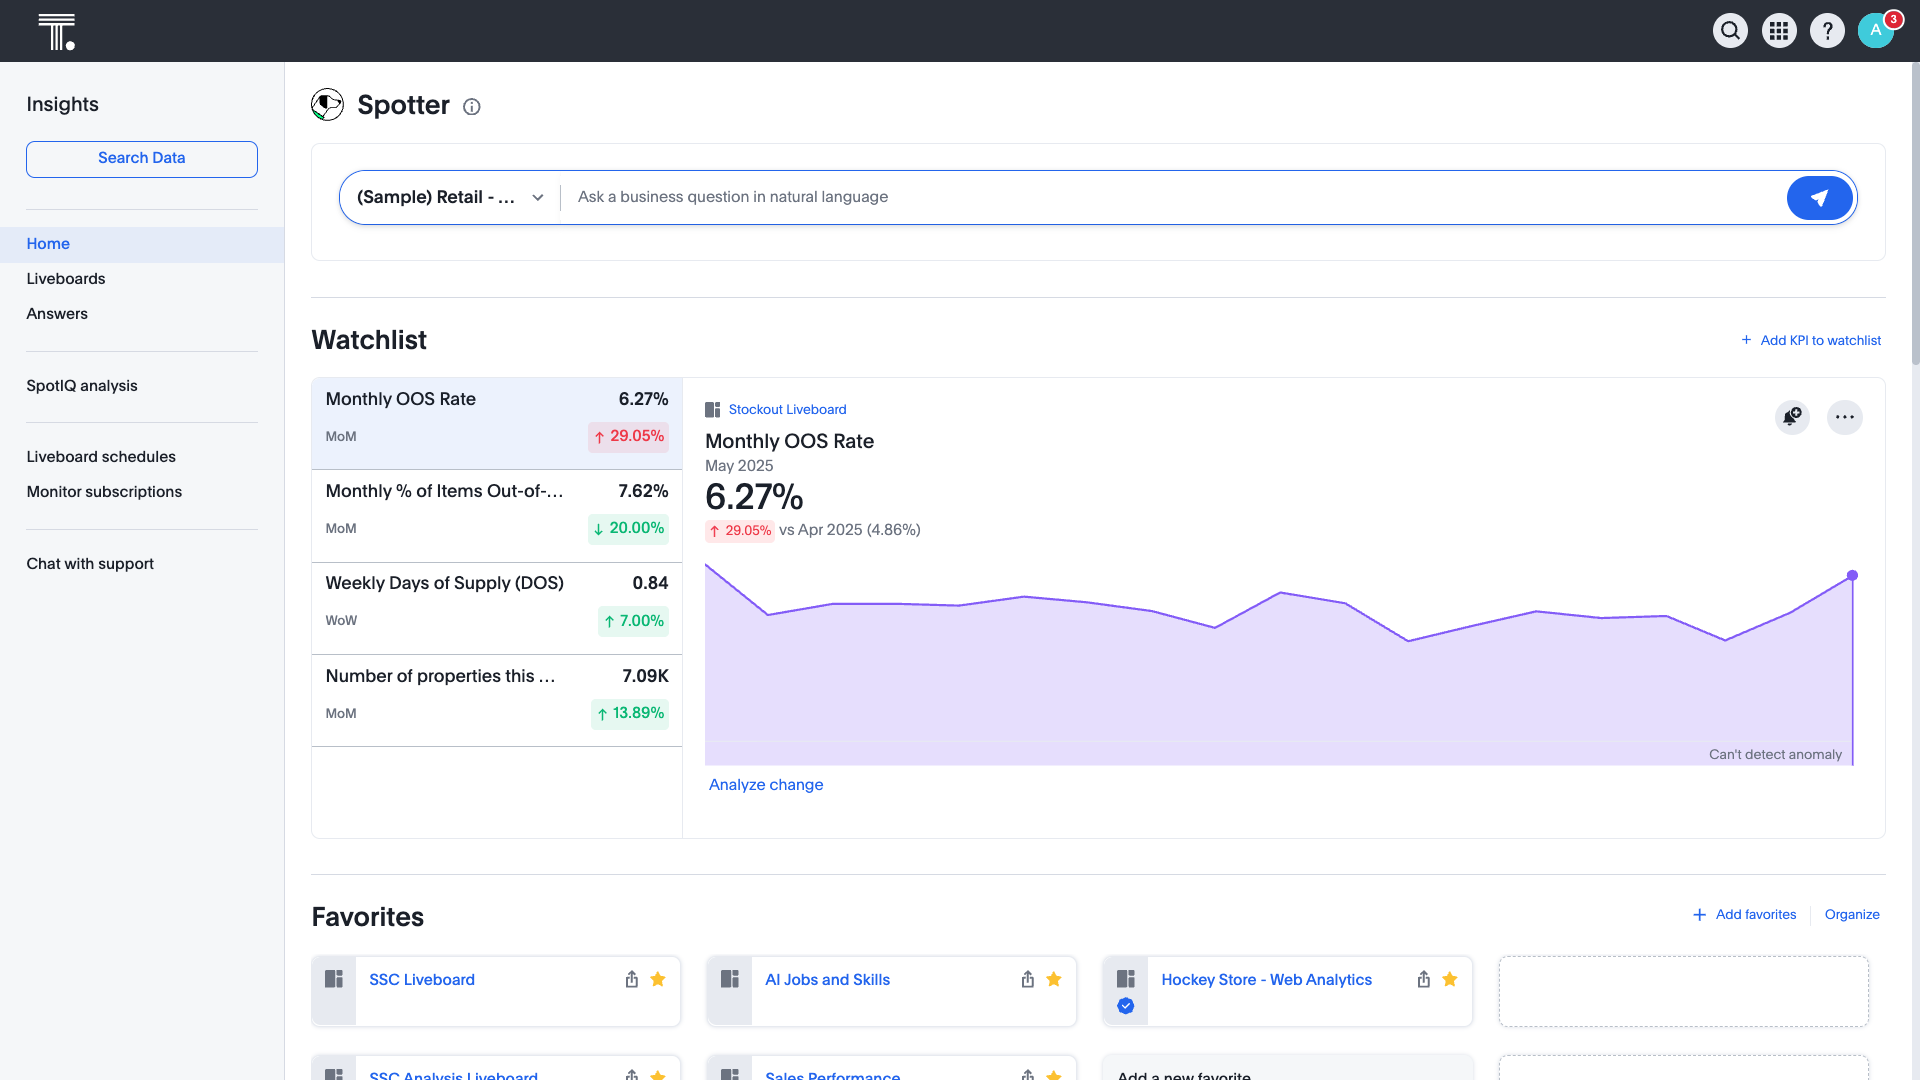
ThoughtSpot is an Agentic Analytics Platform for enterprises where users ask data questions using natural language and get answers with AI. Code-first for data teams and code-free for business users, ThoughtSpot can handle large, complex cloud data at scale.
$50
per month (billed annually) per user (25-1000 users)
Pricing
Tableau Cloud
ThoughtSpot
Editions & Modules
Tableau Viewer
$15
per month billed annually per user
Enterprise Viewer
$35
per month billed annually per user
Tableau Explorer
$42
per month billed annually per user
Enterprise Explorer
$70
per month billed annually per user
Tableau Creator
$75
per month billed annually per user
Enterprise Creator
$115
per month billed annually per user
Tableau+
Contact Sales
Thoughtspot Analytics - Pro
$50
per month (billed annually) per user (25-1000 users)
Tableau Cloud is ery powerful and user friendly with minimal cost when compared with other BI tools.Its robust features like switching toggles, supporting SQL queries for buiding charts and all stands out as the best.It reduces time in creating difficult and complex dashbords …
ThoughtSpot's user friendly interface, faster and accurate results, low-code support for building insights and vast availability of native charts, AI powered dashboards helps in faster decision making and helps in driving better business results. The mobile APP that ThoughtSpot …
It is more cost effective when compared to Tableau and more easy to use. ThoughtSpot integrates well with modern cloud data platforms like Snowflake, Google, and Bigquery, making it easy to analyze large datasets in real time. Sync insights into cloud tools. Users can sync …
We selected ThoughtSpot with the promise that it would evolve into a Google search for business insights. To date, it has not gotten close in my opinion.
If you're using Tableau as the primary BI tool, then Tableau Cloud is well suited to publish and share the results with a wide(r) audience. It is well suited for various degrees of self-service proficiency, from pure consumers of analytical work to more advanced users who can use web editing for smaller or larger adjustments, and even for desktop power users who will publish their work to Tableau Cloud. It has many good ways to organize the content and make it easily accessible via search, favorites, folders, collections ("playlists for your data"), or history ("recents"). It might not be ideally suited if there are many on-prem sources to be used (even though there are options to connect them) or if you have very special requirements regarding custom server setup, which is limited in a shared cloud environment like Tableau Cloud.
By using the power of cloud platforms like bigquery or snowflake, ThoughtSpot can deliver performance at scale ensuring that even the largest organization can quickly analyze and visualize data. The ability to seamlessly share live dashboards fosters collaborations, ensuring everyone in the organization is working from the same data source and aligned in decision making.
Tableau Online is completely cloud based and that's why the reports and dashboards are accessible even on the go. One doesn't always need to access the office laptop to access the reports.
The visualizations are interactive and one can quickly change the level at which they want to view the information. For example, one person might be more interested in looking at the country level performances rather than client level. This is intuitive and one doesn't need to create multiple reports for the same.
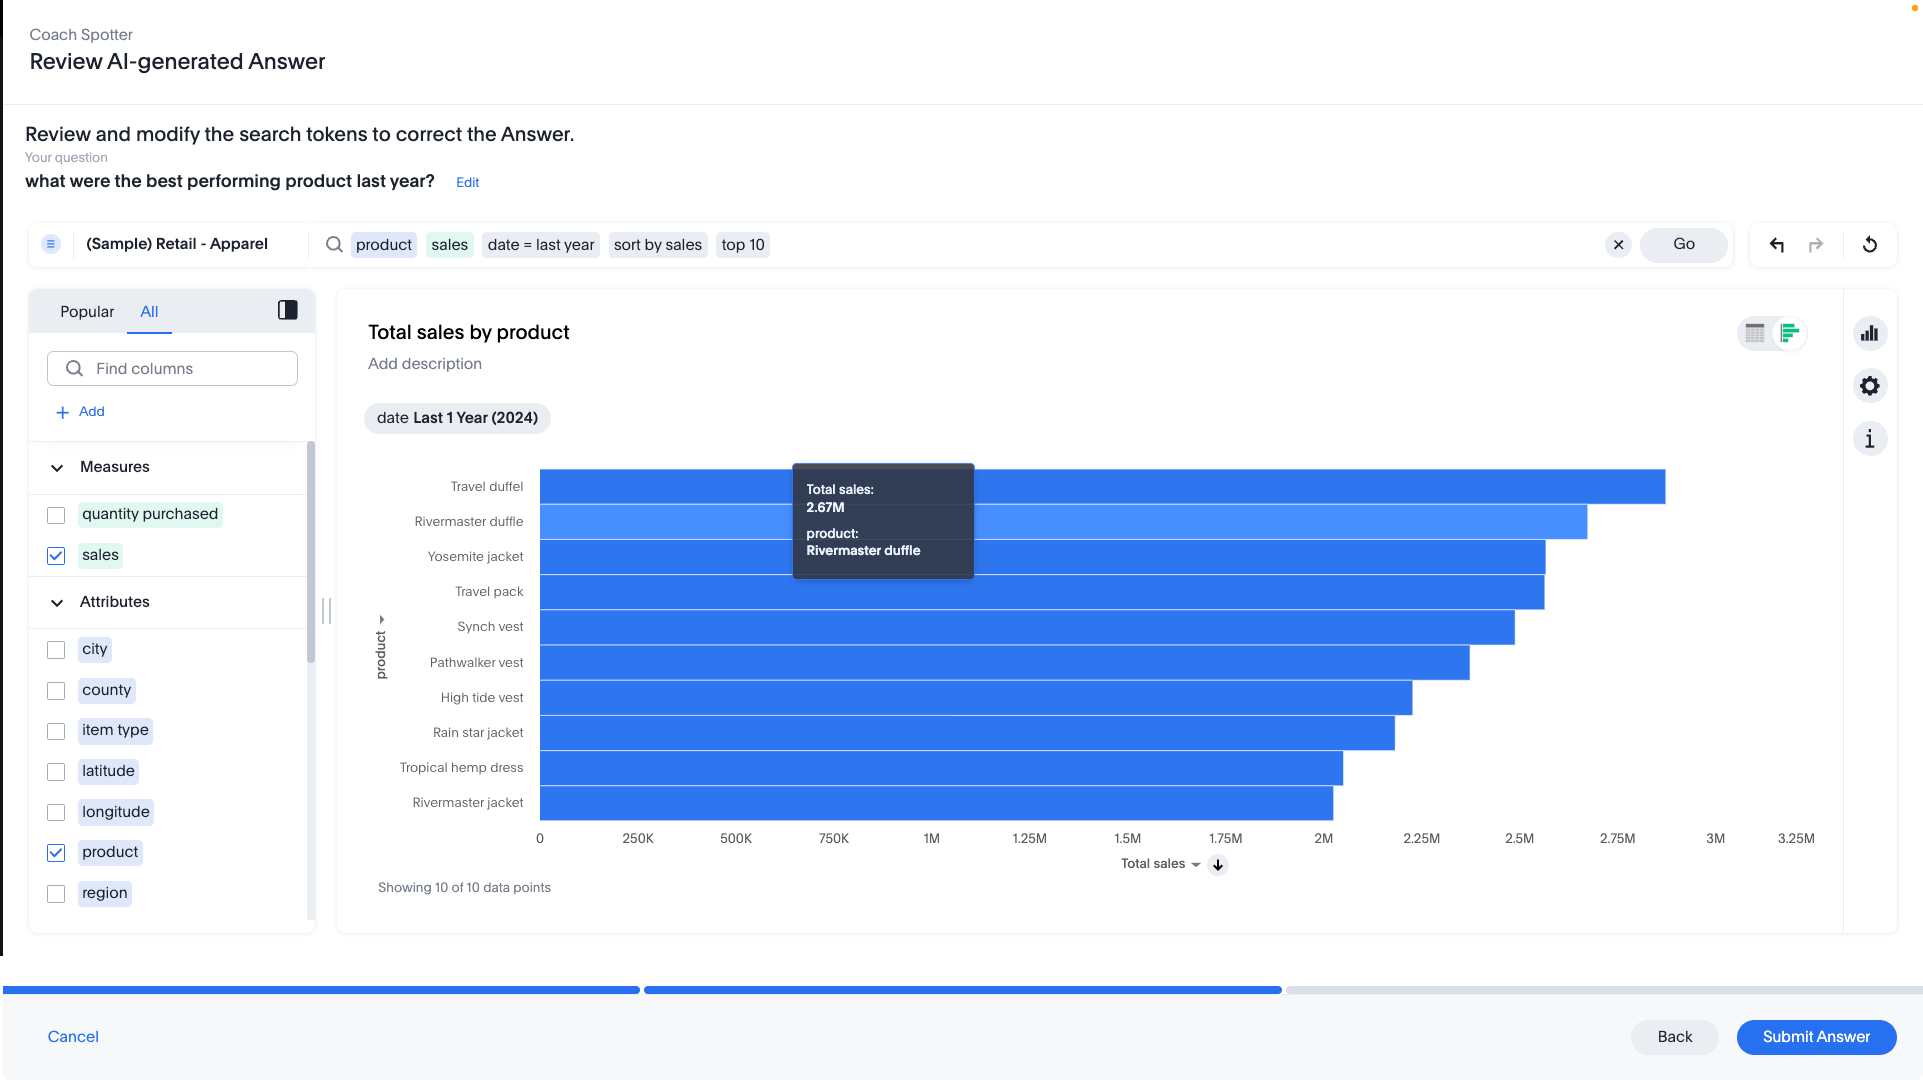
The feature to ask questions in plain vanilla English language is great and helpful. For quick adhoc fact checks one can simply type what they are looking for and the Natural Language Programming algorithms under the hood parse the query, interpret it and then fetch the results accordingly in a visual form.
Beautiful visualizations. The visuals are distinct, clean, and easy to discern from one another.
Intelligent querying functionality. When looking to manipulate the data, the search function makes it easy to manipulate the features in the data, along with aggregating them in the way you'd like.
Embedding! It has been a smooth process thus far for our product & technical teams to work with ThoughtSpot and bring it into our product.
It would be great if ThoughtSpot can add the feature to filter by clicking on visualizations. i.e if I click on a particular data point in the chart if the full dashboard can filter just for that particular data point.
Color coding the heatmap with different colors like green to orange to red.
We have had success with the initial use cases and there are more use cases that can receive return on investment. I don't give it a 10 because other products like Tableau are building functionality that may start to compete in the coming years.
From an end user perspective Tableau Online is overall very easy to navigate once you get used to it, my only complaint is that when expanding or contracting a graph, the "plus" and "minus" on the bottom left is sometimes hidden, and should always be visible. From a builder perspective, it can take some getting used to but the sheer depth of customization makes it all worthwhile.
The tool is easy to use if you know what you are doing and looking for. I know as they work towards improvements and simple language it will become even easier, but as of now they are doing a great job but there is room for improvement.
I have no had a lot of experience with the support team, but I know that it’s hardly necessary for the end-user to contact. Usually, the main questions I get are on how to read a certain dashboard or how to navigate to a certain place. Overall, the simplicity of the software is what helps out with less need for support.
I give it this meeting because the team is not only help able to help us in the current solutions but also amazing and taking feedback and feeding it back to their development team which includes more products and features into ThoughtSpot
When weighing the pros and cons of Tableau Online vs. SAP ERP, two key considerations emerged as clear winners. SAP ERP is a powerful data purification tool, but it doesn't measure up to the competition in terms of data presentation. When it came to data visualization and analytics, Tableau was our go-to tool. The price is the second consideration. Tableau, on the other hand, was the more cost-effective option for our requirements.
It is more flexible and PowerBI, easier work online, and share information with many users. Also the dashboards and beautiful, and the user experience is better. Performance used to be faster. We use Looker for different use cases but, when it comes to reporting and sharing information, ThoughSpot is much better.
Because it is very reliable, inside the situation, we need strong internet connection to access a lot of data but easily never had any downtime except during the upgrades
No need to hire a team of developers to deliver our product, a huge cost savings for a start up company.
The ability to work off data extracts allows us to "set in and forget it" so to speak, which allows our customers to use the system during business hours with almost no cost in terms of database usage.
It has been a great internal tool for dashboarding company metrics and helping us track goals and implement solutions to meet those goals through efficient data analysis.
Time to market ROI is massive vs hiring the full-time dedicated team to build and maintain a frontend multi-tenant SaaS data viz product.
It will be interesting to see over time how the advanced features play out in terms of usability and end value, such as Natural Search, which we are very excited about, and the machine learning tools.