Splunk AppDynamics vs. SolarWinds Database Performance Monitor

Overview
ProductRatingMost Used ByProduct SummaryStarting Price
Splunk AppDynamics
Score 8.3 out of 10
N/A
AppDynamics is an APM and Mobile APM program, with application mapping and predictive capabilities. These capacities enable automated remediation and code-level diagnostics in real time. It can be deployed on-premise or as a SaaS.N/A
SolarWinds Database Performance Monitor
Score 9.2 out of 10
N/A
VividCortex, acquired by SolarWinds in December 2019, provides database performance monitoring designed to increase system performance, team efficiency, and infrastructure cost savings. The GDPR- and SOC 2-compliant platform offers visibility into major open-source databases—MySQL, PostgreSQL, Amazon Aurora, MongoDB, and Redis—for the engineering team at scale. Industry leaders like Etsy, GitHub, SendGrid, and Yelp rely on Database Performance Monitor for all-query monitoring and drill…N/A
Pricing
Splunk AppDynamicsSolarWinds Database Performance Monitor
Editions & Modules
No answers on this topic
Offerings
Pricing Offerings
Splunk AppDynamicsSolarWinds Database Performance Monitor
Free Trial
YesYes
Free/Freemium Version
YesNo
Premium Consulting/Integration Services
YesYes
Entry-level Setup FeeNo setup feeNo setup fee
Additional Details
More Pricing Information
Community Pulse
Splunk AppDynamicsSolarWinds Database Performance Monitor
Features
Splunk AppDynamicsSolarWinds Database Performance Monitor
Application Performance Management
Comparison of Application Performance Management features of Product A and Product B
Splunk AppDynamics
8.5
74 Ratings
11% above category average
SolarWinds Database Performance Monitor
-
Ratings
Application monitoring9.474 Ratings00 Ratings
Database monitoring7.971 Ratings00 Ratings
Threshold alerts8.972 Ratings00 Ratings
Predictive capabilities7.871 Ratings00 Ratings
Application performance management console9.071 Ratings00 Ratings
Collaboration tools7.659 Ratings00 Ratings
Server availability and performance monitoring8.544 Ratings00 Ratings
Server usage monitoring and capacity forecasting8.942 Ratings00 Ratings
Best Alternatives
Splunk AppDynamicsSolarWinds Database Performance Monitor
Small Businesses
GitLab
GitLab
Score 8.7 out of 10

No answers on this topic

Medium-sized Companies
ManageEngine Site24x7
Score 9.8 out of 10
Redgate Monitor
Redgate Monitor
Score 8.8 out of 10
Enterprises
ManageEngine Site24x7
Score 9.8 out of 10
Redgate Monitor
Redgate Monitor
Score 8.8 out of 10
All AlternativesView all alternativesView all alternatives
User Ratings
Splunk AppDynamicsSolarWinds Database Performance Monitor
Likelihood to Recommend
8.7
(74 ratings)
8.0
(1 ratings)
Likelihood to Renew
9.1
(2 ratings)
-
(0 ratings)
Usability
8.5
(8 ratings)
-
(0 ratings)
Support Rating
8.1
(6 ratings)
-
(0 ratings)
User Testimonials
Splunk AppDynamicsSolarWinds Database Performance Monitor
Likelihood to Recommend
Cisco
Platforms for software as a service (SaaS) frequently cater to a large number of users with a variety of needs and usage patterns. Because AppDynamics offers multi-tenant monitoring capabilities to track performance across various customer environments, it is a good choice for SaaS platform monitoring. SaaS providers can maximize resource utilization, proactively detect and resolve performance issues, and provide a dependable and consistent user experience for their clients with AppDynamics.
Read full review
SolarWinds
Computing resources consumed by the DB instance, DPA queries & wait time, deadlock conditions, virtual infrastructure resources. The addition of NPM & DPA integration as well as cross-correlation in the identification of issues with the network or server or DB is all stupid-proof. Monitoring is more than just health and resource consumption, it's also performance. DB performance analysis is key to maintaining healthy DB instances.
Read full review
Pros
Cisco
  • AppDynamics delves deeply into traceability and profiling at the code level. By identifying and refactoring any hidden performance hogs in our code, we can directly observe the performance improvements.
  • AppDynamics provides real-time dashboards and in-depth insights into each layer of the application stack, lifting the curtain on performance.
  • AppDynamics gives us the ability to proactively detect and resolve performance issues. We are able to keep things running smoothly for our users and stop outages.
  • We can monitor stability and performance prior to, during, and following releases with AppDynamics, which helps to minimize regression risks and facilitate smooth rollouts.
Read full review
SolarWinds
  • Simple to use and very easy to learn.
  • The execution engines run in parallel, can execute any syntax or query.
  • DPN can run all queries for both Oracle and SQL with no additional support.
Read full review
Cons
Cisco
  • Improving the clarity and comprehensiveness of the documentation could benefit users. Clearer documentation ensures that users can make the most of all the functionalities
  • Leverages AI and machine learning for intelligent insights, aiding in issue identification and prediction.
  • Competitive, with AI-driven features becoming increasingly common in APM solutions.
Read full review
SolarWinds
  • The Reporting feature currently doesn't allow customization.
Read full review
Likelihood to Renew
Cisco
its working for us, we are familiar and comfortable with the tool and its proven valuable/indispensable in helping evaluate our code.
Read full review
SolarWinds
No answers on this topic
Usability
Cisco
Actually, I would like to give it a score of 10 out of 10, but taking into account certain factors such as: the cost of the annual licence, the complexity of installation and configuration, the blurring of setting Splunk AppDynamics over the cloud and especially OpenShift since we use it as a container platform. So, 8 out of 10 looks perfect for it
Read full review
SolarWinds
No answers on this topic
Support Rating
Cisco
AppDynamics has its own community site that includes forums and a knowledge base. On the forums, you can converse with other members of the community and ask technical questions as you have them. Though this forum isn’t filled with people there are active members for you to gain some valuable insights.
Read full review
SolarWinds
No answers on this topic
Alternatives Considered
Cisco
It is distinguished from these programs because the platform provides visualizations of application processes, showing the interplay between various parts and services. Understanding the architecture of complicated apps and finding their weak spots is greatly aided by this.
Read full review
SolarWinds
DPM is less expensive and more feature-rich. Also, Oracle tech support is garbage, unless you can afford to spend a day getting assistance.
Read full review
Return on Investment
Cisco
  • AppDynamics has played a pivotal role in optimizing our applications for a seamless user experience. The proactive monitoring and quick issue resolution have translated into improved user satisfaction and increased retention rates.
  • The initial cost and effort associated with implementing AppDynamics might be considered a negative impact, particularly for organizations with budget constraints. However, the long-term benefits have justified this initial investment.
Read full review
SolarWinds
  • What is the cost of a downed DB instance? That's your ROI. DPM lets you see issues before they become critical.
Read full review
ScreenShots

SolarWinds Database Performance Monitor Screenshots

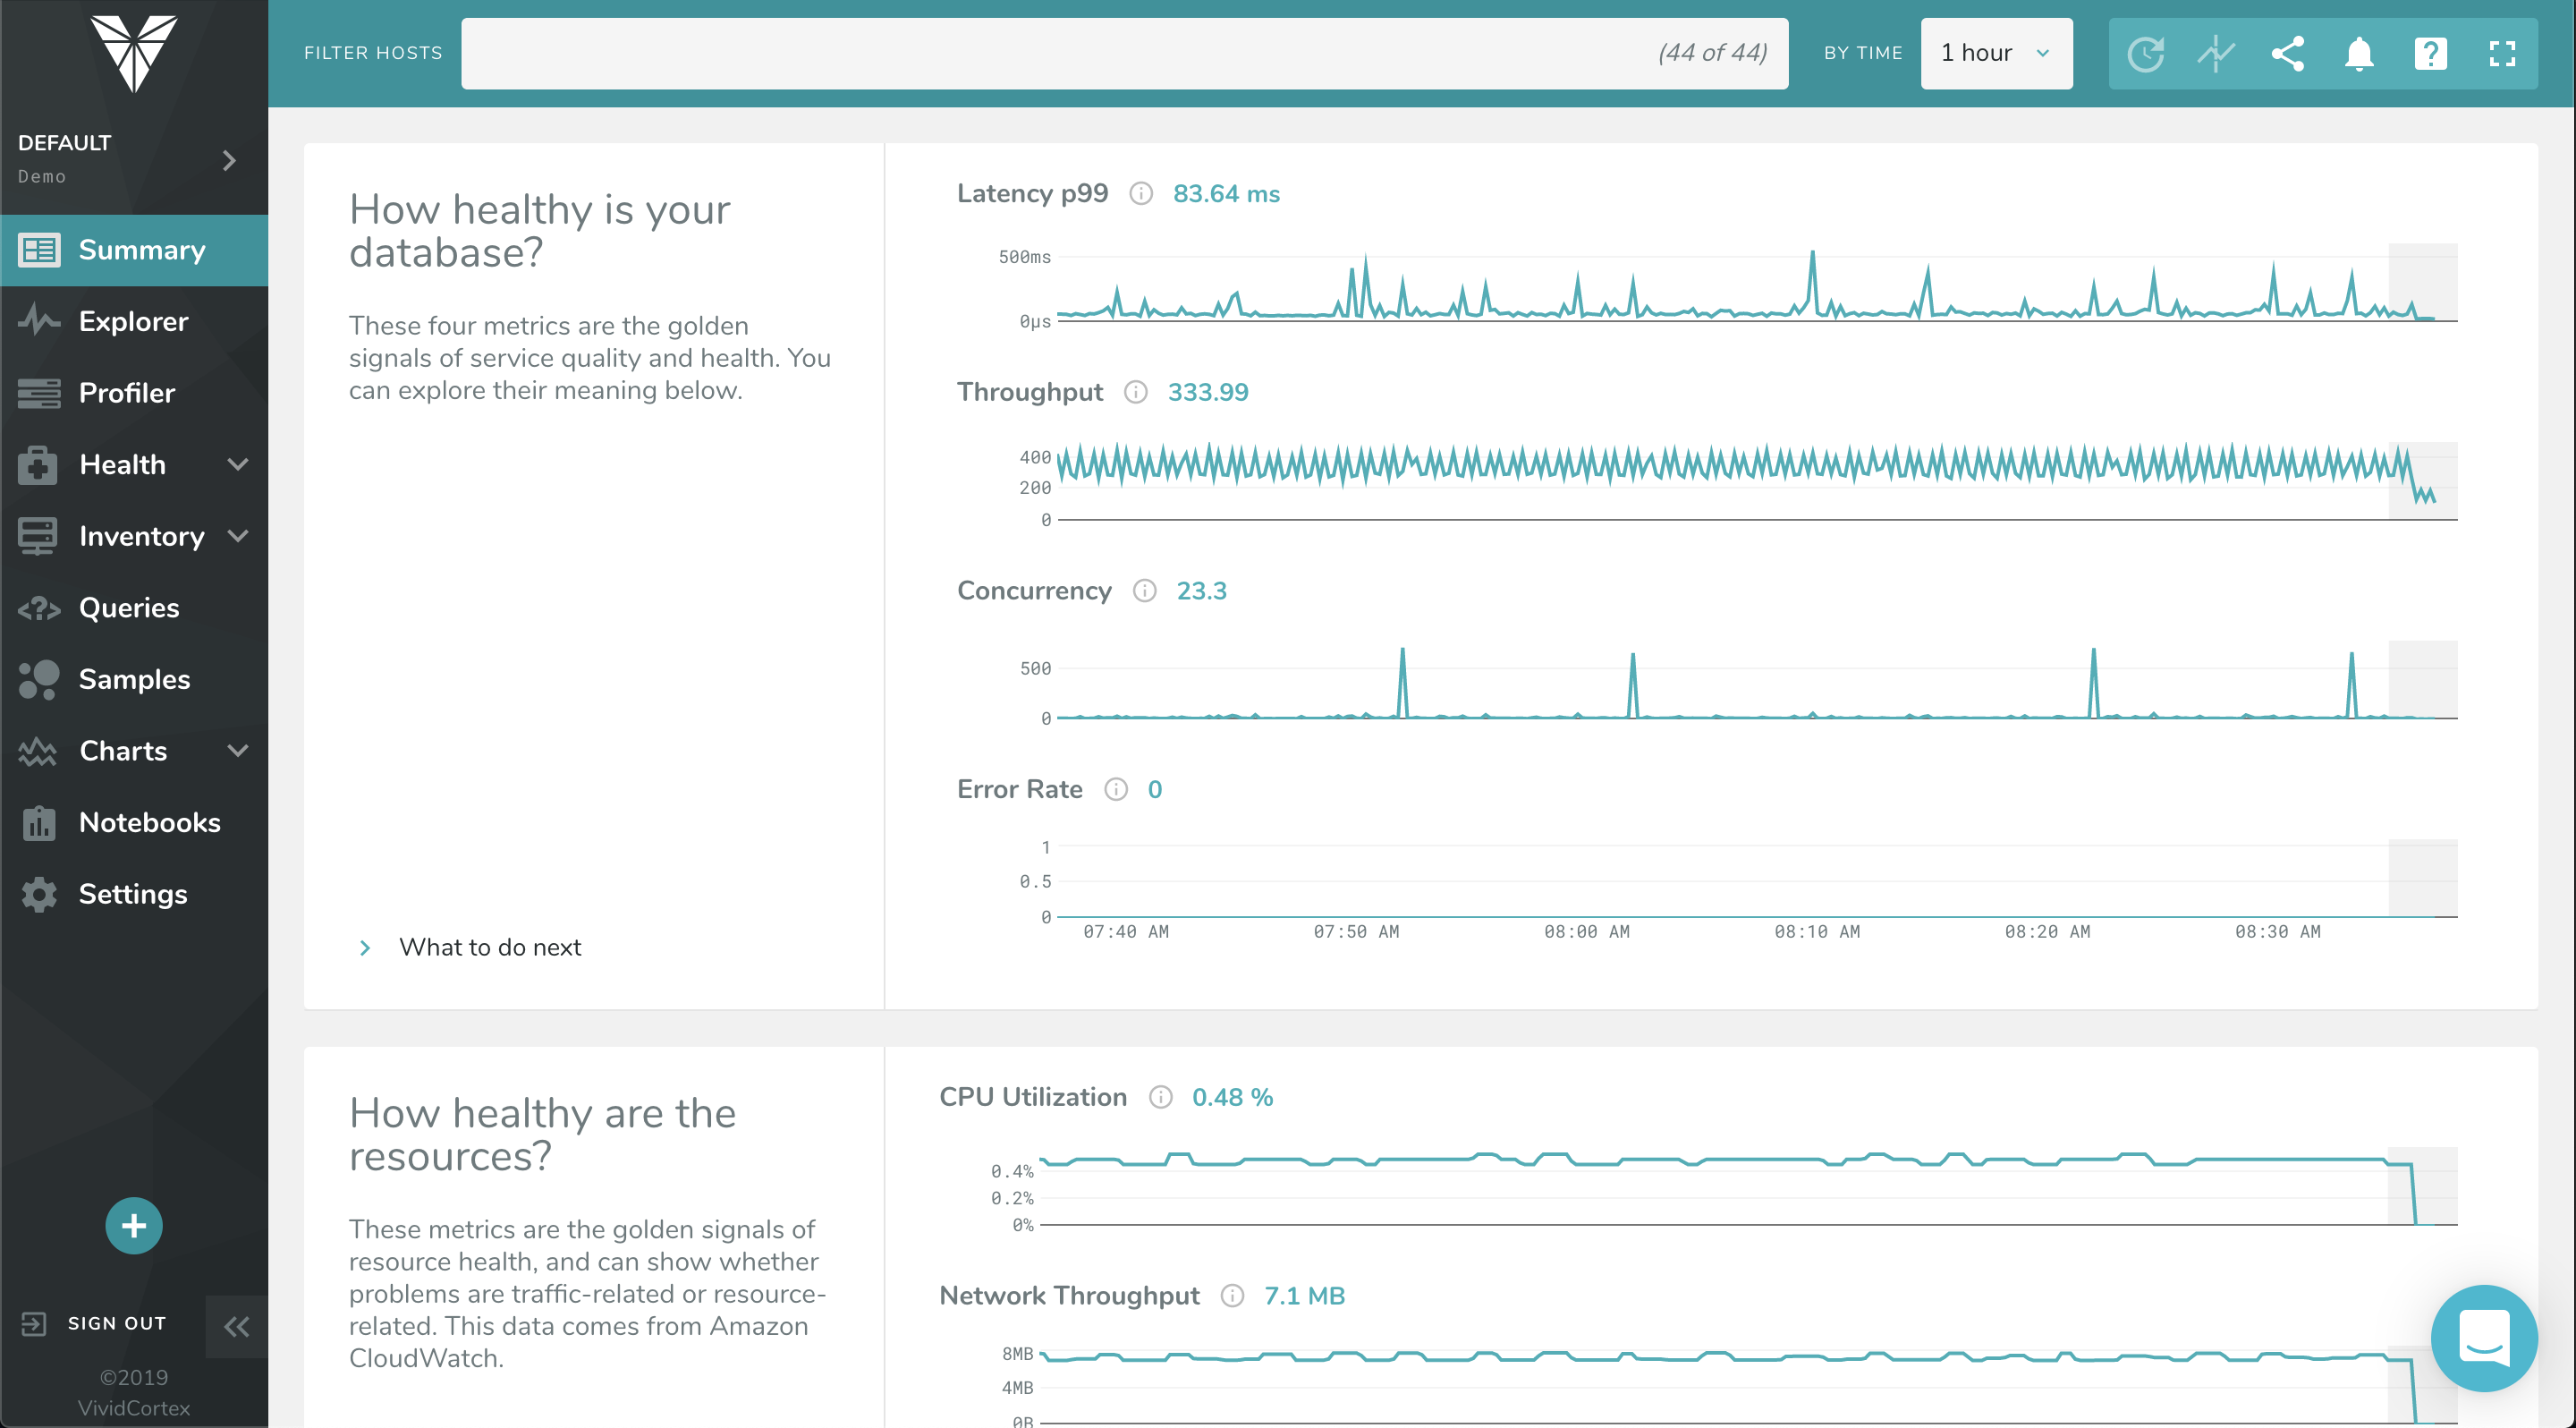
Screenshot of The Profiler Dashboard is a powerful, dynamic dashboard for ranking and filtering activity on your servers: It can instantly show you what needs attention and it provides a unified view of all your database types that VividCortex monitors. It enables you to view and understand your system by profiling it according to its most significant attributes—customized and selected by you.Screenshot of This dashboard displays a list of queries and allows you to filter them with powerful specificity. Filters can be set according to query text, host, and timeframe when the query was first seen / last active.Screenshot of VividCortex captures an enormous amount of data, and the Summary Dashboard helps users make sense of it, reducing their time-to-insight. It features widgets with automatic displays for Top 5 Queries by Total Time, Top 5 Queries by User CPU, Application Overview, Critical Events, and more.Screenshot of VividCortex monitors thousands of metrics in your system, and the Charts and Dashboard’s navigation pane allows you to toggle, customize, and enable various categories of generated charts. You can then easily navigate and examine the charts’ metrics with mouseover and zoom capabilities.