Airbrake vs. New Relic

Overview
ProductRatingMost Used ByProduct SummaryStarting Price
Airbrake
Score 8.0 out of 10
N/A
Airbrake, now from LogicMonitor (acquired February 2021) is an error monitoring and performance insight tool. Airbrak offers real-time error alerts, rich contextual data about why errors are occurring, integration into an existing workflow, and application performance insights to enable users to identify, diagnose, and fix problems - before users get annoyed.
$0
per month
New Relic
Score 7.9 out of 10
N/A
New Relic is a SaaS-based web and mobile application performance management provider for the cloud and the datacenter. They provide code-level diagnostics for dedicated infrastructures, the cloud, or hybrid environments and real time monitoring.
$0
No credit card required; 100 GB free ingest per month, 1 free full user + unlimited basic users, 8 days retention, 100 Synthetics Checks
Pricing
AirbrakeNew Relic
Editions & Modules
Free
$0
per month
Basic
$19
per month
Pro
$38
per month
Free (Forever)
$0
No credit card required; 100 GB free ingest per month, 1 free full user + unlimited basic users, 8 days retention, 100 Synthetics Checks
Telemetry Data Platform
$0.25
per month per extra GB data ingest (after first free 100GB per month)
Incident Intelligence
$0.50
per month per event (after first 1000 free events per month)
Standard
$99
per month per full user (after first free full user - unlimited free basic users)
Pro
Contact sales team
Enterprise
Contact sales team
Offerings
Pricing Offerings
AirbrakeNew Relic
Free Trial
YesNo
Free/Freemium Version
YesYes
Premium Consulting/Integration Services
NoNo
Entry-level Setup FeeNo setup feeNo setup fee
Additional DetailsAirbrake offers plans that include up to 200M errors, plus unlimited on-demand errors. Start your free trial and find the plan that right for your needs. 10% discount available for annual pricing.
More Pricing Information
Community Pulse
AirbrakeNew Relic
Considered Both Products
Airbrake
Chose Airbrake
We use them in combination but I would say it’s the exception and stick trace details and the focus on that.
Chose Airbrake
I love to use Airbrake and New Relic in conjunction. New Relic has better metrics and data that you can really dig into (especially for optimizations), but the error part has always been kinda meh. I fee like Airbrake has done an awesome job at this!
Chose Airbrake
There is too much info available in Datadog so finding errors sometimes becomes harder.
Chose Airbrake
I chose Airbrake over Sentry and Rollbar primarily because I’m most familiar with Airbrake, I’ve been using it for many years now so it’s well-established and I know what I’m getting and that it works.
Chose Airbrake
We use Airbrake alongside monitoring and alerting platforms. Airbrake is good for tracking small bugs down but it would be nice if it integrated more seamlessly with other performance monitoring platforms.
Chose Airbrake
Airbrake boasts a beautiful user interface that gives easy access to features such as intelligent error grouping and application insights, session details, and backtraces. All these allow you to squash those bugs at a much faster pace.
Chose Airbrake
Airbrake was chosen prior to those systems and prior to my start at the company so I don't know the reasons for choosing it.
New Relic
Chose New Relic
Prometheus, Grafana, Grafana Loki and Elasticsearch
Chose New Relic
New Relic has full stack visibility and gives us all options for observability like one stop shop. It gives you front end, backend as well synthetic monitoring capabilities.

Every other feature built into one cost model (usually) which ties to data that you send, it helps you …
Chose New Relic
New Relic stood out to us primarily because of its all-in one approach, combining APM, infra monitoring, logs and alerts in single platform. Compared to other tools we evaluated, if offered a smoother on boarding experience and required less stitching together of different …
Chose New Relic
Less expensive than datadog and sentry with almost everything we need. Less effort to set up and maintain than elastic search and kibana so saved a ton on engineering bandwidth which would have otherwise been lost.
Chose New Relic
Solarwinds was good until they migrated to a new kind of offering and discounting the old product making it more expensive and less flexible for our specific use-case.
The free trial also helped me try and get started without needing to commit.
I think right now New Relic is the …
Chose New Relic
New Relic is the easiest to adopt, the price is in line with the other tools, and it has the lowest threshold to cross in order to learn the system and the platform. Adopting OpenTelemetry has been helpful in getting data aligned, and their documentation has been sufficient for …
Chose New Relic
The New Relic Platform addresses this challenge with the new plugin architecture. Plugins provide a way to monitor each of these technologies, extending the New Relic interface with custom-made dashboards specific to each. They pair the reporting of metrics specific to the …
Chose New Relic
We selected TrackJS for error monitoring and New Relic for site speed monitoring. TrackJS is a much easier to use tool for JS error monitoring, so we never ended up consolidating tools or moving over to New Relic permanently. We use New Relic for site speed monitoring and …
Chose New Relic
New Relic is the most full-featured offering that we've found, and is incredibly easy to start using with a PHP app. The New Relic agent is installed as a PHP extension so it is able to monitor and track the performance of any PHP app being run by the web server. Other tools …
Chose New Relic
At the time, we selected New Relic for the broad coverage it could provide over our landscape.
Chose New Relic
New Relic is used by developers and support teams at our organisation - Splunk is used more in security monitoring by our SecOps team - not sure how they might compare doing the same job
Chose New Relic
Similar features, the New Relic data ingestion costs are better and UI better as well
Chose New Relic
New Relic in my opinion is a lot better than a tool like Datadog and Splunk. Cost in my opinion is the biggest concern.
Chose New Relic
The overlap is not large, but the one advantage of the speed curve is retention: data is available permanently, which allows you to investigate the hypothesis with data collected before formulating the hypothesis. This has proven very effective for us.
Chose New Relic
10 years ago we used AppDynamics onpremise but the cost was too high and we migrated to New Relic, more economical and modern

Chose New Relic
New Relic's APM is better than Datadog's. It has better traces and dashboards. The Apdex-based alerts are accurate and work predictably even at a large scale. However, New Relic can become expensive as the volume of data ingested grows. Datadog has better dashboards and …
Chose New Relic
PRTG and Nagios are decent products themselves; however, when compared to New Relic, they fell short on all fronts. New Relic provided a wide variety of features that the other tools didn't provide. Adding\removing devices in New Relic was quite easy and can be done with a few …
Chose New Relic
New Relic has been DevOps and Developer friendly to onboard and use. Also pricing-wise, it is one of the best in terms of ROI. There are few features better in other APM solutions but New Relic is working on new features faster recently.
Chose New Relic
New Relic has a native integration with the IaaS service that the company utilizes which made it very easy to set up, integrate, and it also has consolidated billing with that IaaS service which is a big plus for the organization. After evaluating, I also thought it had the …
Chose New Relic
We selected New Relic since it was very dynamic and versatile to use. It works well in all aspects of monitoring, and observability and would allow having a focus on collaboration with different repeatable processes. Also, New Relic has a good focus on working well with CLI, …
Best Alternatives
AirbrakeNew Relic
Small Businesses
GitLab
GitLab
Score 8.7 out of 10
InfluxDB
InfluxDB
Score 8.8 out of 10
Medium-sized Companies
GitLab
GitLab
Score 8.7 out of 10
Logz.io
Logz.io
Score 7.0 out of 10
Enterprises
GitLab
GitLab
Score 8.7 out of 10
NetBrain Technologies
Score 9.2 out of 10
All AlternativesView all alternativesView all alternatives
User Ratings
AirbrakeNew Relic
Likelihood to Recommend
7.9
(0 ratings)
6.6
(0 ratings)
Likelihood to Renew
-
(0 ratings)
9.0
(0 ratings)
Usability
-
(0 ratings)
8.8
(0 ratings)
Availability
-
(0 ratings)
9.1
(0 ratings)
Performance
-
(0 ratings)
8.2
(0 ratings)
Support Rating
-
(0 ratings)
7.5
(0 ratings)
Implementation Rating
-
(0 ratings)
8.0
(0 ratings)
Configurability
-
(0 ratings)
9.1
(0 ratings)
Ease of integration
-
(0 ratings)
9.1
(0 ratings)
Product Scalability
-
(0 ratings)
9.1
(0 ratings)
Vendor post-sale
-
(0 ratings)
9.1
(0 ratings)
Vendor pre-sale
-
(0 ratings)
7.3
(0 ratings)
User Testimonials
AirbrakeNew Relic
Likelihood to Recommend
Airbrake is very good at what it does, I don’t really have any criticism at all on that front. It’s less well-suited when bugfixing goes beyond the immediate error and means looking at a lot of context (particularly asynchronous context) like logs.
Read full review
It is perfect for observing our energy platforms during high-load situations, such as grid demand spikes, or our real-time ingest of sensor data, allowing us to respond in real time to anomalies. And it’s a good way to monitor API performance in client dashboards, too. But it’s not as conducive for low-budget/low-code work or deep customization that doesn’t get ample development support given its complexity and expense.
Read full review
Pros
  • Integration with most of languages and frameworks as well support via existing logging configs.
  • Aggregations on occurrences which helps to understand and analyse issues better.
  • Web UI displays all error related parameters which I never could have figured out in manual debugging.
Read full review
  • Capturing Front end Metrics specially web vitals and setting up alerts for violations really helps.
  • NRQL is great tool to fetch the data you need. With queries you can pull the data and put the data by table or by chart. You can even trend graphs and create dashboards.
  • Synthetic Monitoring is very helpful for proactive monitoring. You can use it for user journeys by using scripted browser monitor type or just check availability using PING type.
  • ASk AI is great addition that can fetch details you need with natuaral language
Read full review
Cons
  • We use Airbrake in conjunction with OpsGenie, but I feel like there could be more room for integration between the two.
  • I think it would also be nice if there was a GitHub integration that would comment on recently merged error-prone PRs, currently, we need to dig into the error to find the commit.
  • Generally, more integrations would be nice as people often forget about Airbrake when they are stressed out about an issue.
Read full review
  • Support for SQL like query with more functional features of analysis while viewing distributed tracing.
  • support for very low level specific integration from APIs to classes to functions to piece of code
  • More detailed documentation, as we faced issues while integrating for the first time.
Read full review
Likelihood to Renew
No answers on this topic
I have not yet found any similar product that offers me this range of features to help us keep our online service fast and reliable. Besides this, New Relic is constantly evolving by adding new plugins to emerging technologies and platforms. Server performance measuring features are a key point as our user database grows.
Read full review
Usability
No answers on this topic
New Relic helps in observability setup for the critical environments and getting known about the issues and troubleshoot the applications and services. Alerts helps in knowing the abnormal state of the system and services, Dashboards are used for visualizing the key metrics and muting the unwanted notifications and dropping the extra data from the source.
Read full review
Reliability and Availability
No answers on this topic
Never observed an outage
Read full review
Performance
No answers on this topic
Always responsive. Never observed slow page loads
Read full review
Support Rating
No answers on this topic
The support team has been really helpful and resolved most of the issues on time. However, for a couple of issues, several follow-ups were needed to elicit a reasonable response. The issue was deeply technical and could have been investigated only by their Architects, and bringing them into the ticket took longer than needed
Read full review
Implementation Rating
No answers on this topic
The documentation was clear and concise; the only issue we ran into was custom application naming. Due to HTTPD mod_fcgid and the need for the application name to be set in php.ini (not in .htaccess or the virtual host directive) ... we had issues setting this up.
Read full review
Alternatives Considered
I love to use Airbrake and New Relic in conjunction. New Relic has better metrics and data that you can really dig into (especially for optimizations), but the error part has always been kinda meh. I fee like Airbrake has done an awesome job at this
Read full review
Its covers all the observability aspects as well as giving us more competitive pricing models compared to other providers that's why I like to use New Relic in place of other tools. And also it introduces new Agentic AI features as well as it adopts AI in its RCA. As an observability tool it should reduce the RCA of any problem and New Relic is continuously focusing on that that's why I am preferring New Relic in place of other tools.
Read full review
Scalability
No answers on this topic
Agent deployment is easily integrated into our workflow. Adding the agent to new servers is quick and painless
Read full review
Return on Investment
  • Hugely reduced frontend errors in devices we don’t often test: means more conversions and sales
  • Lets us know immediately when there is an error: shorter error durations also means higher sales
  • Ultimately once we’ve solved all the most common bugs: more time for developers to focus on other things
Read full review
  • We were able to quickly identify our most time consuming APIs. In some cases we were able to bring down times for some apis from 4s to 200ms.
  • We were able to identify our slowest database queries and optimize them for quicker response times.
Read full review
ScreenShots

Airbrake Screenshots

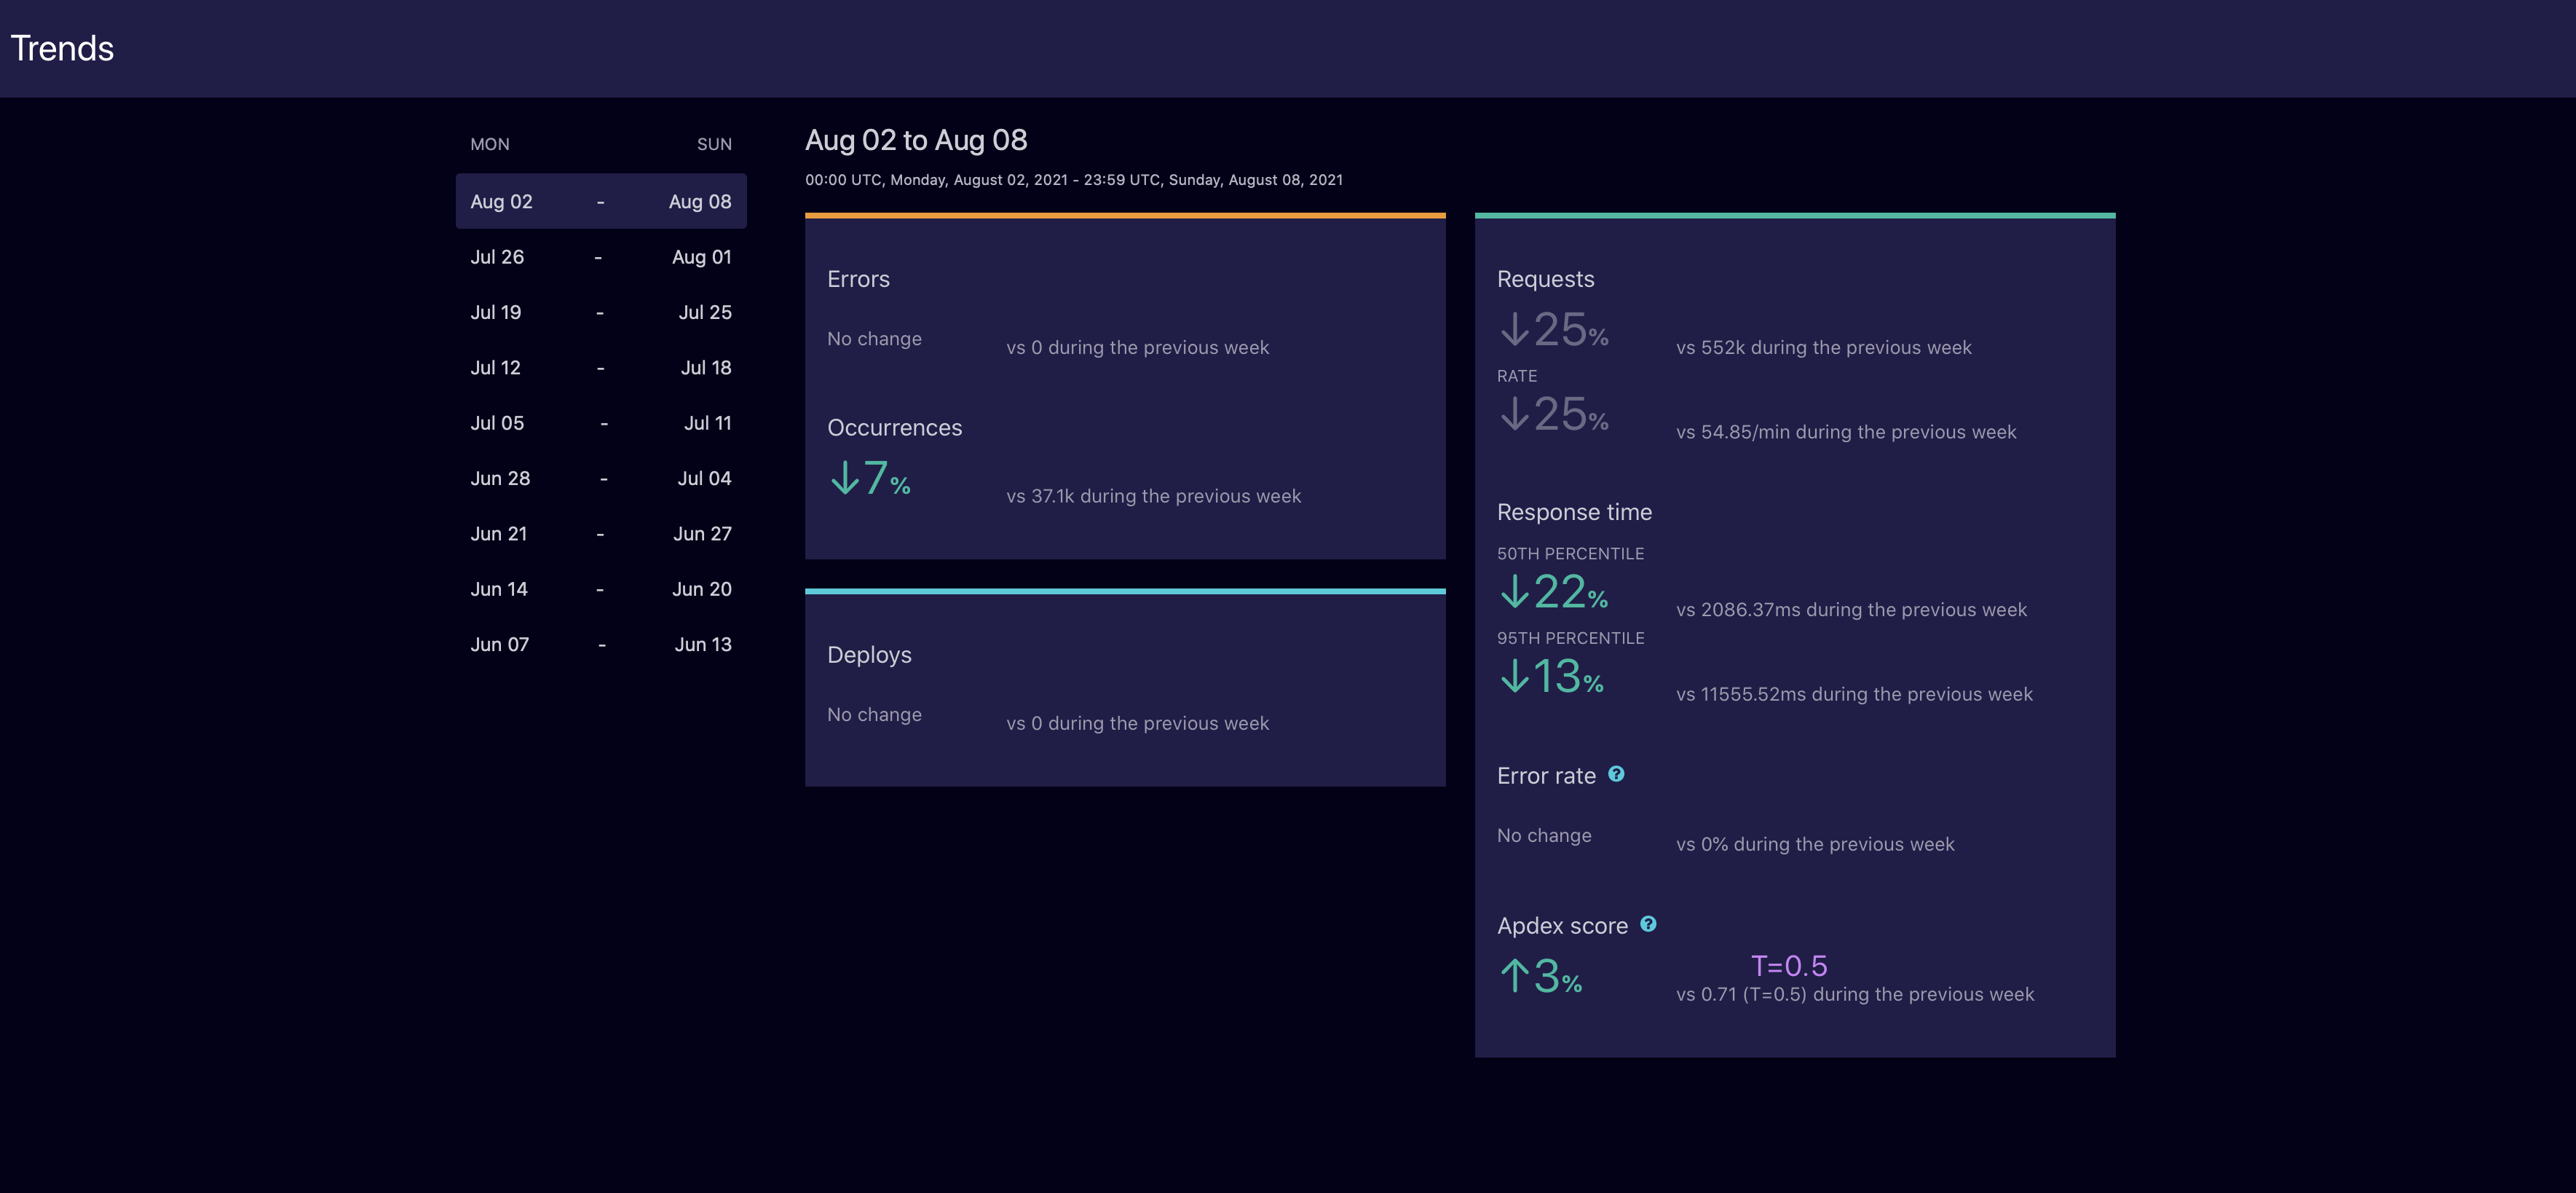
Screenshot of Airbrake Account DashboardScreenshot of Deploys DashboardScreenshot of Performance DashboardScreenshot of Trends TabScreenshot of Breadcrumbs feature