Altair SLC (formerly the WPS industrial analytics platform, acquired by Altair in late 2021) is designed for data science and heavyweight data processing with the languages of SAS and R. Best known for its SAS language compiler, the software includes advanced graphical user interfaces, robust, high-performance data processing and production-ready application frameworks.
N/A
Posit
Score 10.0 out of 10
N/A
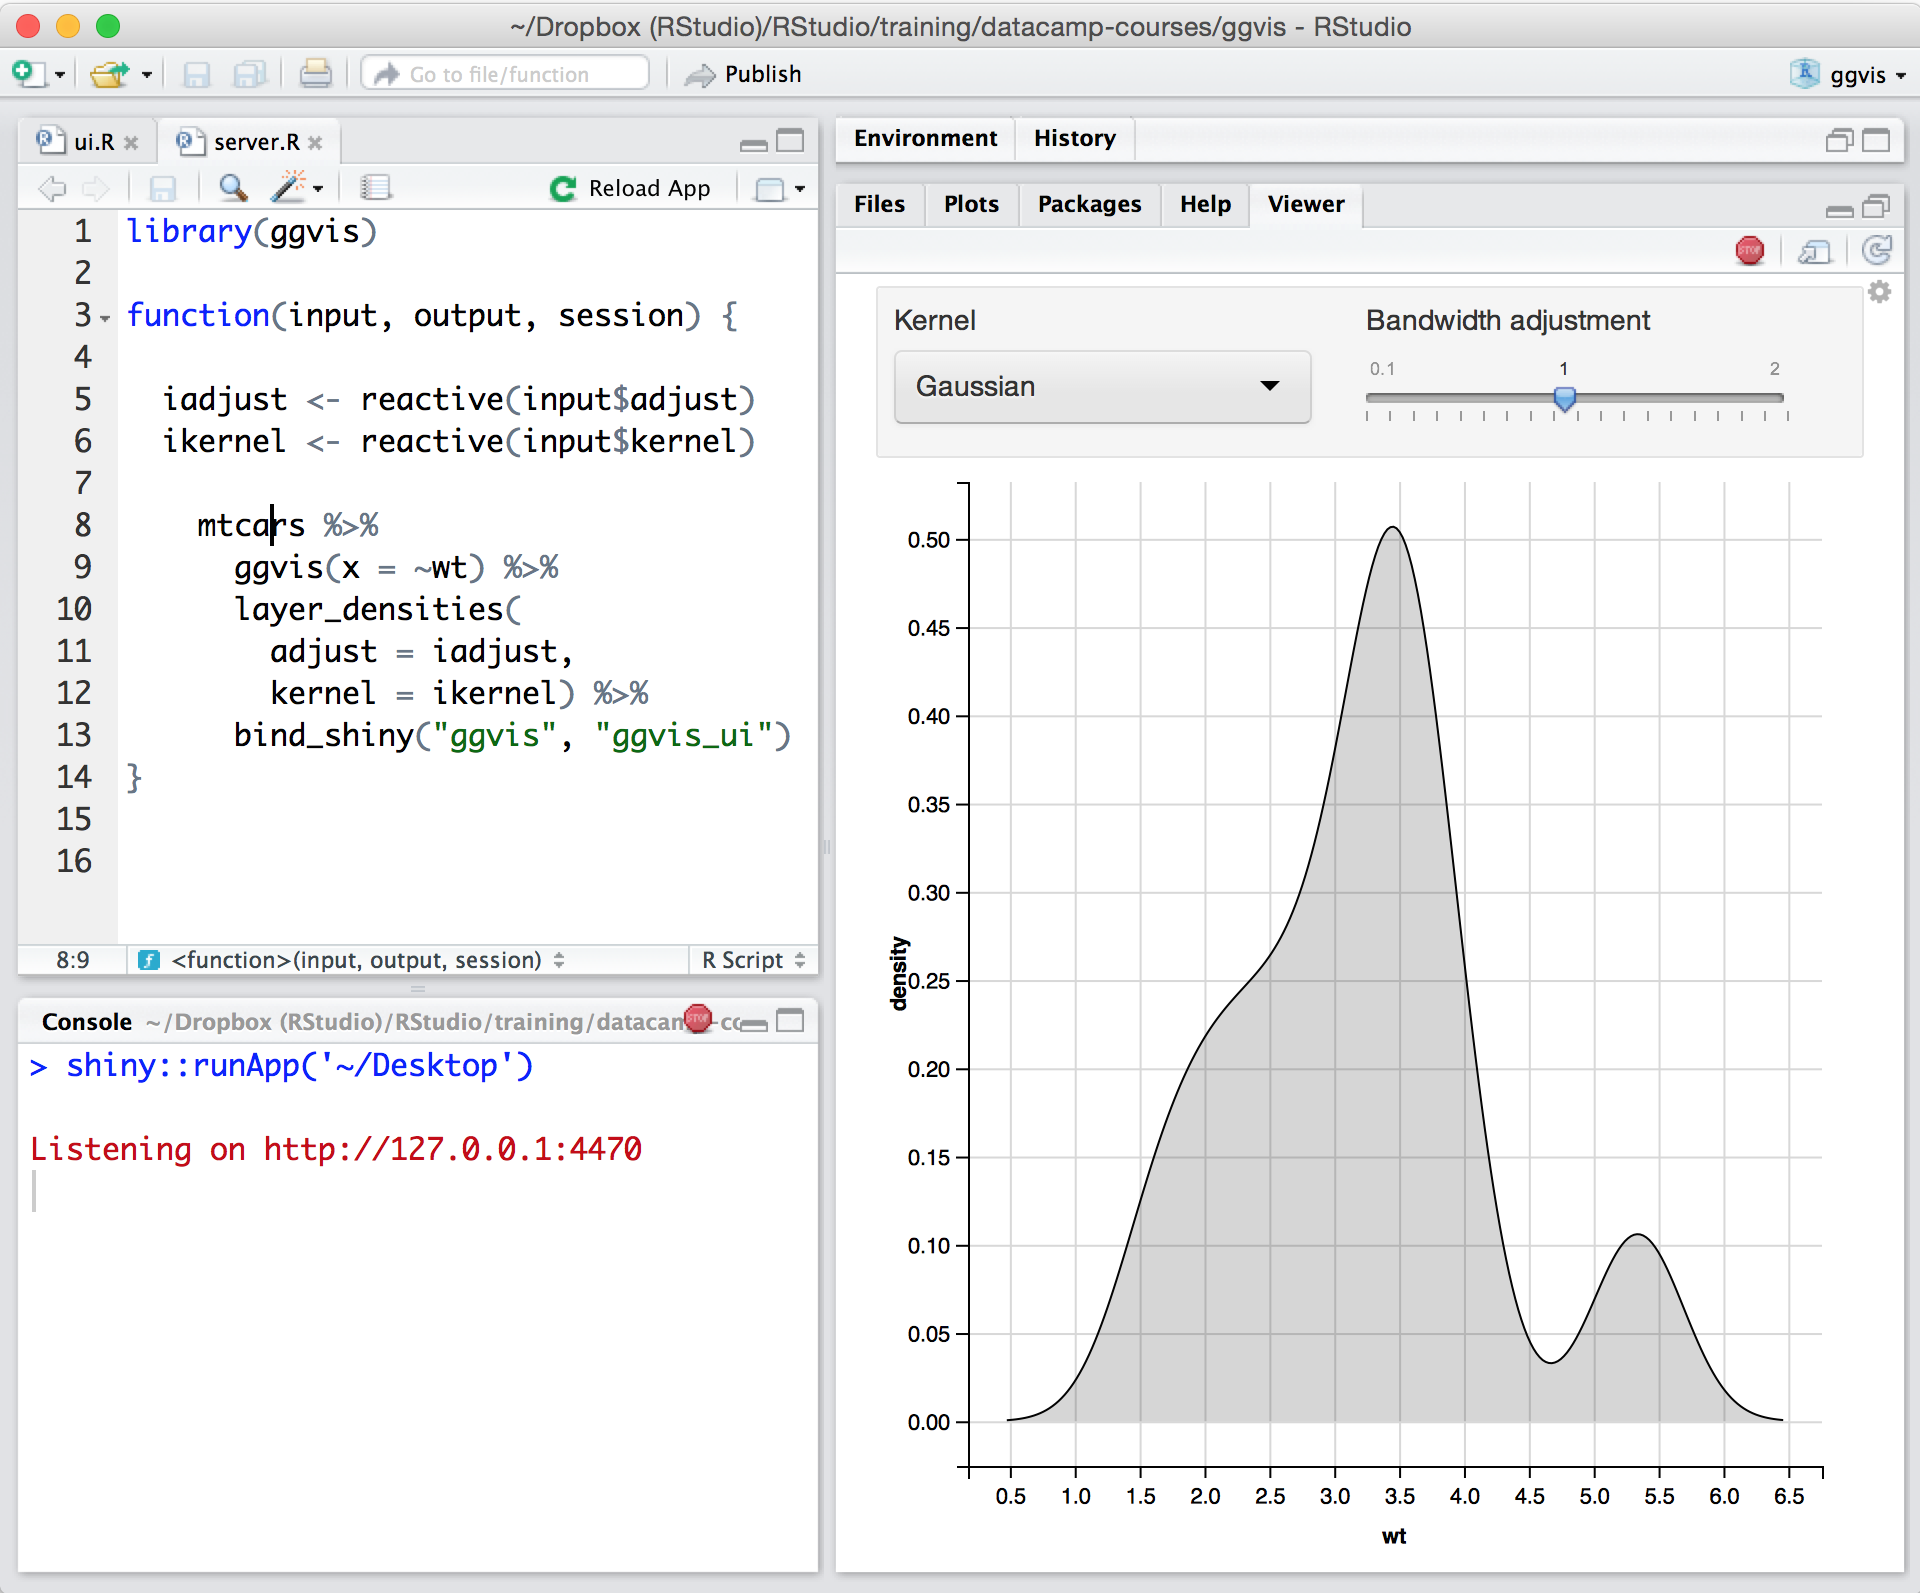
Posit, formerly RStudio, is a modular data science platform, combining open source and commercial products.
N/A
Pricing
Altair SLC
Posit
Editions & Modules
No answers on this topic
No answers on this topic
Offerings
Pricing Offerings
Altair SLC
Posit
Free Trial
Yes
Yes
Free/Freemium Version
Yes
Yes
Premium Consulting/Integration Services
No
No
Entry-level Setup Fee
Optional
Optional
Additional Details
—
—
More Pricing Information
Community Pulse
Altair SLC
Posit
Features
Altair SLC
Posit
BI Standard Reporting
Comparison of BI Standard Reporting features of Product A and Product B
Altair SLC
8.6
Ratings
2% above category average
Posit
-
Ratings
Customizable dashboards
8.60 Ratings
00 Ratings
Ad-hoc Reporting
Comparison of Ad-hoc Reporting features of Product A and Product B
Altair SLC
8.6
Ratings
8% above category average
Posit
-
Ratings
Drill-down analysis
8.60 Ratings
00 Ratings
Formatting capabilities
8.60 Ratings
00 Ratings
Integration with R or other statistical packages
8.60 Ratings
00 Ratings
Report Output and Scheduling
Comparison of Report Output and Scheduling features of Product A and Product B
Altair SLC
8.8
Ratings
4% above category average
Posit
-
Ratings
Publish to Web
8.60 Ratings
00 Ratings
Publish to PDF
8.60 Ratings
00 Ratings
Report Delivery Scheduling
9.30 Ratings
00 Ratings
Data Discovery and Visualization
Comparison of Data Discovery and Visualization features of Product A and Product B
For now coders, I would emphasize them to use drag and drop functionality. Otherwise, WPS Analytics is a robust tool for app development and data visualization that offers multiple languages such as SAS, SQL, R, and Python.
In my humble opinion, if you are working on something related to Statistics, RStudio is your go-to tool. But if you are looking for something in Machine Learning, look out for Python. The beauty is that there are packages now by which you can write Python/SQL in R. Cross-platform functionality like such makes RStudio way ahead of its competition. A couple of chinks in RStudio armor are very small and can be considered as nagging just for the sake of argument. Other than completely based on programming language, I couldn't find significant drawbacks to using RStudio. It is one of the best free software available in the market at present.
Ability to scale across the company is limited based on the users license, cannot share a dashboard to the general view of the company.
Ability to retain session - not simple method to customize view per user (e.g., once session is ended, the users will return next time to the baseline view).
Ability to enable communication between multiple users - leave notes, tag other users, or share specific view.
There is no other platform that meets our needs. Even if it was terrible we would still use it but fortunately for us it is a very solid project with a great support team. I hope in the future to expand our use and get more licences as well as upgrade to RStudio workbench but for now we are very happy.
For someone who learns how to use the software and picks up on the "language" of R, it's very easy to use. For beginners, it can be hard and might require a course, as well as the appropriate statistical training to understand what packages to use and when
RStudio is very available and cheap to use. It needs to be updated every once in a while, but the updates tend to be quick and they do not hinder my ability to make progress. I have not experienced any RStudio outages, and I have used the application quite a bit for a variety of statistical analyses
Since R is trendy among statisticians, you can find lots of help from the data science/ stats communities. If you need help with anything related to RStudio or R, google it or search on StackOverflow, you might easily find the solution that you are looking for.
To better understand the data I work with, I extensively use the data discovery and visualization tools available on my workstations, and I always go for the best. Unfortunately, some other tools does not offer any tutorials for the features, making it difficult and time-consuming to analyze data, mainly after it has been implemented. In addition to videos and articles, WPS Analytics provides comprehensive tutorials for each feature.
RStudio was provided as the most customizable. It was also strictly the most feature-rich as far as enabling our organization to script, run, and make use of R open-source packages in our data analysis workstreams. It also provided some support for python, which was useful when we had R heavy code with some python threaded in. Overall we picked Rstudio for the features it provided for our data analysis needs and the ability to interface with our existing resources.
I think that RStudio scales pretty well based on the size of the datasets I'm using. It has multithreading capabilities unlike some other statistical analysis programs which is very useful in cutting down on time. The format of RStudio's syntax also makes it very easy to replicate regardless off the scale of the analysis and data set
Using it for data science in a very big and old company, the most positive impact, from my point of view, has been the ability of spreading data culture across the group. Shortening the path from data to value.
Still it's hard to quantify economic benefits, we are struggling and it's a great point of attention, since splitting out the contribution of the single aspects of a project (and getting the RStudio pie) is complicated.
What is sure is that, in the long run, RStudio is boosting productivity and making the process in which is embedded more efficient (cost reduction).