
Chose Databox
In comparison, Databox has been a more robust solution and one that works really well with HubSpot (our preferred marketing automation platform). It's a bit pricier than Cyfe was (not sure now), but the features are worth it.

| Product | Rating | Most Used By | Product Summary | Starting Price |
|---|---|---|---|---|
 Databox | N/A | Databox is business intelligence software built for teams that need fast, actionable insights. | $199 per month | |
 Epicor Grow | Small Businesses (1-50 employees) | Grow, from Epicor since the March 2022 acquisition, is a business intelligence software that is designed to empower businesses to become data-driven and accelerate growth by aligning team objectives and inspiring strategic decisions. | N/A |
| Databox | Epicor Grow | |||||||||||||||
|---|---|---|---|---|---|---|---|---|---|---|---|---|---|---|---|---|
| Editions & Modules |
| No answers on this topic | ||||||||||||||
| Offerings |
| |||||||||||||||
| Entry-level Setup Fee | No setup fee | Required | ||||||||||||||
| Additional Details | 20% discount for annual pricing. | — | ||||||||||||||
| More Pricing Information | ||||||||||||||||
| Databox | Epicor Grow | |
|---|---|---|
| Considered Both Products |  Databox Chose Databox In comparison, Databox has been a more robust solution and one that works really well with HubSpot (our preferred marketing automation platform). It's a bit pricier than Cyfe was (not sure now), but the features are worth it.  Michael Glover Content Marketer Chose Databox Much cheaper and seems to do at least as good of a job while having a similar integration stack. I also appreciate the efforts Databox go to on their blog and podcast to help educate people on all things data and metrics.  Heather Robinette, MBA Marketing Manger Chose Databox While HubSpot is where we store our information and utilize the systems, the reporting wasn't deep enough and it didn't include the entire website since it is hosted elsewhere. So I started looking at options, and Databox came as a recommendation so I checked it out and haven't …  Stephanie Tran Sales System Architect Chose Databox HubSpot's reporting tool simply isn't enough. It also doesn't help that the reporting add-on for HubSpot is an additional $200/month, and it only reports on HubSpot stuff. That's why we selected Databox--to report on other platforms like FB ads, Google Analytics, etc. However, …  Eric Pratt Managing Partner Chose Databox Databox is easier to set up and is much less costly.  Daniel Berry SEO Strategy Specialist Chose Databox Databox is unique in its ability to report from multiple data sources. Google Analytics is the standard when it comes to web metrics, but it's just one of the tools that integrates with Databox. Tableau is fantastic for data visualizations and reporting, but it's much more … | Epicor Grow  Haleigh Doherty Demand Gen Ops Manager Chose Epicor Grow Grow is above and beyond using google sheets for data analysis. There really is no comparison to the ability to access, analyze and report on data in Grow versus in Google sheets. The metrics are also great, the graphs are easily created and understandable. They are also easily …  Thomas (TC) Riley Director, Analytics Chose Epicor Grow Grow doesn't have as many advanced analytics features and other capabilities as some other 'dashboard' platforms on the market. Simply, if you want a tool for internal use only that has high-level analytics capabilities (regressions, completely custom visualizations, modeling), …  Ian Nate Digital Marketing Operations Manager Chose Epicor Grow I've used all three products listed, and Salesforce really lacks even with their own reports. We started using Grow almost exclusively for displaying and visualizing Salesforce data. At a previous company, we used Geckoboard, which I would consider more of a direct competitor. …  Thomas Soerenes Marketing Communication Specialist Chose Epicor Grow Google Analytics only shows one side of the story. With Grow.com we are able to look at data from many angles.  Kyle Garrett Marketing and Sales Operations Chose Epicor Grow Grow.com has the easiest to use UI/UX out of the other business intelligence tools that I have used. It is a little more intuitive and takes less knowledge of SQL to really get what you want. The pre-built metrics really help to get up and going right out of the box, where …  Grant Rust President / CEO Chose Epicor Grow Grow was a much better fit for our organization: Simple deployment Feature rich  Dave Moll Digital Marketing Manager Chose Epicor Grow We needed a tool that had more connections than Don King. And that tool is Grow.  Gregory Phillips Chief Technology Officer Chose Epicor Grow I initially selected Grow because it was integrated with our CRM (ProsperWorks) and allowed me to use SQL to query that data. I've stuck with it because it supports many of the other data sources we are interested in pulling data from and gives us a lot of flexibility in doing …  Matthew Racz Co-Founder and Chief Operating Officer | Crowdfunding Advisor Chose Epicor Grow I think Grow stacks up really well, and to be honest, we have not done a deep dive into competitors.  Nathan McClellan Vice President International Operations Chose Epicor Grow When I looked at other solutions I found that the setup costs would have been tens of thousands of dollars. With Grow I can do it myself.  Jolijt Tamanaha CMO & CFO Chose Epicor Grow Geckoboard and hacking it together with Google Sheets. Neither let's you do as much and neither is as pretty.  Rod Austin Director of Marketing Chose Epicor Grow Blew the doors off in terms of simplicity and support when getting started.  Nate Shaw COO Chose Epicor Grow Grow is the first product of this type which I have utilized at any significant level.  Michael T. Collard Portfolio Accountant Chose Epicor Grow We've used several Google Docs as our own dashboarding platform. Integration was ok but not nearly as clean as grow. Implementation was slightly easier if you were familiar with Excel though.  Logan Leaming Controller Chose Epicor Grow We chose Grow because of how economical it was in comparison. It was a great decision because we got what we needed and didn't have to pay even close to what we would have with other companies.  Jeffery Arnold President Chose Epicor Grow We looked at quite a few different providers (I honestly cannot recall the names) but ended up utilizing Grow based upon initial conversations.  Srini Kanchinatham NetSuite Solution Architect Chose Epicor Grow Before Grow we chose iCharts and developed all charts in iCharts. But it is very difficult to develop charts in iCharts and also we cannot display those charts on TV monitors continuously. That is when we looked into Grow and we have been using Grow since then. |
| Databox | Epicor Grow | ||||||||||||||||||
|---|---|---|---|---|---|---|---|---|---|---|---|---|---|---|---|---|---|---|---|
| BI Standard Reporting |
| ||||||||||||||||||
| Ad-hoc Reporting |
| ||||||||||||||||||
| Report Output and Scheduling |
| ||||||||||||||||||
| Data Discovery and Visualization |
| ||||||||||||||||||
| Access Control and Security |
| ||||||||||||||||||
| Mobile Capabilities |
| ||||||||||||||||||
| Application Program Interfaces (APIs) / Embedding |
|
| Databox | Epicor Grow | |
|---|---|---|
| Small Businesses |  BrightGauge Score 9.1 out of 10 | BrightGauge Score 9.1 out of 10 |
| Medium-sized Companies |  Reveal Score 10.0 out of 10 | Reveal Score 10.0 out of 10 |
| Enterprises |  Kyvos Semantic Intelligence Layer Score 9.9 out of 10 | Kyvos Semantic Intelligence Layer Score 9.9 out of 10 |
| All Alternatives | View all alternatives | View all alternatives |
| Databox | Epicor Grow | |
|---|---|---|
| Likelihood to Recommend | 8.0 (0 ratings) | 8.0 (0 ratings) |
| Usability | 9.0 (0 ratings) | 7.1 (0 ratings) |
| Support Rating | 9.8 (0 ratings) | 9.4 (0 ratings) |
| Databox | Epicor Grow | |
|---|---|---|
| Likelihood to Recommend |
Daniel Berry SEO Strategy Specialist |
|
| Pros |
Michael Glover Content Marketer |
Matthew Racz Co-Founder and Chief Operating Officer | Crowdfunding Advisor |
| Cons |
|
Ian Nate Digital Marketing Operations Manager |
| Usability |
|
|
| Support Rating |
Heather Robinette, MBA Marketing Manger |
|
| Alternatives Considered |
Heather Robinette, MBA Marketing Manger |
Thomas (TC) Riley Director, Analytics |
| Return on Investment |
|
Haleigh Doherty Demand Gen Ops Manager |
| ScreenShots | Databox Screenshots      | Epicor Grow Screenshots  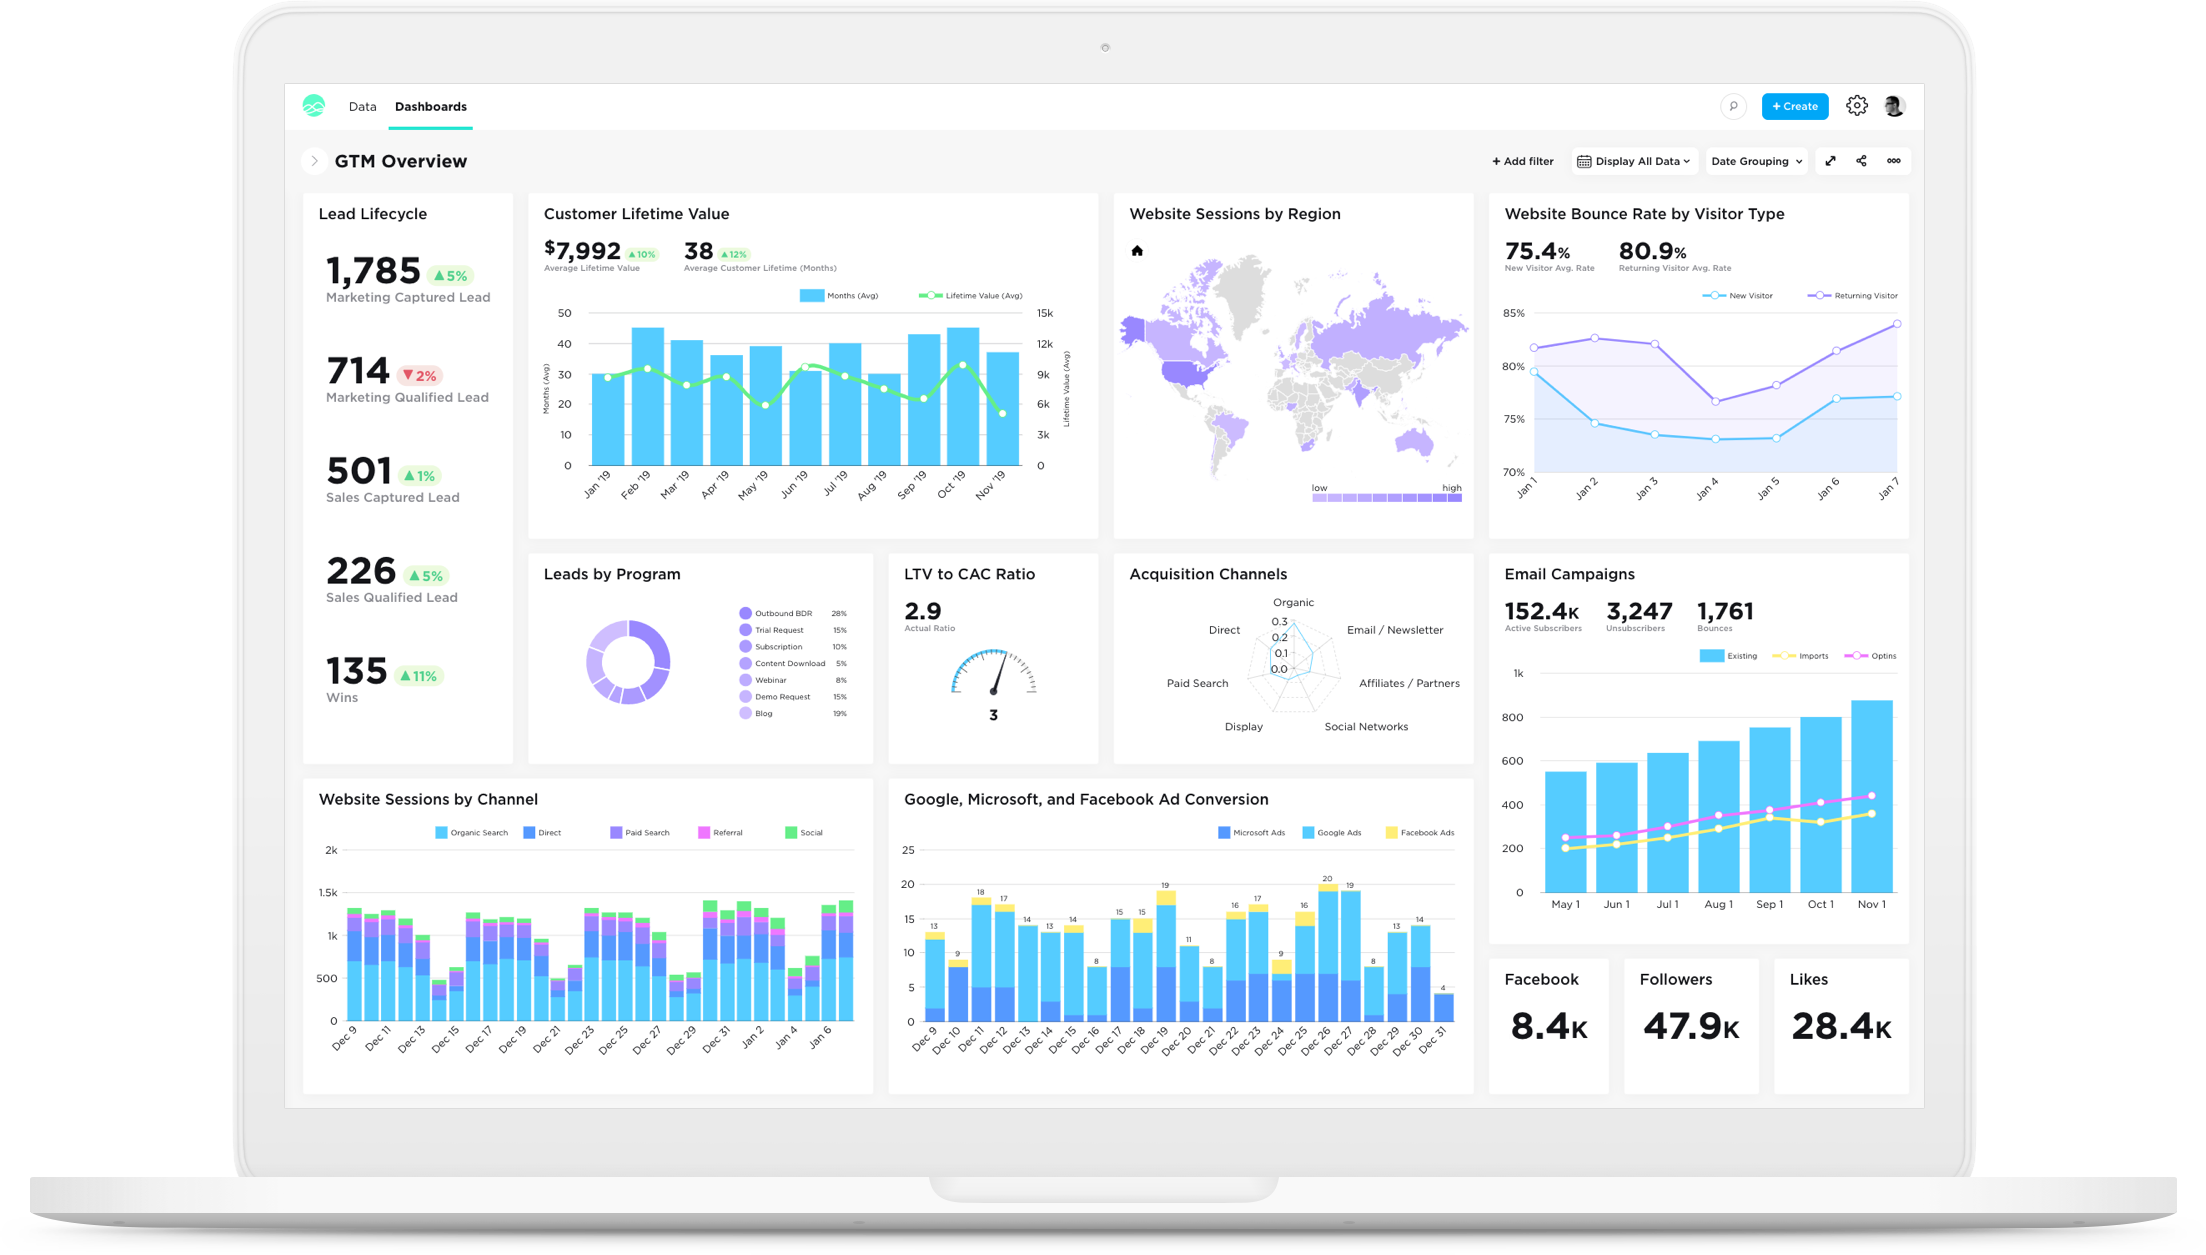 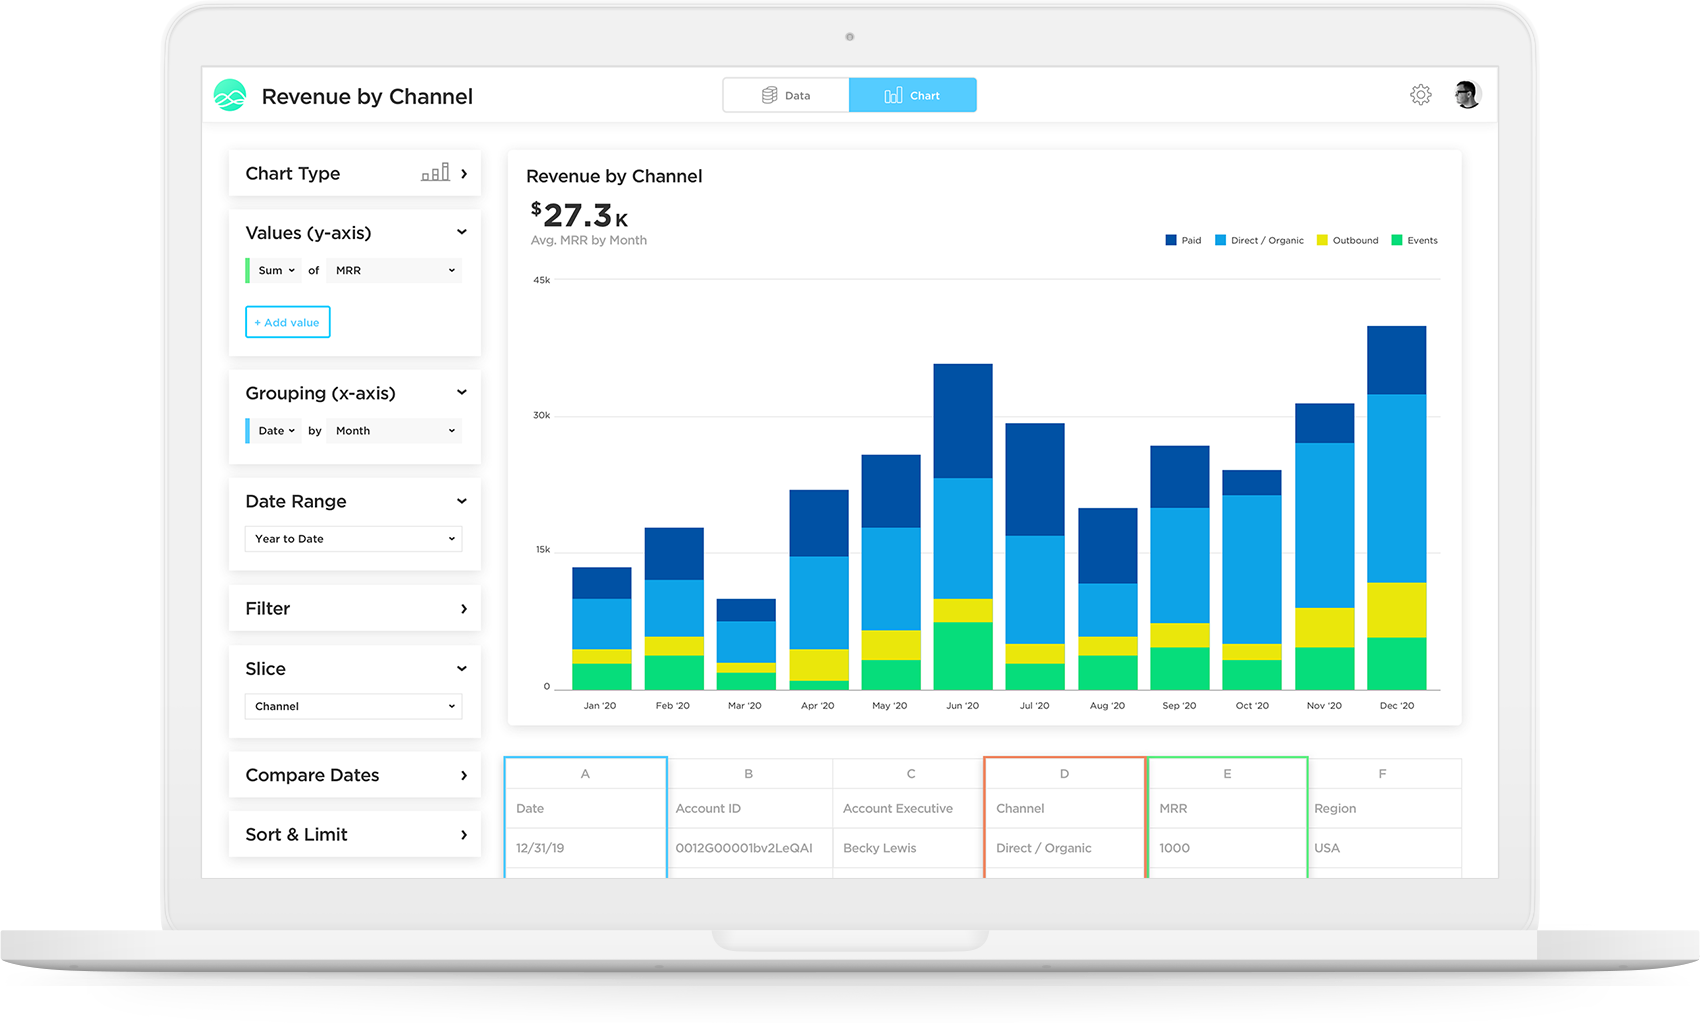 |