Datadog is a monitoring service for IT, Dev and Ops teams who write and run applications at scale, and want to turn the massive amounts of data produced by their apps, tools and services into actionable insight.
$1.27
per month (billed annually) per host
Pandora FMS
Score 9.1 out of 10
Enterprise companies (1,001+ employees)
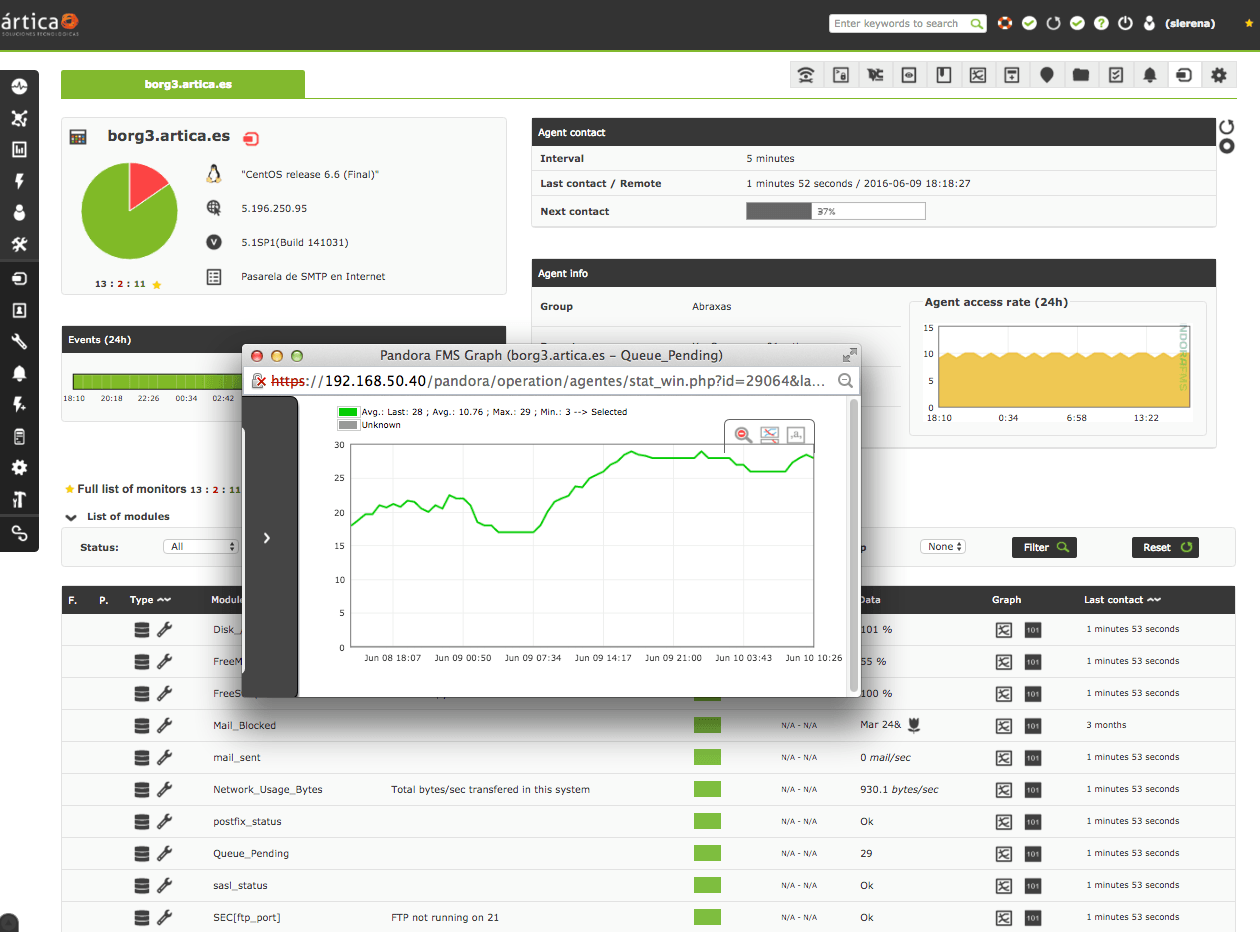
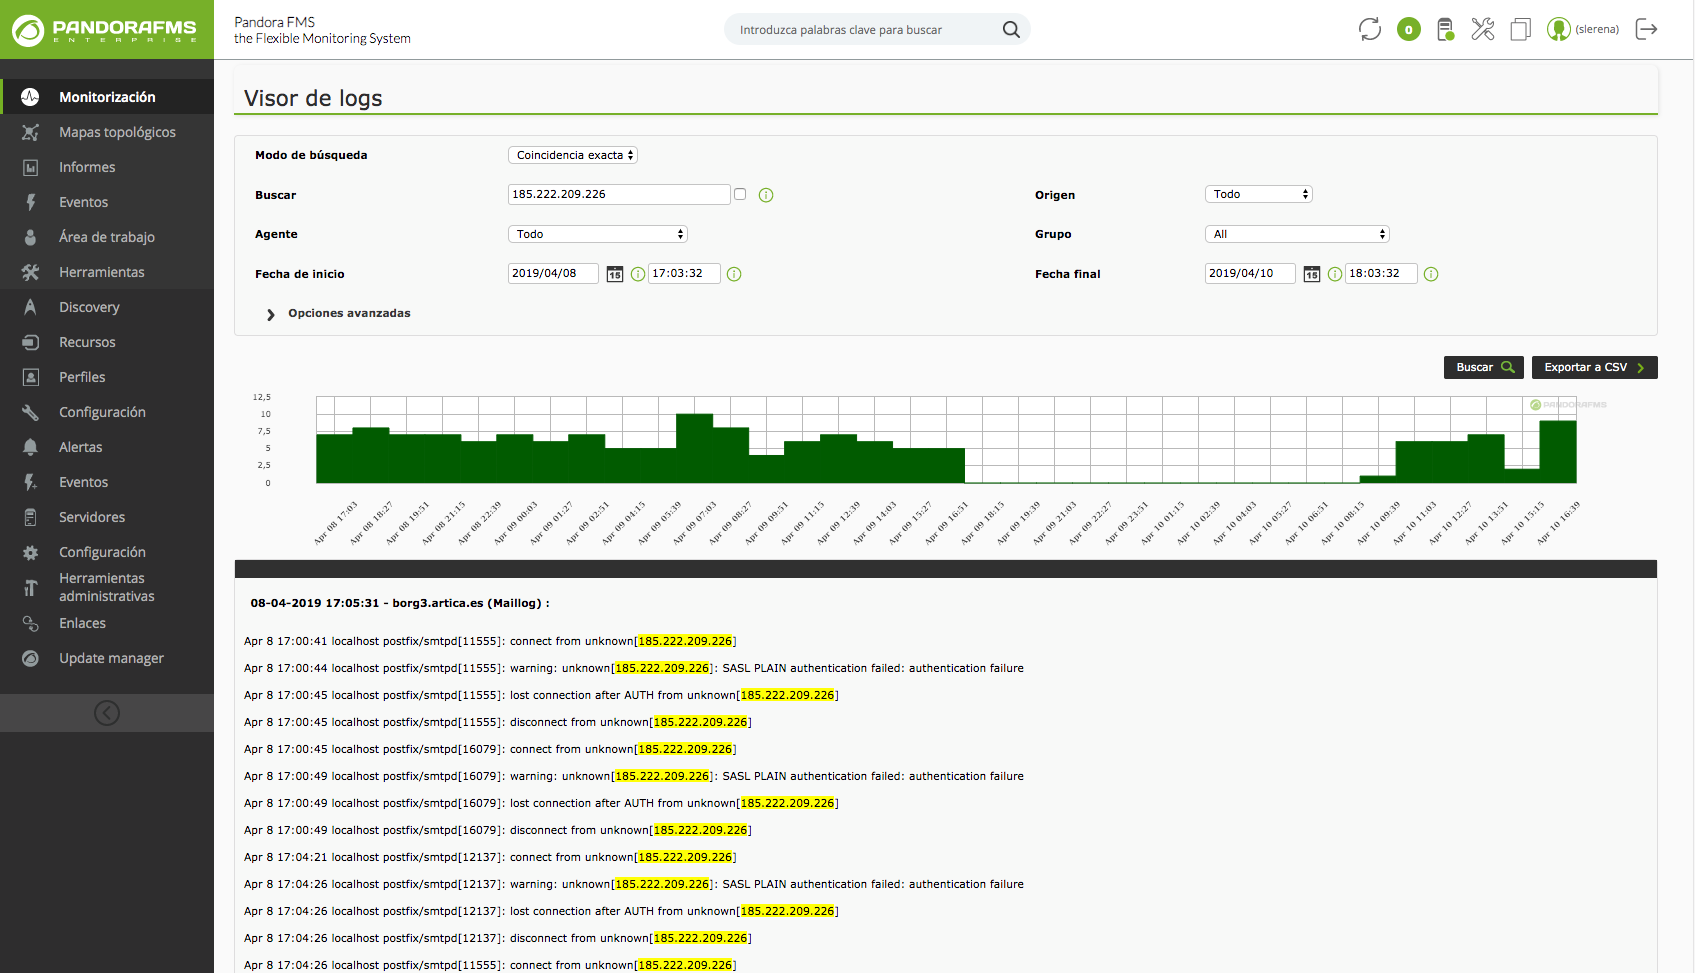
Pandora FMS is a flexible monitoring solution. It is presented as ideal for medium and big-sized environments with at least 100 devices. Users can monitor any device, infrastructure, application, IT as well as business processes and services. It allows business users to obtain information from their concerns in real time, visualizing the data in a direct way.
The solution boasts users among companies and organizations in more than 40 countries around the world, who according to the…
$2,990
100 nodes
Pricing
Datadog
Pandora FMS
Editions & Modules
Log Management
$1.27
per month (billed annually) per host
Infrastructure
$15.00
per month (billed annually) per host
Standard
$18
per month per host
Enterprise
$27
per month per host
DevSecOps Pro
$27
per month per host
APM
$31.00
per month (billed annually) per host
DevSecOps Enterprise
$41
per month per host
NMS Edition
$2,990
100 nodes
Enterprise Edition
$4,250
100 nodes
Offerings
Pricing Offerings
Datadog
Pandora FMS
Free Trial
Yes
Yes
Free/Freemium Version
Yes
Yes
Premium Consulting/Integration Services
No
No
Entry-level Setup Fee
Optional
Required
Additional Details
Discount available for annual pricing. Multi-Year/Volume discounts available (500+ hosts/mo).
Licensed for individual nodes (agents), starting from 100 nodes.
More Pricing Information
Community Pulse
Datadog
Pandora FMS
Features
Datadog
Pandora FMS
Network Performance Monitoring
Comparison of Network Performance Monitoring features of Product A and Product B
A one-stop solution for everything you need. Multiple functionalities are tailored to meet specific business needs. Logs are essential for any business, and Datadog manages logs effectively. Rum sessions are something new to me and have given us a new perspective on how to reverse engineer issues that we see for our customers.
Pandora FMS adjusts to the client's need, from a simple configuration of a single server to a complex scenario with high availability support without additional licensing costs.
Alert windows cause lag in notifications (e.g. if the alert window is X errors in 1 hour, we won't get alerted until the end of the 1 hour range)
I would appreciate more supportive examples for how to filter and view metrics in the explorer
I would like a more clear interface for metrics that are missing in a time frame, rather than only showing tags/etc. for metrics that were collected within the currently viewed time frame
Datadog's user interface is quite friendly and easy to navigate. With menus clearly categorized, and ability to bookmark important dashboards, one can easily find what they're looking for. For dashboards, ability to move and resize visualizations and group them, is really helpful to organize dashboards. Automatic suggestions from Datadog for important visualizations based on the metrics and logs would provide another level of ease of use.
The solution is very complete, and even includes extras such as IPAM. Deployment can be a bit unintuitive at first, but once you become familiar with the solution and thanks to its automatic deployment options it ends up being easier than it seemed. The power and options of the solution are its greatest virtue.
The support team usually gets it right. We did have a rather complicate issue setting up monitoring on a domain controller. However, they are usually responsive and helpful over chat. The downside would be I don’t think they have any phone support. If that is important to you this might not be a good fit.
I selected Datadog because of its features and the wide range of integration support. As I already told it supports more that 600+ integrations which helps and organization to keep everything in a single place and also its AI feature which is reducing the time for root cause analysis. Its custom dashboards features which helps us to visualize the data in a more attractive way.
Before using Pandora FMS, tests were carried out with all these tools:
Nagios
Zabbix
System Center Operations Manager (SCOM)
IBM Tivoli
PRTG
SolarWinds
Pandora FMS allows simple customization by making adjustments to text files, developing agent add-ons without the need to be a programmer, there is no scenario where we could not take data and save it in PandoraFMS, IoT, industrial products, and everything that any client needs to monitor.