Board vs. Drivetrain

Overview
ProductRatingMost Used ByProduct SummaryStarting Price
Board
Score 9.0 out of 10
Enterprise companies (1,001+ employees)
Board is presented as an enterprise planning platform, offered as a solution to accelerate business performance and enable continuous planning with greater forecast accuracy to drive confident, aligned decisions.N/A
Drivetrain
Score 0.0 out of 10
Mid-Size Companies (51-1,000 employees)
Drivetrain.ai is a Strategic Finance platform that gives a single picture of how a company is performing and how to influence the business. Drivetrain is used for building financial models, flexible budgets, board ready reports and What-If analysis tools to drive better, faster decision-making. Founded in 2021, Drivetrain is headquartered in Santa Clara, California and is used by FP&A leaders at companies.N/A
Pricing
BoardDrivetrain
Editions & Modules
No answers on this topic
Offerings
Pricing Offerings
BoardDrivetrain
Free Trial
NoNo
Free/Freemium Version
NoNo
Premium Consulting/Integration Services
NoNo
Entry-level Setup FeeNo setup feeNo setup fee
Additional Details
More Pricing Information
Community Pulse
BoardDrivetrain
Features
BoardDrivetrain
BI Standard Reporting
Comparison of BI Standard Reporting features of Product A and Product B
Board
6.8
Ratings
12% below category average
Drivetrain
-
Ratings
Pixel Perfect reports6.70 Ratings00 Ratings
Customizable dashboards6.90 Ratings00 Ratings
Report Formatting Templates6.90 Ratings00 Ratings
Ad-hoc Reporting
Comparison of Ad-hoc Reporting features of Product A and Product B
Board
6.9
Ratings
17% below category average
Drivetrain
-
Ratings
Drill-down analysis6.90 Ratings00 Ratings
Formatting capabilities6.20 Ratings00 Ratings
Integration with R or other statistical packages6.90 Ratings00 Ratings
Report sharing and collaboration7.60 Ratings00 Ratings
Report Output and Scheduling
Comparison of Report Output and Scheduling features of Product A and Product B
Board
7.1
Ratings
15% below category average
Drivetrain
-
Ratings
Publish to Web6.90 Ratings00 Ratings
Publish to PDF7.20 Ratings00 Ratings
Report Versioning6.90 Ratings00 Ratings
Report Delivery Scheduling7.60 Ratings00 Ratings
Data Discovery and Visualization
Comparison of Data Discovery and Visualization features of Product A and Product B
Board
7.3
Ratings
4% below category average
Drivetrain
-
Ratings
Pre-built visualization formats (heatmaps, scatter plots etc.)6.90 Ratings00 Ratings
Location Analytics / Geographic Visualization7.60 Ratings00 Ratings
Predictive Analytics7.60 Ratings00 Ratings
Pattern Recognition and Data Mining7.30 Ratings00 Ratings
Access Control and Security
Comparison of Access Control and Security features of Product A and Product B
Board
7.5
Ratings
15% below category average
Drivetrain
-
Ratings
Multi-User Support (named login)7.60 Ratings00 Ratings
Role-Based Security Model7.40 Ratings00 Ratings
Multiple Access Permission Levels (Create, Read, Delete)6.90 Ratings00 Ratings
Single Sign-On (SSO)8.30 Ratings00 Ratings
Mobile Capabilities
Comparison of Mobile Capabilities features of Product A and Product B
Board
6.9
Ratings
13% below category average
Drivetrain
-
Ratings
Responsive Design for Web Access6.20 Ratings00 Ratings
Mobile Application6.20 Ratings00 Ratings
Dashboard / Report / Visualization Interactivity on Mobile6.20 Ratings00 Ratings
Budgeting, Planning, and Forecasting
Comparison of Budgeting, Planning, and Forecasting features of Product A and Product B
Board
7.5
Ratings
10% below category average
Drivetrain
-
Ratings
Long-term financial planning7.50 Ratings00 Ratings
Financial budgeting7.60 Ratings00 Ratings
Forecasting6.70 Ratings00 Ratings
Scenario modeling8.30 Ratings00 Ratings
Management reporting7.60 Ratings00 Ratings
Consolidation and Close
Comparison of Consolidation and Close features of Product A and Product B
Board
7.3
Ratings
9% below category average
Drivetrain
-
Ratings
Financial data consolidation8.30 Ratings00 Ratings
Journal entries and reports6.80 Ratings00 Ratings
Multi-currency management7.60 Ratings00 Ratings
Intercompany Eliminations7.60 Ratings00 Ratings
Minority Ownership7.60 Ratings00 Ratings
Local and consolidated reporting6.70 Ratings00 Ratings
Detailed Audit Trails6.90 Ratings00 Ratings
Financial Reporting and Compliance
Comparison of Financial Reporting and Compliance features of Product A and Product B
Board
7.2
Ratings
12% below category average
Drivetrain
-
Ratings
Financial Statement Reporting7.60 Ratings00 Ratings
Management Reporting6.90 Ratings00 Ratings
Excel-based Reporting6.90 Ratings00 Ratings
Automated board and financial reporting7.60 Ratings00 Ratings
XBRL support for regulatory filing6.80 Ratings00 Ratings
Analytics and Reporting
Comparison of Analytics and Reporting features of Product A and Product B
Board
7.4
Ratings
8% below category average
Drivetrain
-
Ratings
Personalized dashboards7.60 Ratings00 Ratings
Color-coded scorecards7.60 Ratings00 Ratings
KPIs6.90 Ratings00 Ratings
Cost and profitability analysis7.60 Ratings00 Ratings
Key Performance Indicator setting7.60 Ratings00 Ratings
Benchmarking with external data7.40 Ratings00 Ratings
Integration
Comparison of Integration features of Product A and Product B
Board
7.4
Ratings
12% below category average
Drivetrain
-
Ratings
Flat file integration7.40 Ratings00 Ratings
Excel data integration7.40 Ratings00 Ratings
Direct links to 3rd-party data sources7.30 Ratings00 Ratings
User Ratings
BoardDrivetrain
Likelihood to Recommend
6.2
(0 ratings)
-
(0 ratings)
Likelihood to Renew
9.1
(0 ratings)
-
(0 ratings)
Usability
7.7
(0 ratings)
-
(0 ratings)
Availability
9.1
(0 ratings)
-
(0 ratings)
Performance
9.1
(0 ratings)
-
(0 ratings)
Support Rating
8.0
(0 ratings)
-
(0 ratings)
In-Person Training
7.3
(0 ratings)
-
(0 ratings)
Implementation Rating
7.2
(0 ratings)
-
(0 ratings)
Configurability
9.1
(0 ratings)
-
(0 ratings)
Ease of integration
9.1
(0 ratings)
-
(0 ratings)
Product Scalability
9.1
(0 ratings)
-
(0 ratings)
Vendor post-sale
9.1
(0 ratings)
-
(0 ratings)
Vendor pre-sale
9.1
(0 ratings)
-
(0 ratings)
User Testimonials
BoardDrivetrain
Likelihood to Recommend
It's been very good when all departments of the company had to pitch in data/information for a specific business decision. My company had to have input from Marketing, Sales, Engineering, Customer Support, and accounting in order to decide on what kind of development was next needed for our platform.
Read full review
No answers on this topic
Pros
  • Board makes data summary easy - It makes comprehensive reports with great visuals.
  • Board makes navigation is easy for users - it has abundant training materials to help you get started.
  • With Board security is easy to set up and maintain for the organization - the support staff also provides great assistance for implementation and resolves other issues.
Read full review
No answers on this topic
Cons
  • Board BI tool has a steep learning curve and can be challenging for a new user to reach to board's full capacity.
  • We have to use a windows scheduler to schedule data import tasks; it would be great if Board could provide its own scheduler.
Read full review
No answers on this topic
Likelihood to Renew
Board is a fantastic product for swift BI solution delivery when compared with its peers. Ease of use, support and integration with Microsoft Office Addin open a wide horizon of opportunities for further enhancements to solutions. Easy bespoke app development capabilities make it a winner for us. BOARD is just like a white canvas, it lets you explore your creative side while designing and delivering a solution
Read full review
No answers on this topic
Usability
Overall, Board is easy to use and develop for. Users can quickly get up to speed and begin using with only a small amount of training. Generally, it takes longer to explain the data structure (our customization) than it does to explain the tool itself. The most consistent challenge we run into is hierarchy management. New members have to be mapped to each level of an entity. While there is a "normalization" process, it often fails to map correctly or in rare cases can change custom mapping that was previously set up.
Read full review
No answers on this topic
Performance
very fast and no integration problems
Read full review
No answers on this topic
Support Rating
The only time I needed assistance was due to a problem in
the prints: the colors of the brochures as they were on the screen were not
reproduced in the print, but a series of standard colors were reproduced. This
fact made colored numbers on a colored background illegible. From the
assistance they confirmed that it was a problem of version 10.2 that occurred
when leaving the brochures with the default colors proposed by Board. To obtain
the desired colors, they had to be personalized ... I didn't like the solution
very much and the technician who recommended it didn't like me either, but they
would have solved the problem with the following versions. In any case, the
assistance was quick and effective even if not exactly efficient.
Read full review
No answers on this topic
In-Person Training
Board is fairly simple and straight forward. Advance training on workflows and procedures is a good one but the training content only touches through the interesting areas. training content needs to cover a few areas more in-depth
Read full review
No answers on this topic
Implementation Rating
The problem of user profiling in our context is certainly
quite complex. The complexity is given by the fact that the company is divided
territorially into logistic points of sale, but at the same time they are
virtually divided into divisions (or specific implementation areas) and points
of sale of competence. The same operator can have access to data at different
logistic sales points, sales points of competence and divisions.
Read full review
No answers on this topic
Alternatives Considered
We earlier used Planful, which was also a good product but not as good as Board. The backend reporting and analysis of data are top-notch. The reports generated are quick and accurate. Board also offers to learn to upskill the team so that they can use the tool effectively and collaborate.
Read full review
No answers on this topic
Return on Investment
  • With effective financial analysis and planning and using Board, we were able to see a +18% QoQ revenue increase consistently for seven months straight
  • Using Board Dashboards, the senior management was able to better & clearly understand the financial position of the company at a given time and take better strategic decisions
Read full review
No answers on this topic
ScreenShots

Board Screenshots

Screenshot of PlanningScreenshot of Sales PlanningScreenshot of ProfitabilityScreenshot of GeomapScreenshot of ForecastScreenshot of Financial Plan

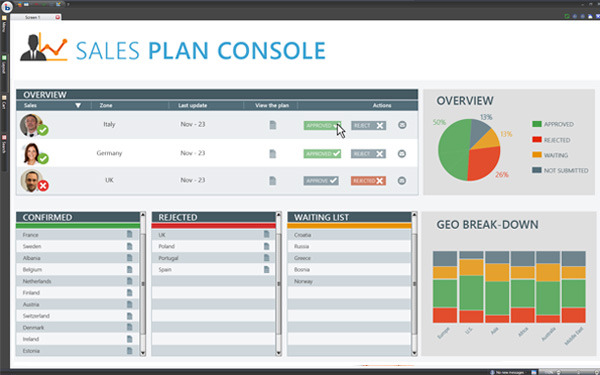
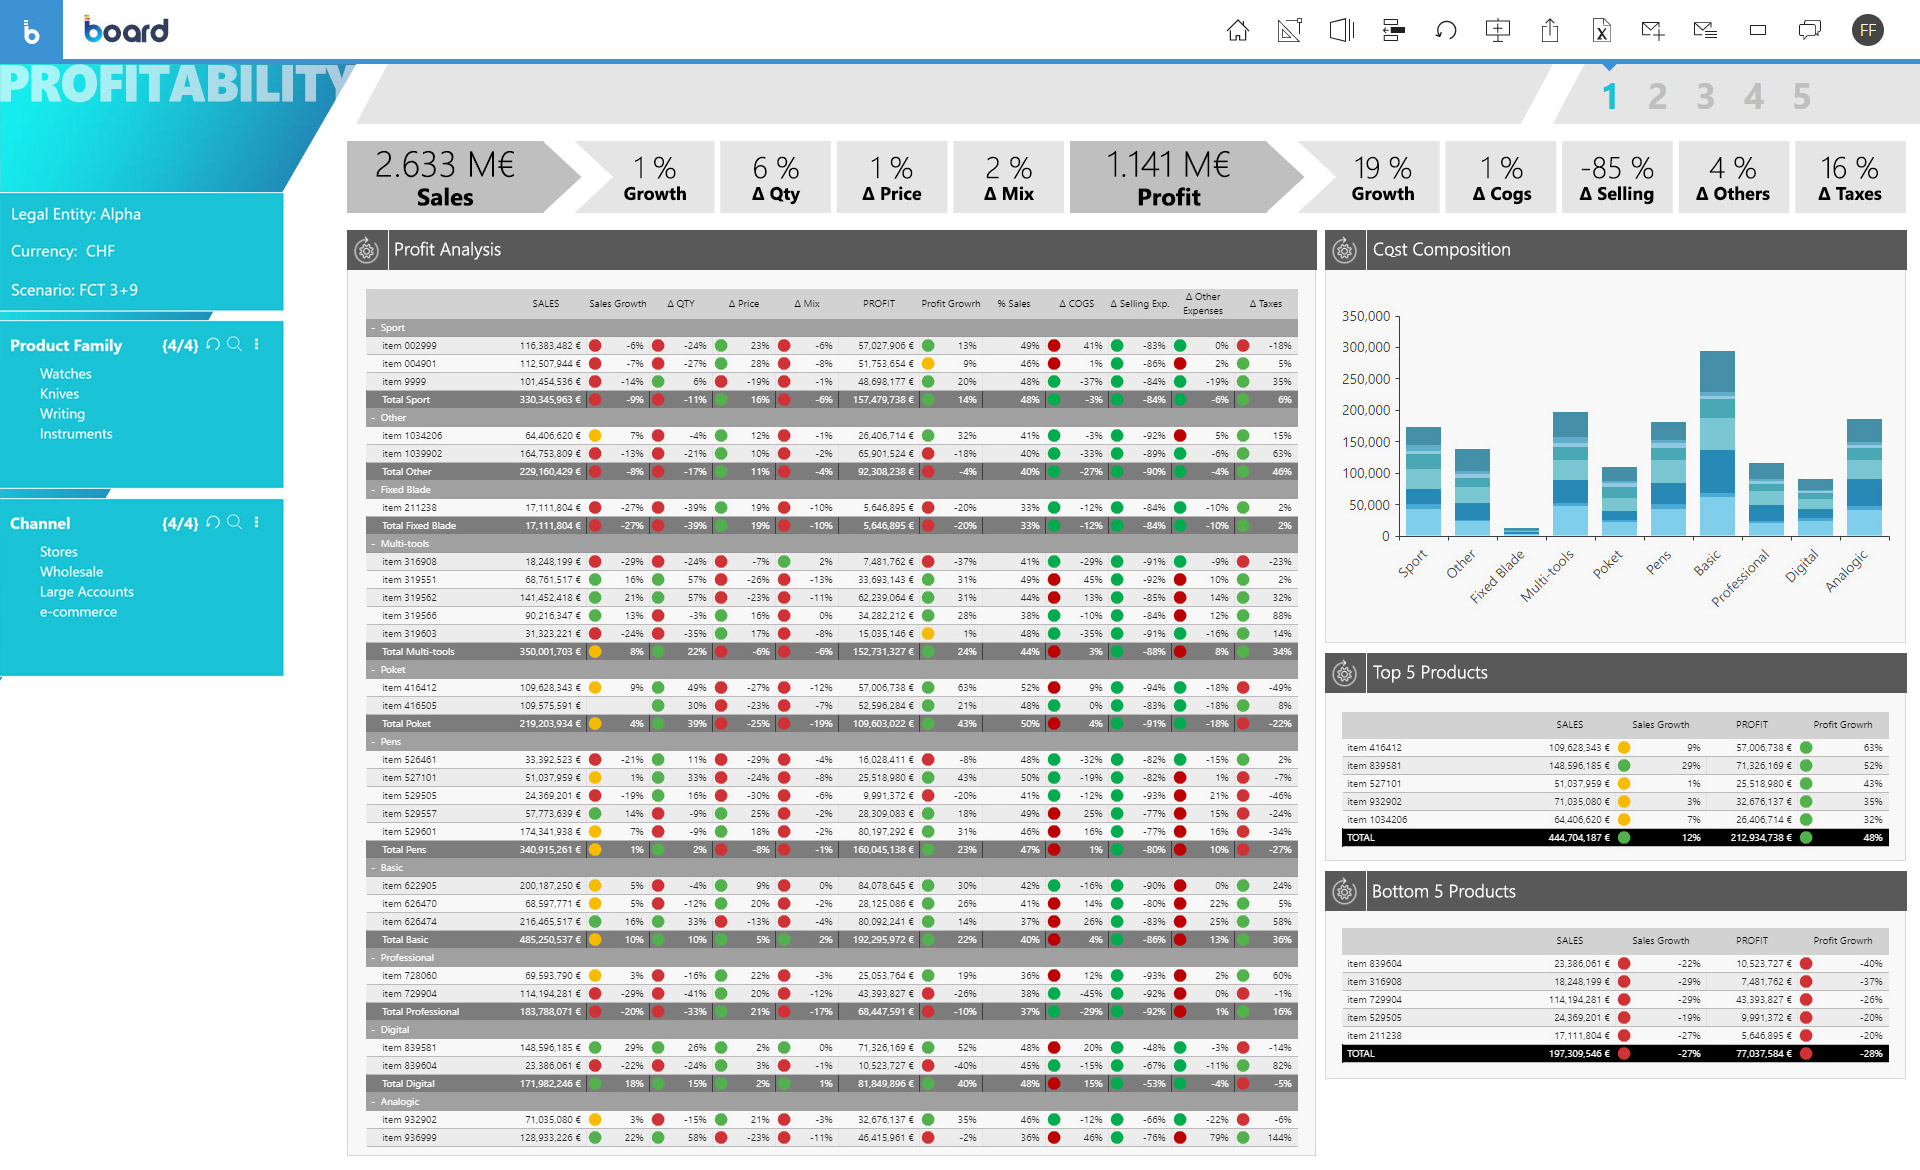
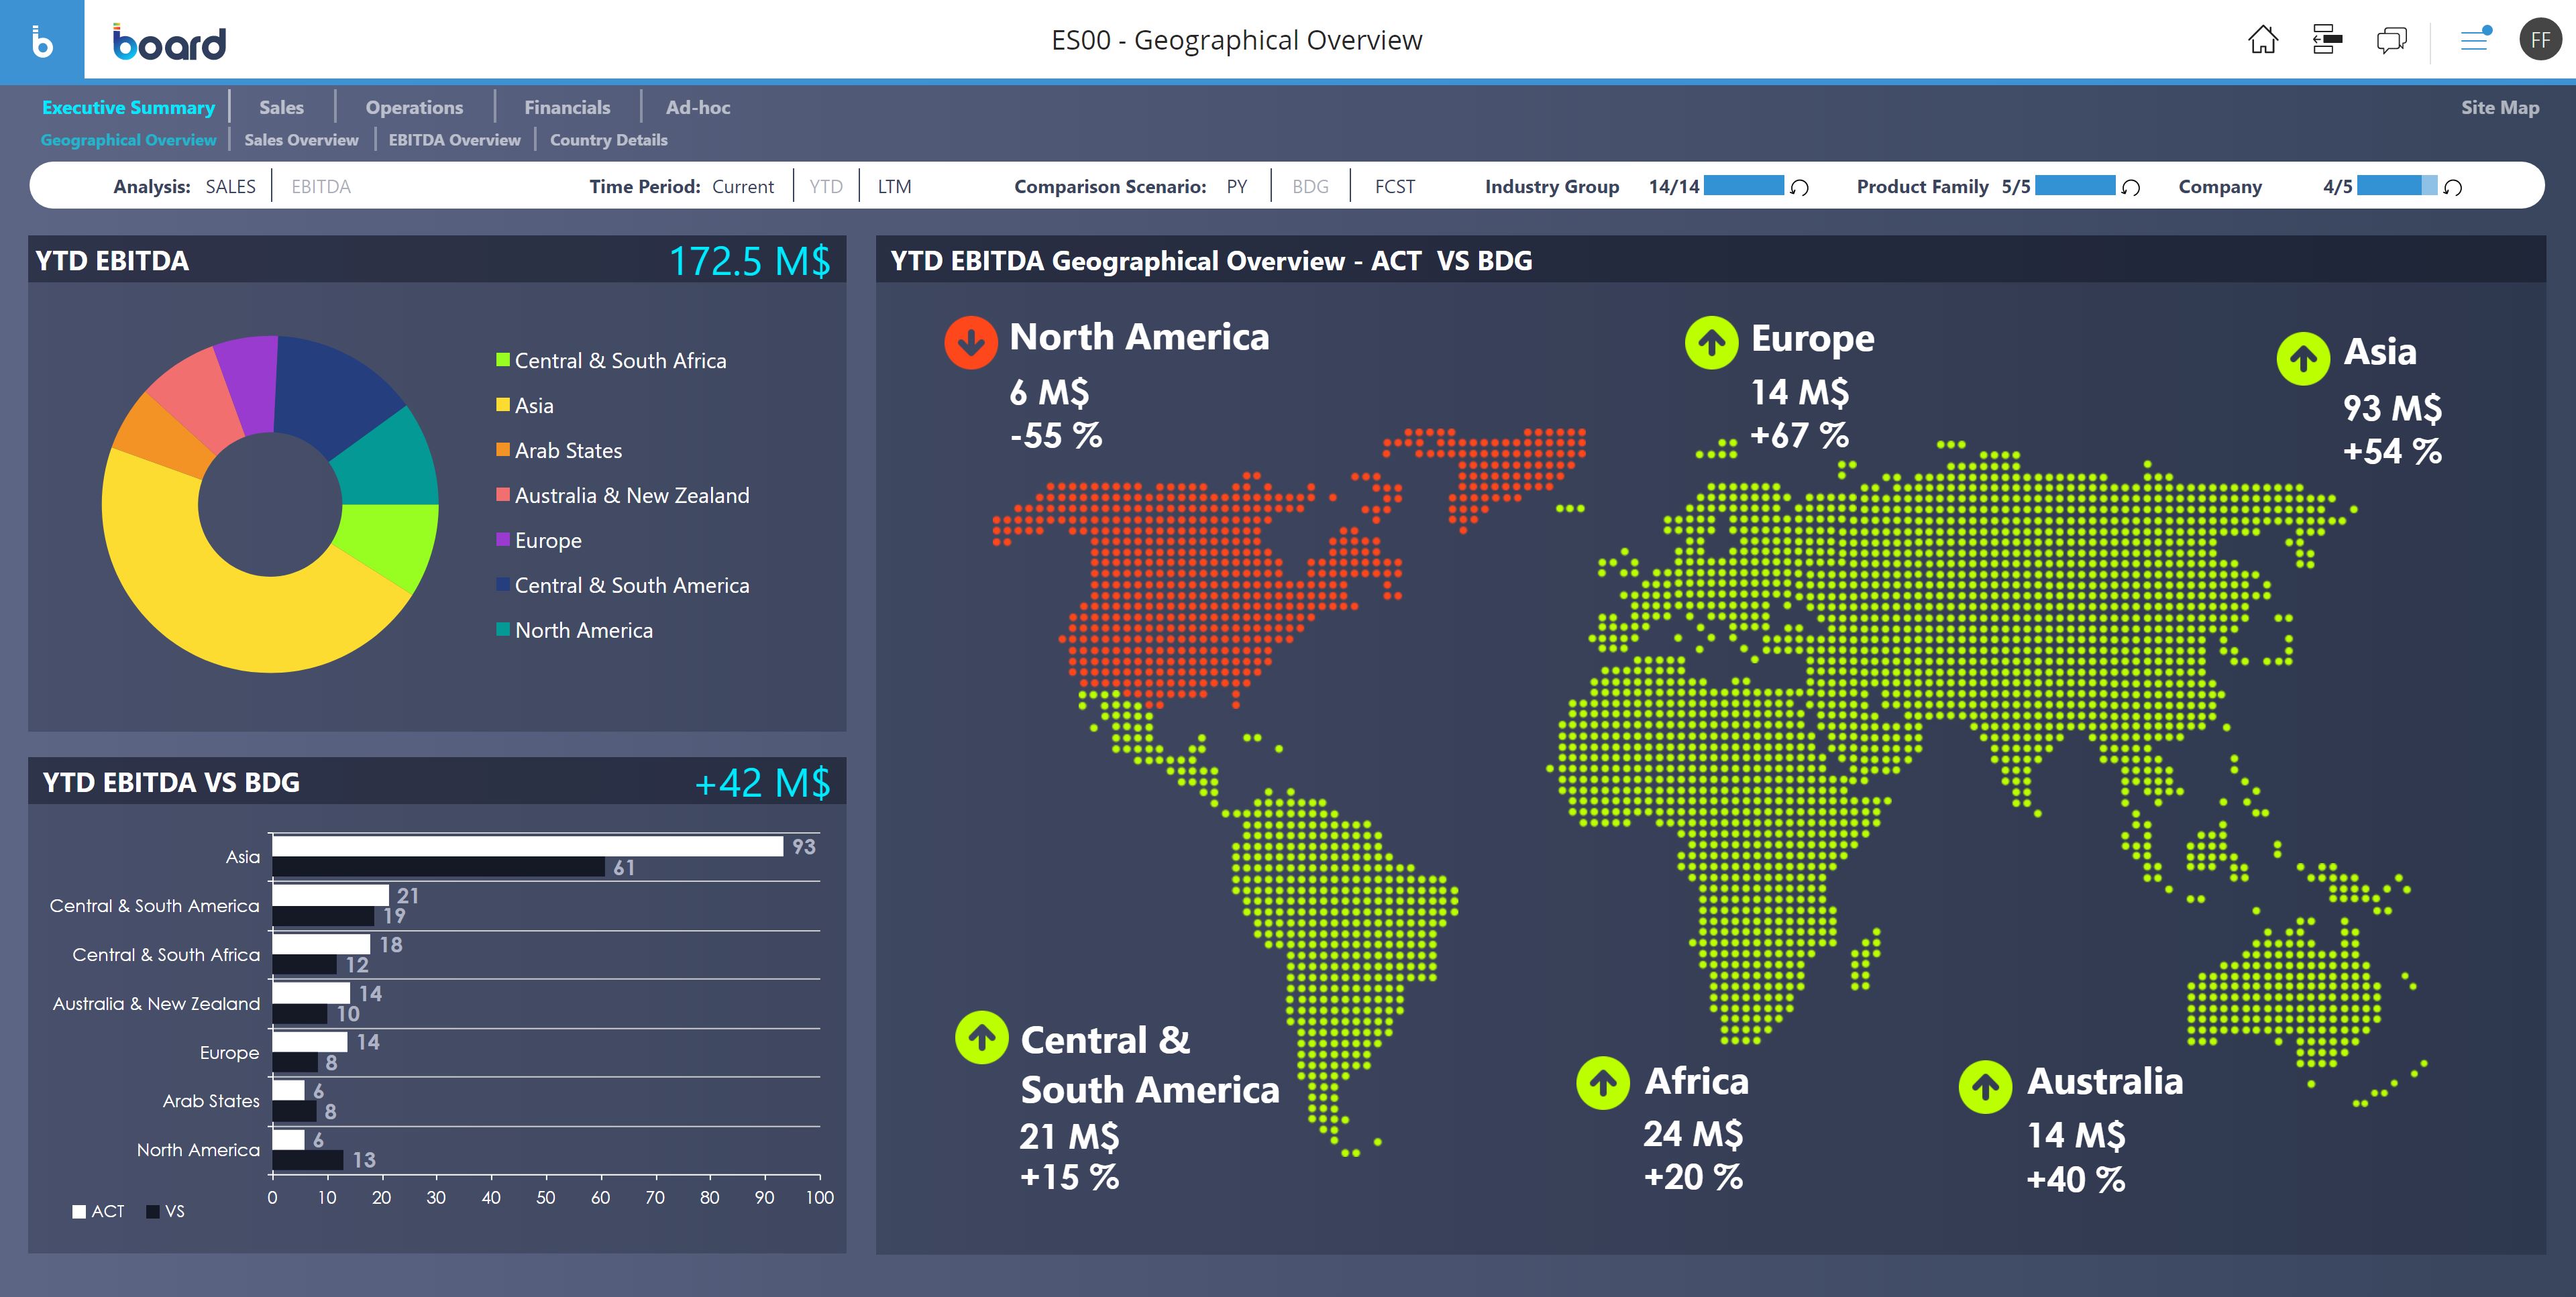
Drivetrain Screenshots
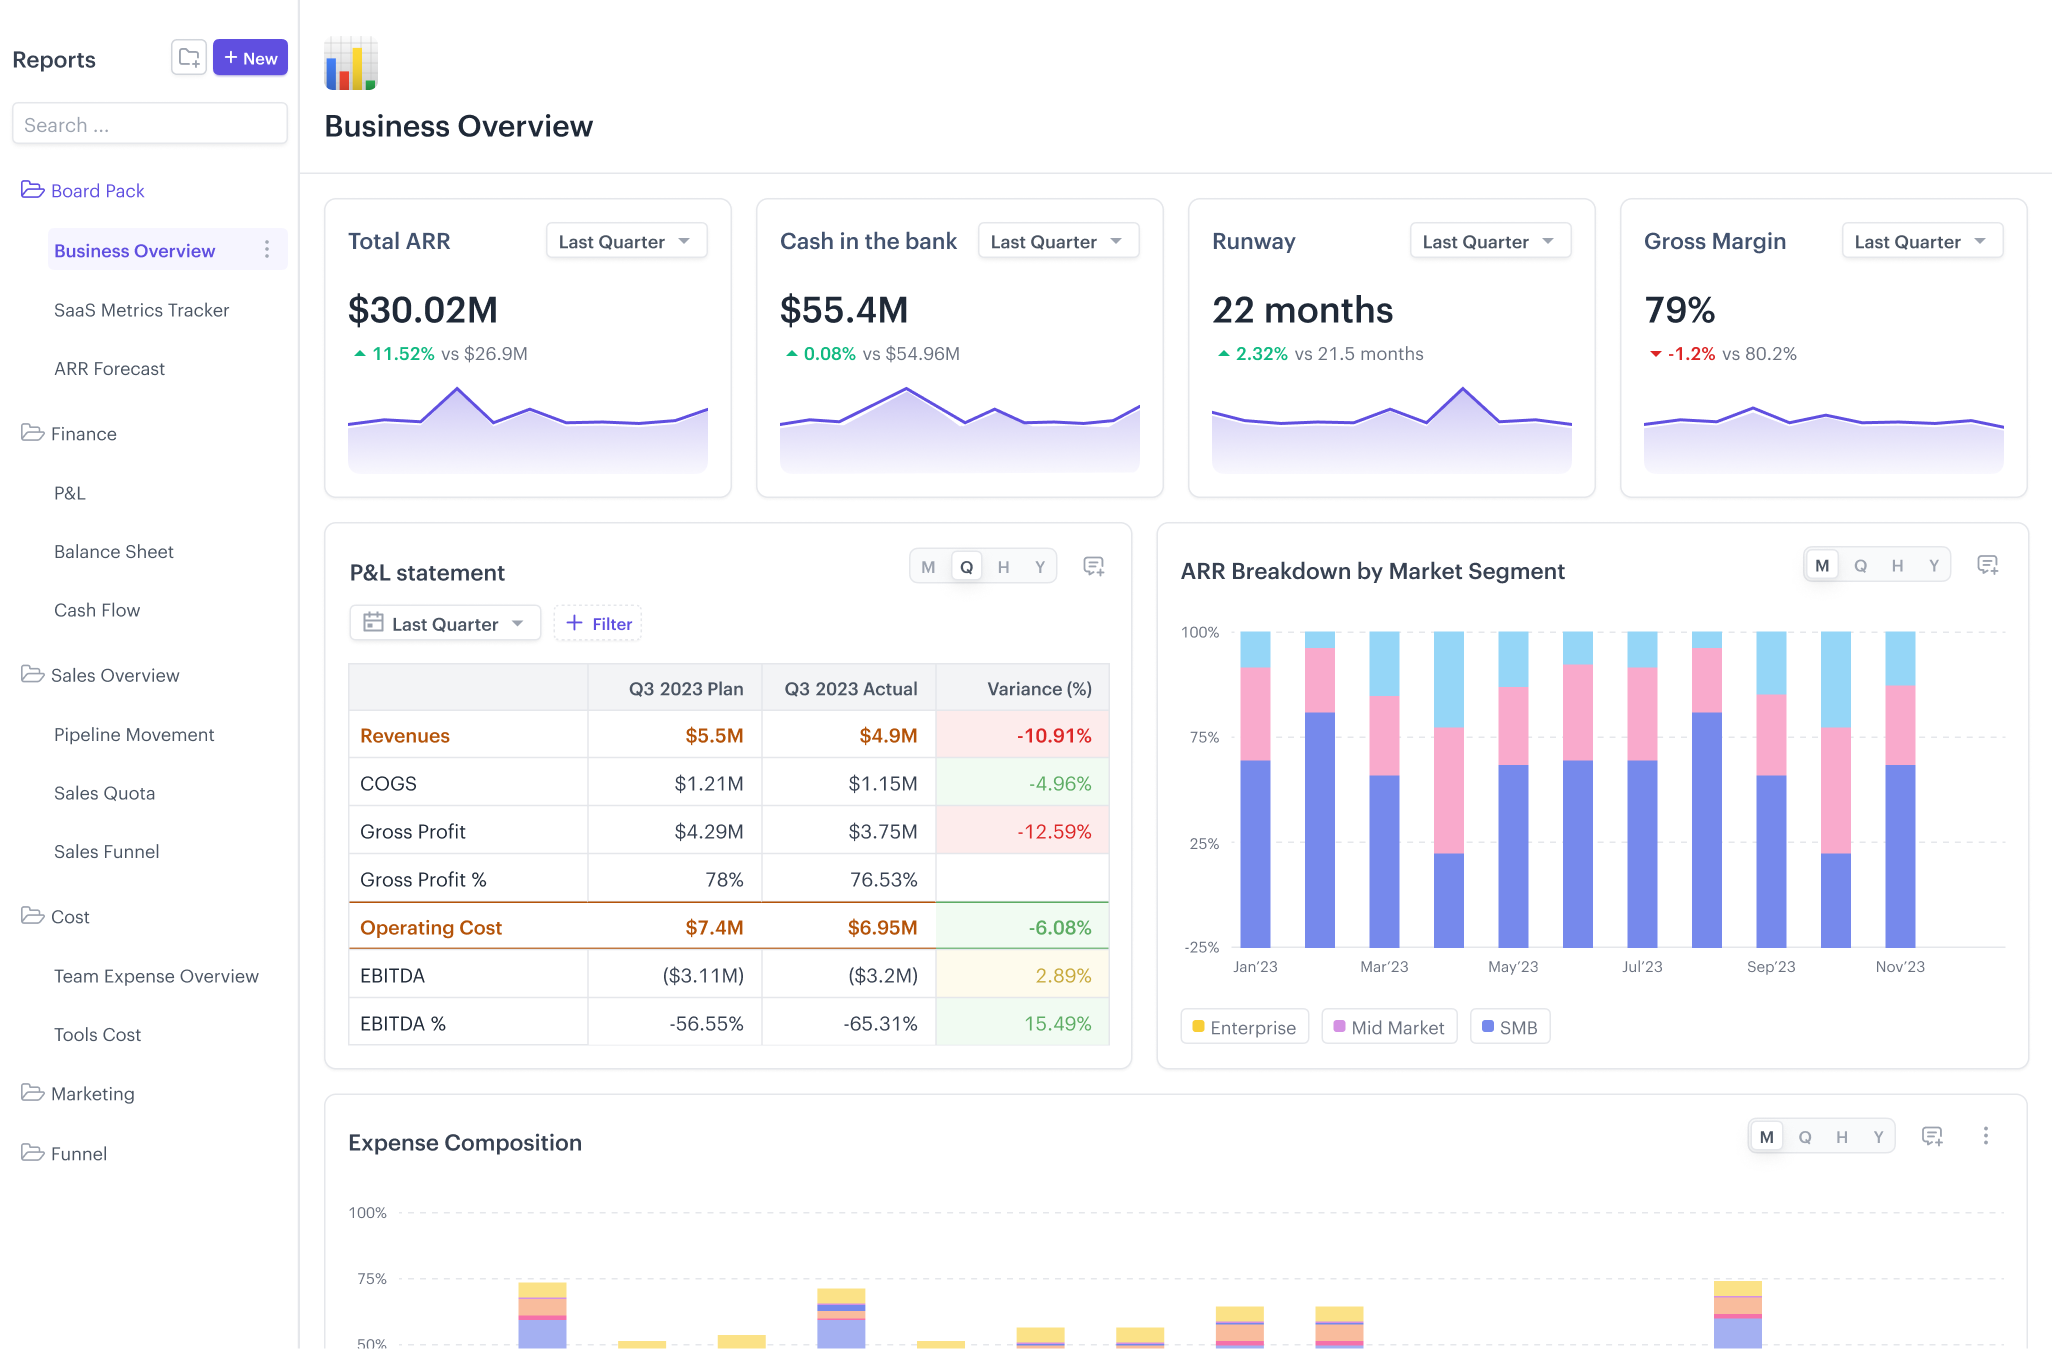
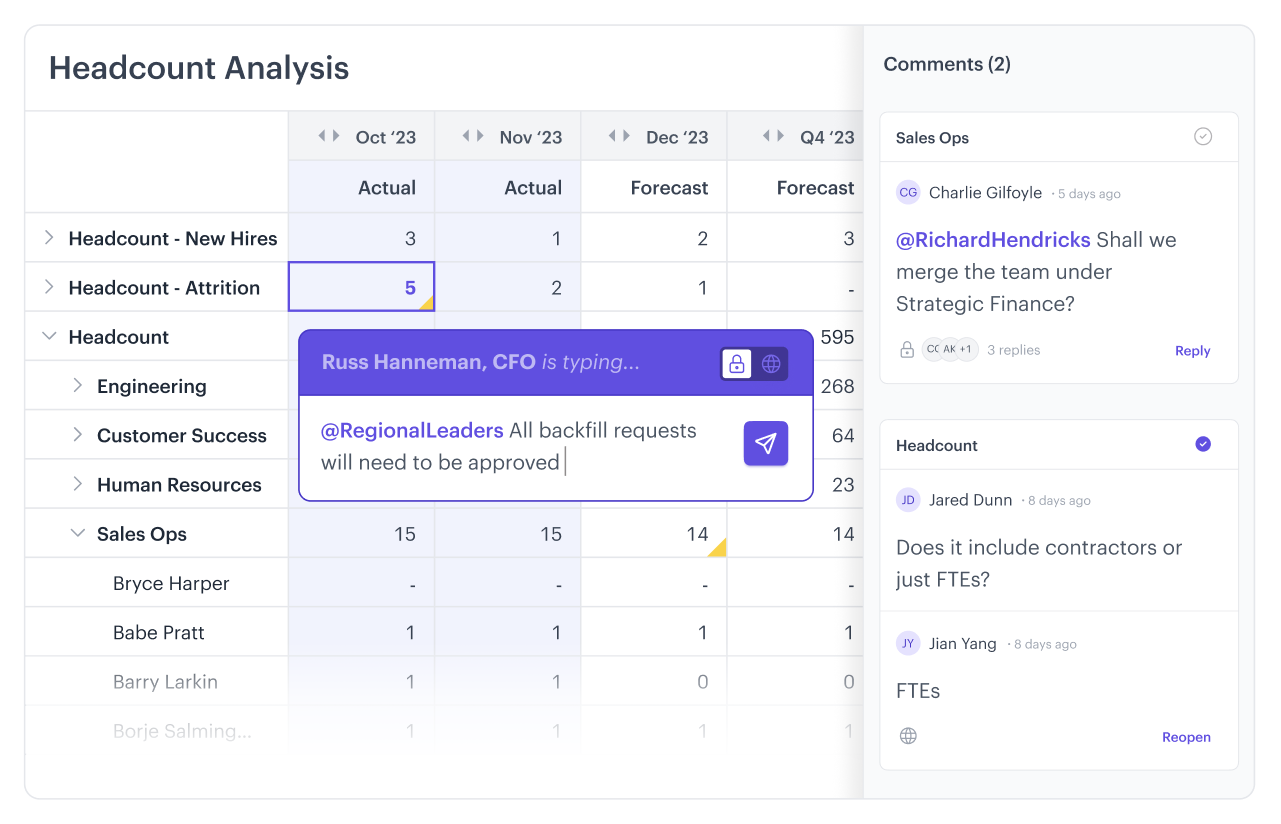
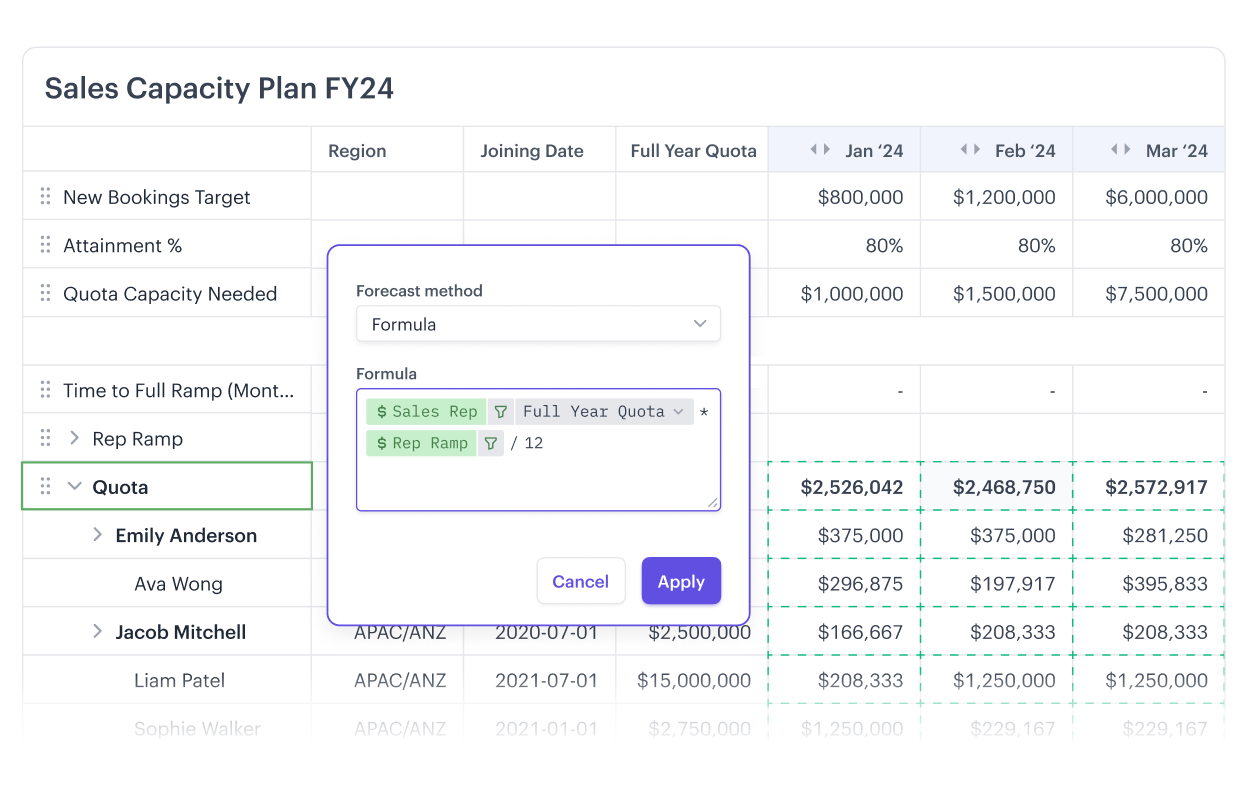
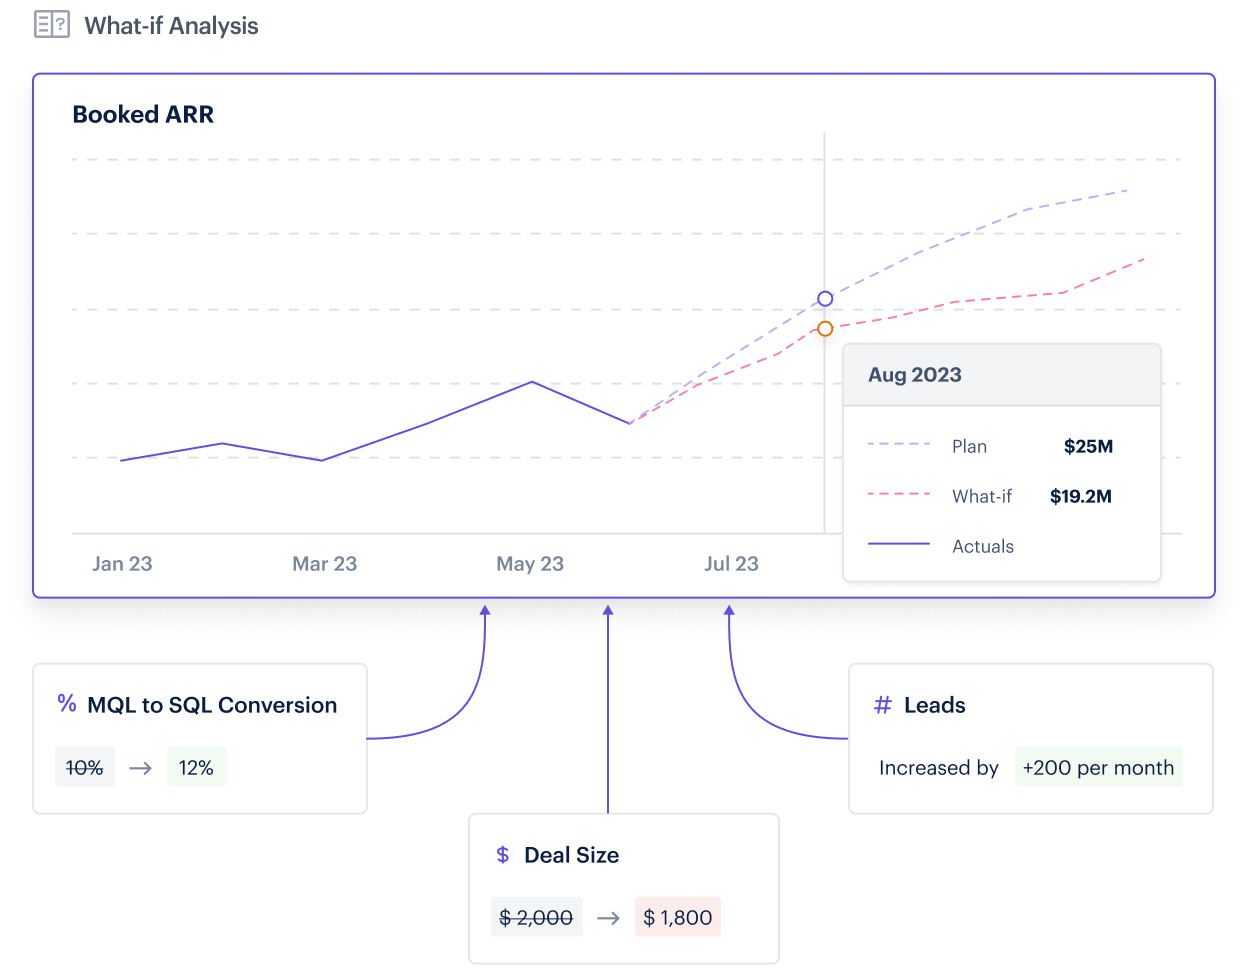
Screenshot of Screenshot of Screenshot of Screenshot of Screenshot of Screenshot of