Google Charts provides a way to visualize data on your website - for free. From simple line charts to complex hierarchical tree maps, the chart gallery provides a large number of ready-to-use chart types. The most common way to use Google Charts is with simple JavaScript that you embed in your web page.
N/A
SAP Crystal
Score 7.5 out of 10
N/A
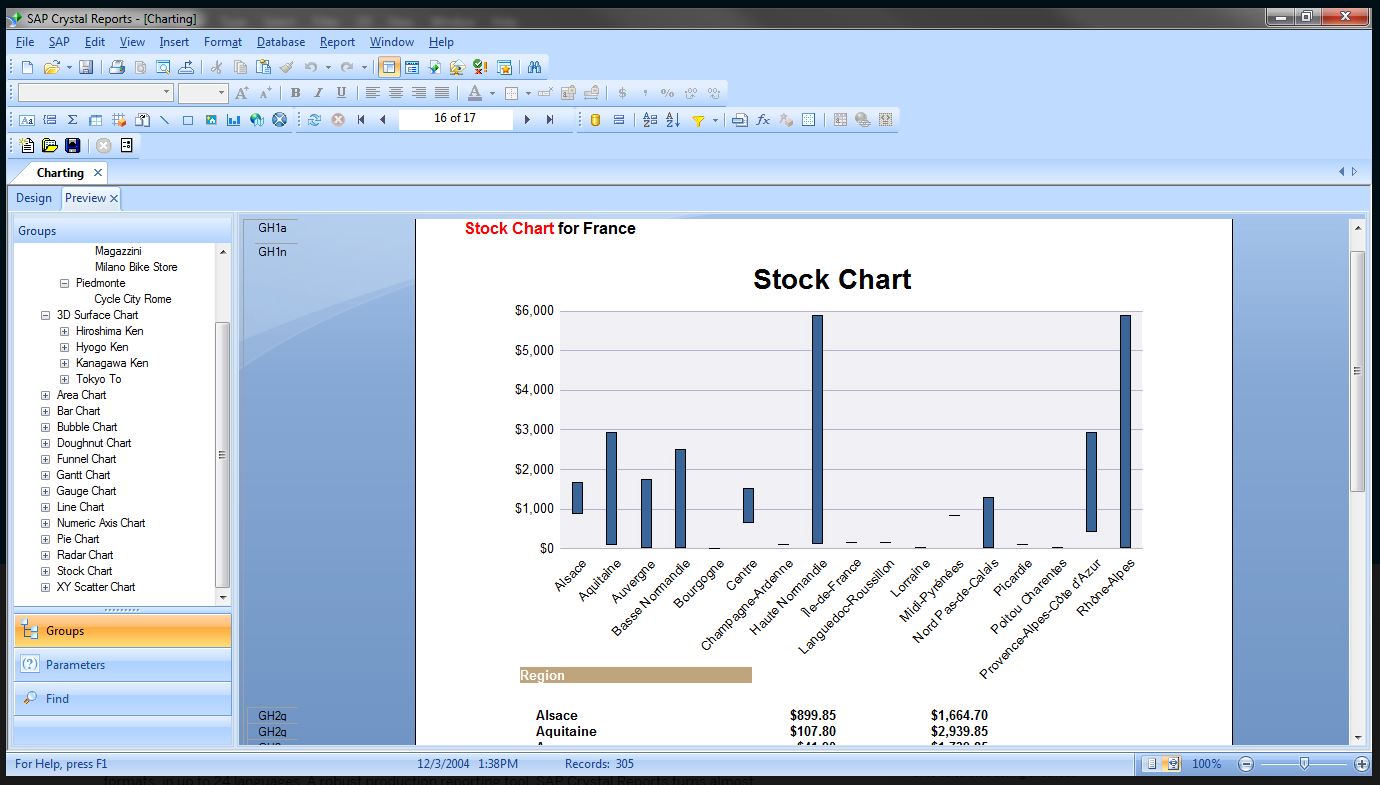
SAP Crystal is an analytics and reporting software solution for SMBs. SAP Crystal comprises Crystal Reports for pixel-perfect reporting, and SAP Crystal Server for automated distribution and self-service access to reports, dashboards and data exploration.
$295
per single user license
Pricing
Google Charts
SAP Crystal
Editions & Modules
No answers on this topic
Upgrade Version to SAP Crystal Reports 2020
$295
per single user license
SAP Crystal Reports 2020 64-Bit
$495
per single user license
SAP Crystal Reports 2016 32-Bit
$495
per single user license
SAP Crystal Server 2020 1 NUL
$869
per user license + first year maintenance to be added
SAP Crystal Server 2020 5 CAL
$8,744
5 concurrent users + first year maintenance to be added
Offerings
Pricing Offerings
Google Charts
SAP Crystal
Free Trial
No
Yes
Free/Freemium Version
Yes
Yes
Premium Consulting/Integration Services
No
No
Entry-level Setup Fee
No setup fee
Optional
Additional Details
—
* SAP Crystal Reports 2020 Viewer allows you to view static data within a SAP Crystal Reports file.
* SAP Crystal Reports 2020 - Full version allows you to create powerful, richly formatted, and dynamic reports from virtually any data source, delivered in dozens of formats, in up to 28 languages. If you already have an older version of Crystal Reports, buy a license for SAP Crystal Reports 2020 - Upgrade at a discounted, upgrade price.
* SAP Crystal Server 2020, 1 NUL includes 1 license of: SAP Crystal Reports 2020 - SAP Crystal Server 2020.
* As an add-on to SAP Crystal Server 2020 1 NUL, SAP Crystal Server 2020 5 CAL allows you to support a wider, intermittent audience of end users, up to five logged on at the same time.
More Pricing Information
Community Pulse
Google Charts
SAP Crystal
Features
Google Charts
SAP Crystal
BI Standard Reporting
Comparison of BI Standard Reporting features of Product A and Product B
Google Charts
8.8
Ratings
8% above category average
SAP Crystal
9.3
Ratings
13% above category average
Pixel Perfect reports
8.10 Ratings
8.00 Ratings
Customizable dashboards
9.50 Ratings
10.00 Ratings
Report Formatting Templates
8.80 Ratings
10.00 Ratings
Ad-hoc Reporting
Comparison of Ad-hoc Reporting features of Product A and Product B
Google Charts
9.3
Ratings
14% above category average
SAP Crystal
9.6
Ratings
18% above category average
Drill-down analysis
8.60 Ratings
10.00 Ratings
Formatting capabilities
9.50 Ratings
10.00 Ratings
Integration with R or other statistical packages
9.50 Ratings
8.60 Ratings
Report sharing and collaboration
9.60 Ratings
10.00 Ratings
Report Output and Scheduling
Comparison of Report Output and Scheduling features of Product A and Product B
Google Charts
9.0
Ratings
8% above category average
SAP Crystal
9.4
Ratings
12% above category average
Publish to Web
9.50 Ratings
9.20 Ratings
Publish to PDF
9.60 Ratings
10.00 Ratings
Report Versioning
8.60 Ratings
9.00 Ratings
Report Delivery Scheduling
8.70 Ratings
9.00 Ratings
Delivery to Remote Servers
8.80 Ratings
10.00 Ratings
Data Discovery and Visualization
Comparison of Data Discovery and Visualization features of Product A and Product B
Google Charts is perfectly suited for most presentations that are data oriented. There's not much of a limit on the type of table or chart you can create, and being able to integrate with Google Sheets just makes things even easier if you've already got the data stored somewhere. It works well on desktop browsers, Iphones, and Android phones. The only drawback I've been able to find is for those that prefer to have a desktop application.
Generation of templated reports is the strong suit of SAP Crystal. Allows users to change formats in templates bases on requirement with minimal effort. Automated report delivery requires the user to be aware of sql which cannot be expected from all users. Should support more document export formats and improve the UI for SAP B1 Users
Great visualization for static format & precise tasks: For presentation to senior management /ex-co/vendors where concise decisions need to be made, Crystal is a nice choice to slide data into presentable views.
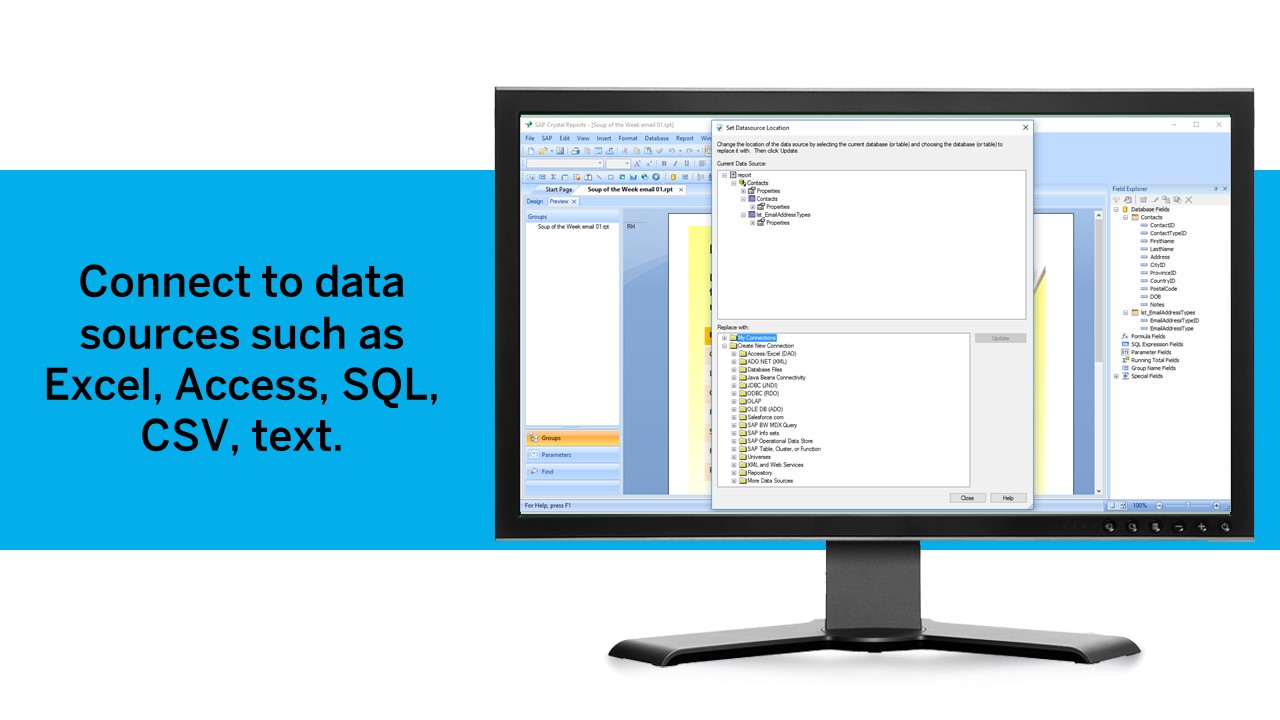
Diverse data source connect: We have used it to write reports using data from DB2, SQL, Progress, Excel spreadsheets, XML data, Access, and Lotus Notes databases. It can also be used to join different database types together in one report.
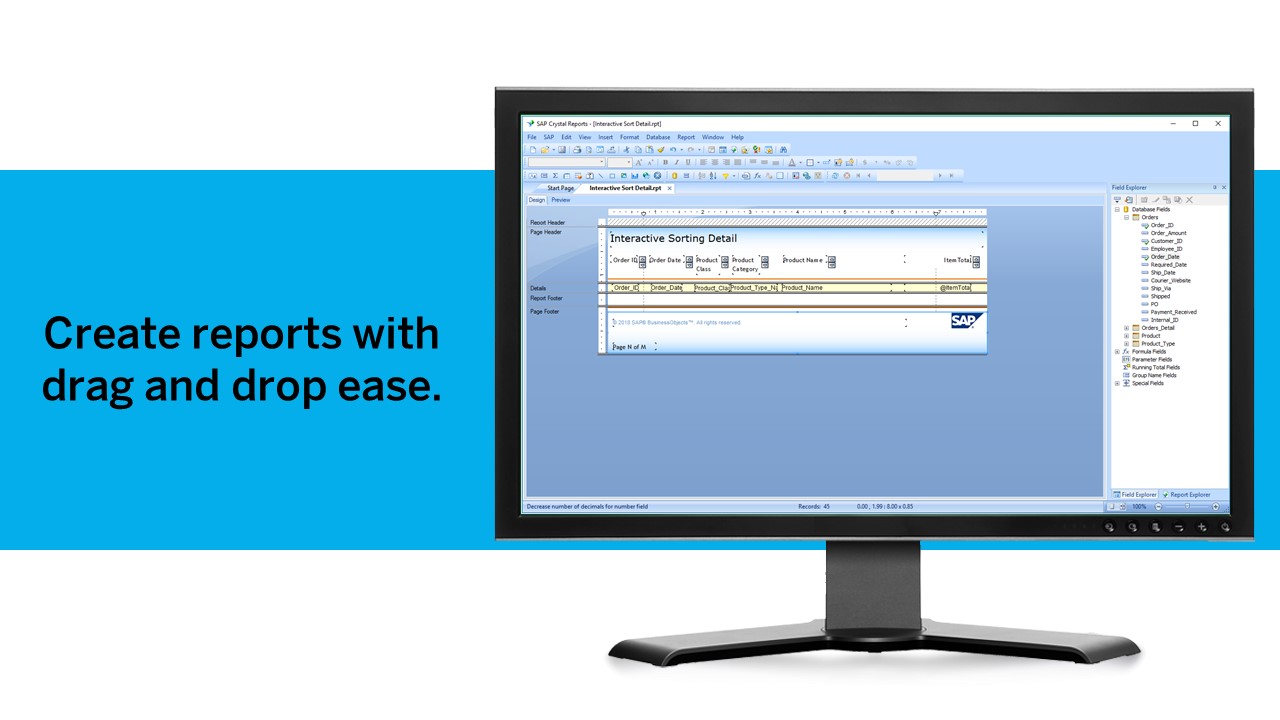
It uses the "recurring bands" structure for page layout which is efficient and fungible for generating different types of reports. Crystal doesn't require that we set up a metadata layer before creating reports and provides direct access to tables and dimensions.
I would like a couple more introductory videos or a live chat option for when you run into an issue. I think this is a Google-wide problem, not only linked to Google Charts.
I have run into some issues with the Dynamic Data but also admittedly could potentially dive in deeper and investigate.
It would be great if Google Charts made it possible to integrate Google Chat into the platform.
Google Charts is a good product. It's widely supported with deep documentation and a large community. But for me, it wasn't customizable enough. When we started with simple charts, it was great, but as we got deeper and more complex, our needs outgrew the library. If I was going forward, I would choose a more barebones library with more freedom and extensibility.
We have been using this product for so many years and it has truly become a cornerstone to our business processes when it comes to developing and distributing information via reports. We currently have over 500 reports developed to date over about 30 systems and that will continue to grow as user needs change.
Requires knowledge of Javascript, which can be difficult for a beginner. A business analyst often isn't as technically minded as a developer so collaboration is often required to produce a correct chart for the purpose required. However, the customisation capable due to this creates much better looking charts compared to other tools.
Being able to get up and running quickly is a key asset. There's plenty of advanced features to master that are surprisingly difficult in others tools (or just missing from other tools altogether). The UI can feel a bit dated at times but its usability isn't affected. Any issue you have can usually be resolved by searching in the user community
Google Charts has a very good documentation that we can just go in there and find the stuff we need to implement our solutions on Google Charts. Plus, if we get stuck, we can also email the support and they are very responsive. So overall, the support is very satisfying.
SAP Crystal report is very supportive in daily need of reports or any organization. Basic functionality of operational reports detailing the Sales Order details or PO in a manner which can be used very easily. A readily available solution for delivering any customized need in terms of pixelated reporting can be met easily with the tool
Just like any other implementation: When designing the differing reports, get end users' input, make sure to design the reports so that they display the information that the company requires, in the best and clearest way possible.
Test, test, test, revise when needed, and, particularly, do sufficient training so users are comfortable using Crystal Reports!
In comparison to Microsoft Power BI, Google Charts has more ease of use for businesses who simply need a way to visually display their data from their reports. Although Power BI may be more robust in more complicated data compilation, Google Charts can still be able to do some of the basics that Power BI delivers.
For standard pixel perfect reporting, our company still uses Crystal Reports. It allows us to continually provide standard reporting to our clients. For dashboards, we are moving towards Microsoft Power BI. Power BI allows similar collaboration, but generally has better features for dashboards. Power BI also allows us to publish multiple reports and dashboards into a single app for our end users.