ManageEngine's OpManager is network performance monitoring software.
$245
for 10 devices
PingPlotter
Score 9.3 out of 10
N/A
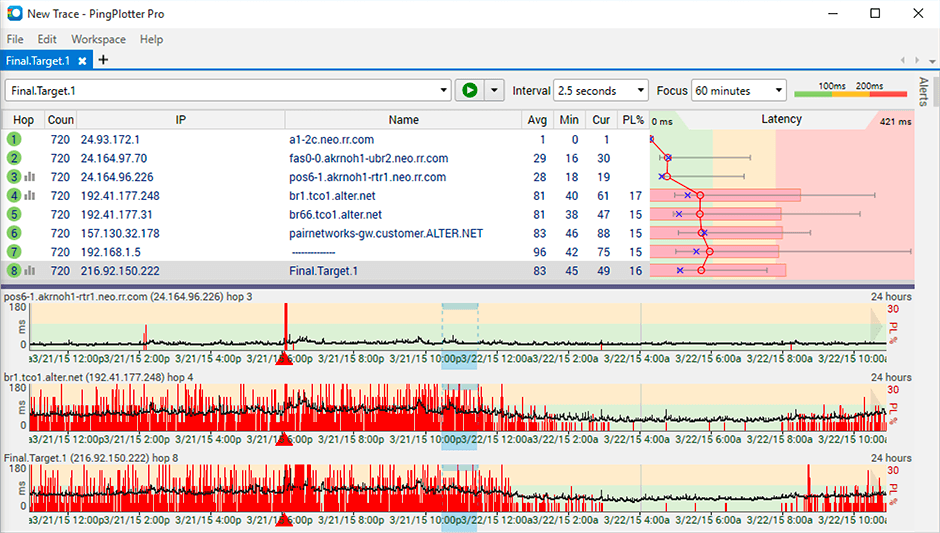
PingPlotter is a graphical traceroute and ping tool that visualizes network performance in a way that makes identifying the source of problems quicker and easier for everyone from online gamers and video streamers to VoIP admins and IT pros. Features for remote deployment, network monitoring, scripting, and a web interface are included along with several additional capabilities.
it is great. Not opensource. Ours was run by a 3rd party provider who had their own version of nmap. The setup and use is simple and get tons of output in reports and alerts. I would like to get more use of this product as I learn more about it
We have an existing relationship with Manage Engine. Manage engine was a better product in comparison with the other products. It has as option to have addons like network configuration Manager, Firewall log analyzer, switch port mapper, Ip address manager and packet analyzer. M…
Compared to the Solarwinds products ManageEngine OpManager is much easier to configure and use. It's also vastly cheaper!
Something like the Solarwinds suite of applications is incredibly complicated and difficult to configure. ManageEngine OpManager is very straightforward to …
ManageEngine OpManager is very easy to manage and easy to scale, and the GUI is far better than all available products in the market. We can have a single dashboard of all offerings of ManageEngine OpManager and they can be distributed through role-based access for monitoring …
ManageEngine OpManager is more user-friendly and easy to use. It is all on your screen to set up and organize. The service logs monitor could display over a month of performance history, and you can make reports for each of the services, which others cannot do. The 3D viewer, …
ManageEngine stands out effectively when compared to
ControlUp monitoring solutions, mainly due to distinct architectural
differences. One key advantage is its versatile deployment options, including
1. inhouse deployment using ManageEngine OpManager is easy and possible, but site24x7 has cloud based monitoring 2. We use both tools but ManageEngine OpManager is user friendly 3. it has free version up to 10 devices to monitor 4. Always available and very less updates …
OpManager teams' technical support was excellent. They helped us throughout the implementation - from the initial discovery phase. It is also very easy to use. Our Infrastructure team was able to use it with minimal training.
OpManager's straightforward license policy simplifies our product selection process significantly. This clarity enables us to make informed decisions aligned with our business needs, facilitating efficient budgeting and resource allocation. The transparent licensing structure …
OpManager is the best solution between all the vendors we reviewed. When completing your request for proposal, be specific as possible with your expectations and needs. Ensure the vendor you select is the correct fit. OpManager selected all the check boxes for our …
A hardware monitor is a software application used for hardware health monitoring. Hardware monitor software can collect a wide range of information related to hardware health, including CPU, temperature, and fan speed.
OpManager, compared to other platforms, is much cheaper, compared to performance and performance, it has the same characteristics as other tools and is quite fast compared to its market competitors. The sensors it has are useful at the level of network equipment, although it …
I think for the price this product offers much more. Maybe not as pretty but certainly is feature rich with the ability to add and manage multiple device brands (Cisco, Cisco Meraki, Fortinet, Palo) in an easy to use and very customizable interface. You can get as deep as you …
Before implementing ME OpManager, I used the Nagios Core monitoring system. When choosing OpManager, we also considered other options. One option was to stay with Nagios. Other monitoring systems we considered were Zabbix and op5 Monitor. The advantage of Opmanager was based on …
ManageEngine OpManager is the best, most suitable Network Device Monitoring solution I have used. It is straightforward to setup, configure, administrate and tailor. It also has a very good UI and a comprehensive device Template repository.
ManageEngine OpManager provides us with the same functionality, the web UI performs better and the price is much less. Support is quick to respond to any issues and the community also has a lot of great information and people willing to help and share their experiences and …
Main reason to select ManageEngine was price/performance ratio. Another reason was great coverage of monitoring of different technologies and modules: network devices of various vendors, network modules like NCM, NFA, support for monitoring of vmware virtualisation , citrix …
During our competitive analysis, we found ManageEngine OpManager was not expensive compared to other vendors. At the same time, there was no compromise on the features such as customized reporting or configuring alerts per our clientele's unique requirements. These are our …
I've tried more products that are not in the list but PingPlotter is the easiest to use and the better one so far because of the interface and function.
PingPlotter has better visualizations and a stronger ability to capture historical data than other tools I've used. This makes it easier to find the root cause by looking back in the log data to find where latency or packet loss occurred.
A balance of a generic tool vs a network equipment product is necessary when investigating network incidents or disruptions. Need to train the engineer to use both tools to perform their analysis and to dive down to the issues as fast as they can. Experience with the tools will …
PingPlotter stacks up very well to Solarwinds NPM and can provide many of the same benchmark tests that Solarwinds can. PingPlotter is most certianly much better at doing Traceroutes than NPM, and you can run a lot of the same reports.
PingPlotter is a basic version of Auvik, although it is easier to setup and there is less intrusion in the customers network. This allows us to use PingPlotter as a prospecting tool and allows to accurately gather network information very quickly. Basic troubleshooting is great …
I have tried a few free products and some paid ones but never really did what I wanted. I just needed a simple, always-on link monitor specifically with a traceroute element and this is what PingPlotter delivers. The others were either overly complex or too expensive, some just …
OpManager offers a set of advantages that allow it to adapt to the needs of the company, guaranteeing effective monitoring of the application networks used in our organization. It has an intuitive and easy-to-use interface. The initial setup went smoothly and in a decent amount of time.
The best scenario and best results are seen when the path does not reuse the same device for the "next hop". It is less well suited in situations where the path is being tricked by the re-use of devices for the next interface. This is seen required in many networks where the proper type of connection is not on an end device and the core device is used to provide a fiber to copper sort of "pass-through" connection.
We changed our RDP port to a non-standard port and monitor servers by that instead of a simple ping. Systems that are busted will still respond to pings.
The dashboard shows us any drives that are almost full. We check this when we do our monthly maintenance.
Monitoring Windows services and event log events and sending notifications when things don't behave as expected.
Adding devices to existing groups and applying a group-wide parameter.
Email alerts can be a bit challenging depending on how email is managed within a company, sometimes adding ManageEngine OpManager to the allowed relay list for Exchange is necessary to receive any alerts
Its a little confusing to see which targets are currently running pings and which ones are displayed in the plots.
Starting and stopping pings requires a right click and that would be better with a play/pause button I think.
Ability to drag and drop the graphs to reorder them.
more columns to show which targets are running and which are displayed. Currently this is done with symbols so you cant sort by just the running targets for example I've found.
The rating I provided is based on the product quality, experience (I have been using OpManager for almost the last 4 years), and relevance of the information/response I generated through Manage Engine OpManager. I have also received good support from OpManager.
I installed it and it just started working. I realized I could then tweak it to show what I needed but didn't have to spend a long time configuring it before use, editing YAML files etc. Maybe that's fine for a network professional, but I only need this software if something goes wrong, and then need it to work quickly out of the box.
At first, we were not able to add our Avaya switches to the configuration backup module, our partner tried to help, but they did not find the solution, we had one remote session with tech support of ME and they solve the problem.
I have not had much contact with the PingPlotter support, only one time have I went to them and it was a positive experience. The questions I had were answered quickly and professionally. I have no issue with the experience I had with the Support team. This was from before and after the purchase of the product.
We have an existing relationship with Manage Engine. Manage engine was a better product in comparison with the other products. It has as option to have addons like network configuration Manager, Firewall log analyzer, switch port mapper, Ip address manager and packet analyzer. Manage engine has an excellent customer support who are always available and response is quick
PingPlotter has better visualizations and a stronger ability to capture historical data than other tools I've used. This makes it easier to find the root cause by looking back in the log data to find where latency or packet loss occurred.