Microsoft Power BI Embedded vs. Watershed LRS

Overview
ProductRatingMost Used ByProduct SummaryStarting Price
Microsoft Power BI Embedded
Score 8.5 out of 10
N/A
A solution from Microsoft to provide customer-facing reports, dashboards, and analytics in applications by using and branding Power BI as one's own. Designed to reduce developer resources by automating the monitoring, management, and deployment of analytics, while getting full control of Power BI features and intelligent analytics.N/A
Watershed LRS
Score 9.0 out of 10
N/A
Watershed LRS is a learning management software solution built to help employers identify skills and competencies.
$0
Pricing
Microsoft Power BI EmbeddedWatershed LRS
Editions & Modules
No answers on this topic
Essentials
$0
Watershed
Custom Pricing
Watershed Enterprise
Custom Pricing
Offerings
Pricing Offerings
Microsoft Power BI EmbeddedWatershed LRS
Free Trial
NoNo
Free/Freemium Version
NoYes
Premium Consulting/Integration Services
NoNo
Entry-level Setup FeeNo setup feeOptional
Additional Details
More Pricing Information
Community Pulse
Microsoft Power BI EmbeddedWatershed LRS
Considered Both Products
Microsoft Power BI Embedded
Chose Microsoft Power BI Embedded
Microsoft Power BI Embedded is already established as a de-facto standard as a business intelligence platform for the enterprise world. It comprises the best features to be delivered for the products being developed by providing a wide range of functionality. For instance, …
Chose Microsoft Power BI Embedded
In general the other software have similar function abilities, however, Power BI embedded is user friendly and is easy to set up, so reduce the time spent in training people; in my organization, we use Microsoft Azure so this matches perfectly. In addition, the support of power …
Chose Microsoft Power BI Embedded
We have previously used various Microsoft products when creating graphs, dashboards, etc., and then presenting those materials. We found that apps like Powerpoint or Excel still did a decent job in presenting the data in the form of visuals, but Microsoft Power BI just did a …
Chose Microsoft Power BI Embedded
I haven’t used any other software that can be compared to this and that is a good thing as this means that this software is the best one on the market. Tough other apps may exist we only use Microsoft Power BI because it is simply the best app out there.
Chose Microsoft Power BI Embedded
Microsoft Power BI is simple and easy to configure than IBM Cogno. Cortana an added advantage
Chose Microsoft Power BI Embedded
I personally found Microsoft Power BI Embedded easier to use than Tableau. Compared to Microsoft Excel, I found it easier to create more complex reports and dashboards against larger datasets. We had a huge amount of data to display and Microsoft Power BI Embedded made this …
Chose Microsoft Power BI Embedded
This tool is perfectly integrated with the rest of the Microsoft applications (such as Excel) that we use in our university.
Chose Microsoft Power BI Embedded
Microsoft Power BI Embedded gives the users an easier method of allowing multiple APIs and the ability to scale up quickly and effectively. While Sage Intacct is useful for a normal ERP, it does not connect well with certain systems, making it difficult to get an overall view …
Chose Microsoft Power BI Embedded
Microsoft Power BI Embedded is a lot more robust compared to Zoho Analytics. It offers more customization options in terms of color and fonts. You can use python in Power BI Embedded which is more commonly used language these days, which is still not possible with Zoho …
Watershed LRS

No answer on this topic

Features
Microsoft Power BI EmbeddedWatershed LRS
BI Standard Reporting
Comparison of BI Standard Reporting features of Product A and Product B
Microsoft Power BI Embedded
-
Ratings
Watershed LRS
9.3
Ratings
13% above category average
Pixel Perfect reports00 Ratings10.00 Ratings
Customizable dashboards00 Ratings8.00 Ratings
Report Formatting Templates00 Ratings10.00 Ratings
Ad-hoc Reporting
Comparison of Ad-hoc Reporting features of Product A and Product B
Microsoft Power BI Embedded
-
Ratings
Watershed LRS
9.3
Ratings
14% above category average
Drill-down analysis00 Ratings10.00 Ratings
Formatting capabilities00 Ratings10.00 Ratings
Integration with R or other statistical packages00 Ratings8.00 Ratings
Report sharing and collaboration00 Ratings9.00 Ratings
Report Output and Scheduling
Comparison of Report Output and Scheduling features of Product A and Product B
Microsoft Power BI Embedded
-
Ratings
Watershed LRS
8.8
Ratings
6% above category average
Publish to Web00 Ratings9.00 Ratings
Publish to PDF00 Ratings9.00 Ratings
Report Versioning00 Ratings8.00 Ratings
Report Delivery Scheduling00 Ratings9.00 Ratings
Delivery to Remote Servers00 Ratings9.00 Ratings
Data Discovery and Visualization
Comparison of Data Discovery and Visualization features of Product A and Product B
Microsoft Power BI Embedded
-
Ratings
Watershed LRS
9.3
Ratings
15% above category average
Pre-built visualization formats (heatmaps, scatter plots etc.)00 Ratings10.00 Ratings
Location Analytics / Geographic Visualization00 Ratings8.00 Ratings
Predictive Analytics00 Ratings10.00 Ratings
Access Control and Security
Comparison of Access Control and Security features of Product A and Product B
Microsoft Power BI Embedded
-
Ratings
Watershed LRS
8.3
Ratings
2% below category average
Multi-User Support (named login)00 Ratings9.00 Ratings
Role-Based Security Model00 Ratings8.00 Ratings
Multiple Access Permission Levels (Create, Read, Delete)00 Ratings6.00 Ratings
Single Sign-On (SSO)00 Ratings10.00 Ratings
Mobile Capabilities
Comparison of Mobile Capabilities features of Product A and Product B
Microsoft Power BI Embedded
-
Ratings
Watershed LRS
9.0
Ratings
14% above category average
Responsive Design for Web Access00 Ratings10.00 Ratings
Mobile Application00 Ratings8.00 Ratings
Dashboard / Report / Visualization Interactivity on Mobile00 Ratings9.00 Ratings
Application Program Interfaces (APIs) / Embedding
Comparison of Application Program Interfaces (APIs) / Embedding features of Product A and Product B
Microsoft Power BI Embedded
-
Ratings
Watershed LRS
9.0
Ratings
14% above category average
REST API00 Ratings8.00 Ratings
Javascript API00 Ratings10.00 Ratings
iFrames00 Ratings10.00 Ratings
Java API00 Ratings10.00 Ratings
Themeable User Interface (UI)00 Ratings8.00 Ratings
Customizable Platform (Open Source)00 Ratings8.00 Ratings
Best Alternatives
Microsoft Power BI EmbeddedWatershed LRS
Small Businesses
BrightGauge
BrightGauge
Score 9.1 out of 10
BrightGauge
BrightGauge
Score 9.1 out of 10
Medium-sized Companies
Reveal
Reveal
Score 10.0 out of 10
Reveal
Reveal
Score 10.0 out of 10
Enterprises
Infor Birst
Infor Birst
Score 5.3 out of 10
Kyvos Semantic Intelligence Layer
Score 9.9 out of 10
All AlternativesView all alternativesView all alternatives
User Ratings
Microsoft Power BI EmbeddedWatershed LRS
Likelihood to Recommend
8.7
(0 ratings)
9.0
(0 ratings)
Usability
-
(0 ratings)
9.0
(0 ratings)
Support Rating
-
(0 ratings)
10.0
(0 ratings)
User Testimonials
Microsoft Power BI EmbeddedWatershed LRS
Likelihood to Recommend
The scenario where it shines more is in the treatment of data that is not easily correlated at first sight, it helps to find causes of unsuccess in productive environments. The only thing that is required is to have properly collected data to feed to Power BI, so it won't be useful in environments where the data is not collected with care, since the representations won't be representatives of the reality.
Read full review
Watershed is a great platform that helps you to understand the overall impact of learning programs on your business and where the improvements are needed.
Read full review
Pros
  • It is very easy to connect multiple data sources for a single report. You can use CSV, Excel, database integration, etc.
  • Power Bi supports Python as well, which makes it a lot easier for us as it is known by most of our team.
Read full review
  • Amazing Data Quality Control.
  • Master Data Management is very helpful.
Read full review
Cons
  • It was a little difficult to work out how to create certain visualisations, but there is extensive online help material to support with this.
  • Had some issues with assigning pro licences but these were quickly resolved
  • Small learning curve but no more so than similar applications
Read full review
  • Scheduling performance can be improved.
  • Price is little bit high.
Read full review
Usability
No answers on this topic
It has all the features that we were trying to get from any other software for our business problems.
Read full review
Support Rating
No answers on this topic
Every time we got the proper support from Watershed.
Read full review
Alternatives Considered
Microsoft Power BI Embedded is already established as a de-facto standard as a business intelligence platform for the enterprise world. It comprises the best features to be delivered for the products being developed by providing a wide range of functionality. For instance, there are supported numerous graphic visualizations of data points such histograms, pie charts, heat maps and so on
Read full review
No answers on this topic
Return on Investment
  • Microsoft Power BI has had a positive impact on our business objectives by allowing everyone to better understand the data that is being presented. Some people can process numbers and charts easily, but interactive visualizations can aid visual learners and just makes the dashboard look a lot nicer with the ability to dive deeper into the numbers (through visualizations). Thus, engagement and understanding have improved.
  • One negative impact is that there is a rather steep learning curve since Microsoft Power BI's language (DAX/M) can be quite different from traditional Excel. Because of that, either you need to hire people who are specialized in Microsoft Power BI, or you need to account for the fact that they will need to be trained (or take time to learn it). Thus, there can be direct costs from hiring new people, or indirect costs through training/employee taking time to learn the software.
  • Another positive impact of Microsoft Power BI is that it got us thinking about how we can be better as an organization in terms of laying out our raw data, organizing data, conducting research into better metrics we can track and report on, etc. Because Microsoft Power BI made the presentation/visualization (+ regular updating/maintenance) part of our dashboard easier for us, we were able to start thinking about additional metrics and additional ways we can improve our reporting.

Read full review
  • Nice Reporting & Statistics.
  • KPI Monitoring and Visual analytics.
Read full review
ScreenShots

Watershed LRS Screenshots

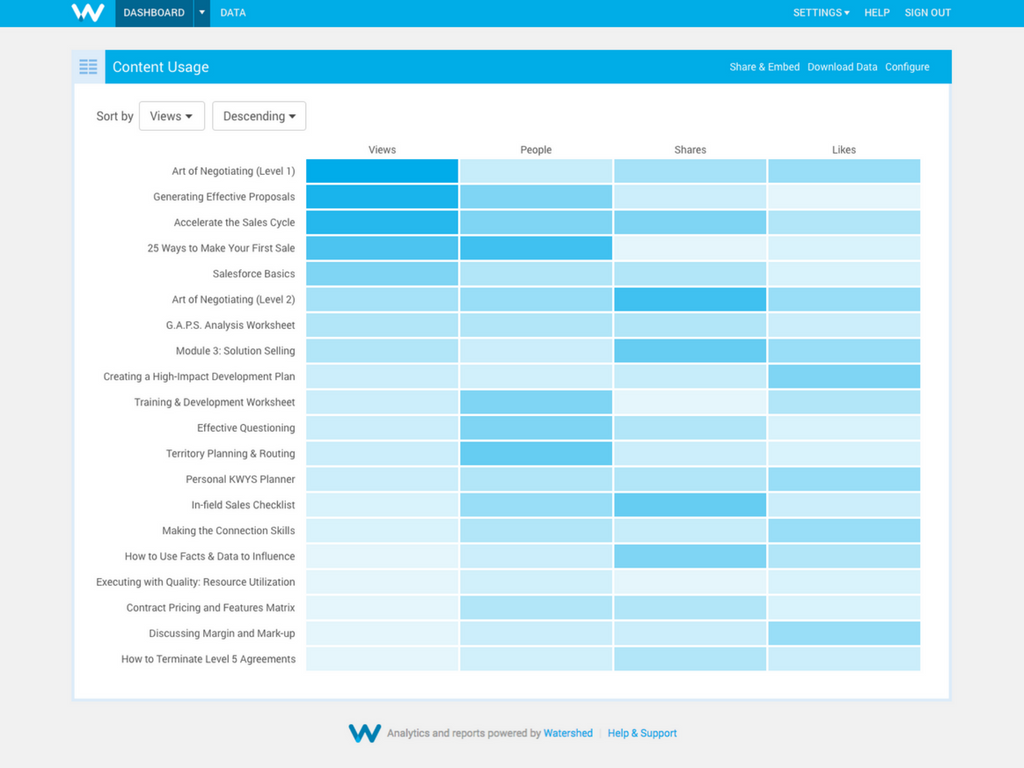
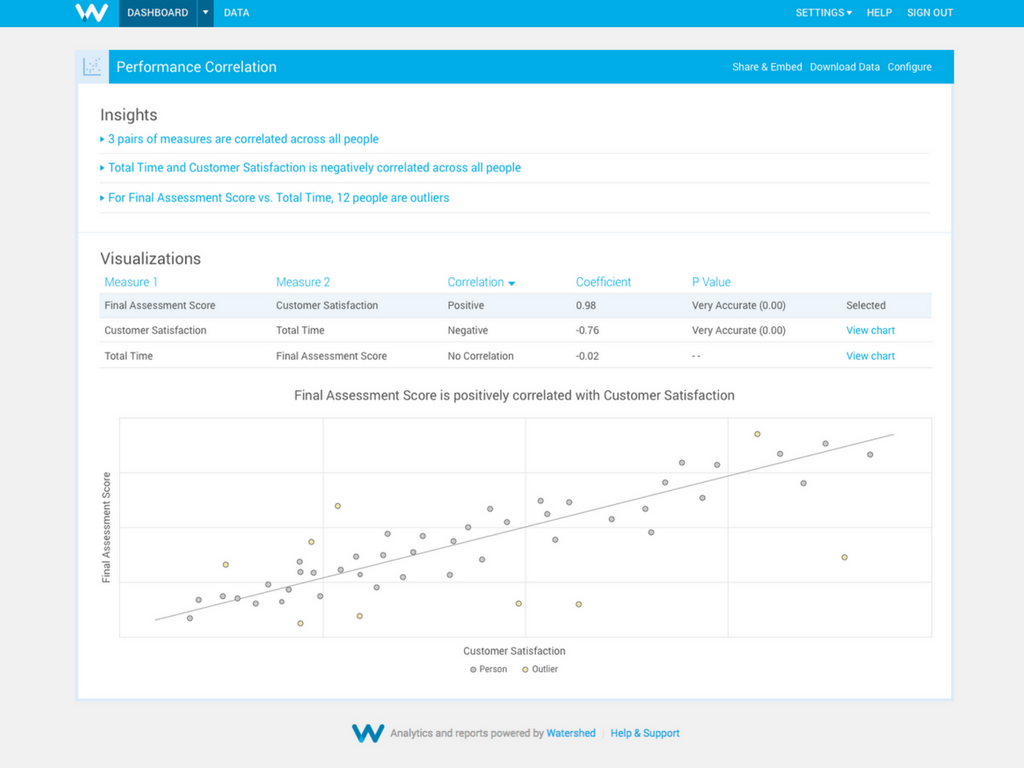
Screenshot of Identify & Eliminate Scrap Learning: Stop wasting time and money on learning that isn’t used or applied on the job.Screenshot of Demonstrate Improvements: Show knowledge acquisition and performance improvements to ensure training effectiveness.Screenshot of Compare Groups & Cohorts: Break out results across your organizational hierarchy to identify patterns in learning performance.Screenshot of Correlate Training with Performance Outcomes: Find out if increased and/or improved training is indeed correlated with higher performance.Screenshot of Find Common Search Terms & Popular Topics: Find the topics people want to learn about to ensure you’re providing the most relevant and comprehensive resources.