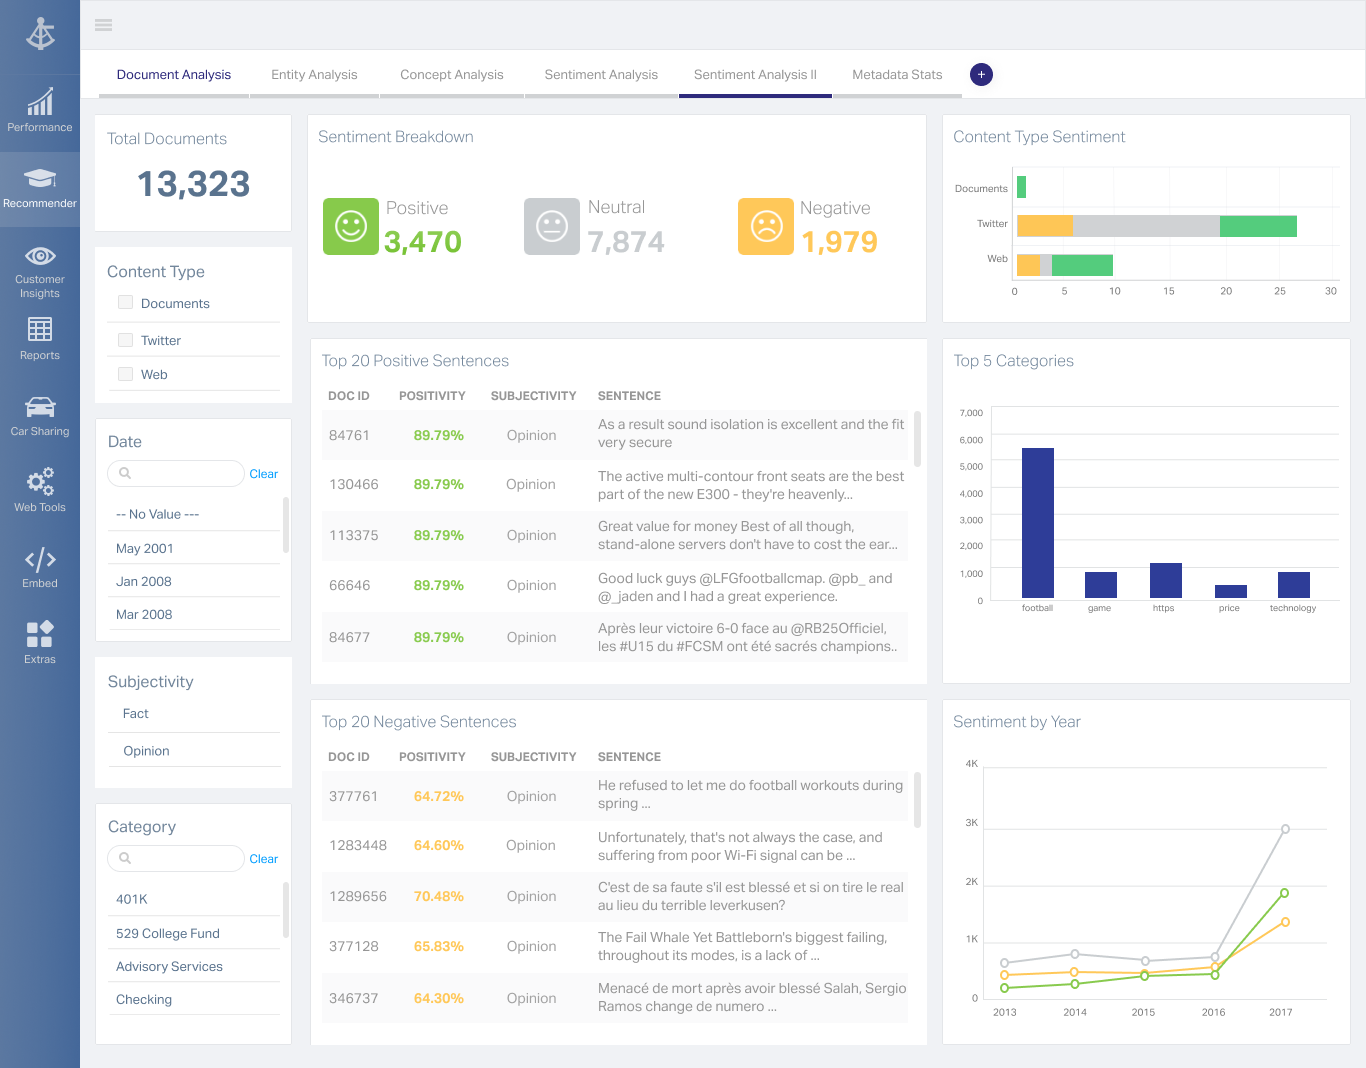
OpenText Magellan Analytics Suite leverages a comprehensive set of data analytics software to identify patterns, relationships and trends through data visualizations and interactive dashboards.
N/A
OpenText Magellan BI & Reporting
Score 7.3 out of 10
N/A
The OpenText Magellan BI & Reporting (formerly OpenText Information Hub (iHub)) component of OpenText™ Magellan™ Analytics Suite is a scalable analytics and data visualization platform that enables IT leaders and their teams to design, deploy, and manage secure, interactive web applications, reports, and dashboards fed by multiple data sources. Magellan BI & Reporting supports high volumes of users, and its integration APIs enable embedded analytic content in any app, displayed on any…
N/A
Pricing
OpenText Magellan
OpenText Magellan BI & Reporting
Editions & Modules
No answers on this topic
No answers on this topic
Offerings
Pricing Offerings
OpenText Magellan
OpenText Magellan BI & Reporting
Free Trial
No
No
Free/Freemium Version
No
No
Premium Consulting/Integration Services
No
No
Entry-level Setup Fee
No setup fee
No setup fee
Additional Details
—
—
More Pricing Information
Community Pulse
OpenText Magellan
OpenText Magellan BI & Reporting
Considered Both Products
OpenText Magellan
Verified User
Anonymous
Chose OpenText Magellan
There is multiple software available in the market to do the reporting and text analytics. Generally, analysts prefer using Python or R. Or we try to use any API available. This software can fulfill almost 80% of those needs without writing the codes. It has the integration …
OpenText Magellan can produce reports that are much more elaborate than PowerBI, which is ideal for users that just need to see a report. On the other hand, PowerBI seems to be better at allowing users to interact with data.
It is vastly superior to these in many ways, for complex reporting it is a much more sophisticated solution. Visualizations are very good. Javascript extensibility is very powerful, others don't support this or as well. Pentaho and MS are both OLAP oriented. Pentaho is moving …
Actuate has been in the industry a while and the open source community make going with Actuate's BIRT a stable decision. Changing report engines can be expensive, so going with a company with a good reputation helps long-term.
Actuate has a HUGE number of features that can tie nicely into almost any ERP but it takes some time to learn and the development community was relatively small compared to the Crystal Reports alternative. Crystal was far easier to learn and had a massive support base. Probably …
Our instance of iHub does not stack up against the other larger BI tools out today. It is a good place to store reports in a central location that allows users to run very specific reports on demand, but it is not a place I would want to store all of my "dashboards". As far …
It depends on extensibility, set-up, access & style. Actuate performs fairly well, but has performance issues because it sits on top of eclipse, which sits on top of Java. Extensibility usually comes at that price. Set-up is fairly straightforward and it can be secured.
iHub is a decent enough environment that it serves our needs. We can have unlimited users and it can tie into AD although we do not use that feature currently. It is a decent place to store all of the reports in one location, even though for us it is not visually appealing to the end users. iHub is not a place where you want to create robust/interactive dashboards for end users to drill through and follow a "story".
Setting up a "dashboard" is extremely lacking in functionality. The different chart widgets you place on the page do not interact with each other. When you select an item from one do not expect it to highlight or filter another.
The speed and stability are not great, but maybe that is just our environment not being up to snuff...even though we are above the "recommended" settings.
The main GUI for a user is TERRIBLE. You log into a File Tree format where you have to navigate folders to reach the correct dashboard. There are ways around this, but it would either require an expensive payment to the Professional Services team to revamp to UI or another option they gave us was to create the "Default Dashboard" and provide that link to users and in that Dashboard, you use a new tab to include the navigation back to the main screen so that at least on the initial load the user is taken to a friendly looking dashboard instead of a file tree.
I am no longer working for the company that was using Actuate but I believe they would continue to use it because the stitching costs would be to high. It would require a complete rewrite of the reports and the never version of Actuate (BIRT) even required an almost complete report rewrite
It is quite intuitive to use. It is fit specifically for doing sentiment, emotion, and intention analysis as well as text classification and text summarization. I would have given 10 if it is fit for the purpose of doing image processing and analysis as well. There is a huge market to analyze video and image data.
It is vastly superior to these in many ways, for complex reporting it is a much more sophisticated solution. Visualizations are very good. Javascript extensibility is very powerful, others don't support this or as well. Pentaho and MS are both OLAP oriented. Pentaho is moving more toward big data, which was not our primary focus. Others are stuck in the Crystal Reports Band metaphor.
Our instance of iHub does not stack up against the other larger BI tools out today. It is a good place to store reports in a central location that allows users to run very specific reports on demand, but it is not a place I would want to store all of my "dashboards". As far as holding individual reports that are specific to an individual need, it is a great tool. If you want to create a report that will be used as a Template for a Form or a Label, iHub is a good choice to store and schedule the report or call it via API to generate it and return it to your calling app.
Actuate can handle 50 to 60 sub reports inside a report very well.
Dynamically creating the datasource, chart, graph, reports are the main advantages. We can do any level of drilling, and can create a performance matrix dashboard efficiently.