The OpenText Magellan BI & Reporting (formerly OpenText Information Hub (iHub)) component of OpenText™ Magellan™ Analytics Suite is a scalable analytics and data visualization platform that enables IT leaders and their teams to design, deploy, and manage secure, interactive web applications, reports, and dashboards fed by multiple data sources. Magellan BI & Reporting supports high volumes of users, and its integration APIs enable embedded analytic content in any app, displayed on any…
N/A
ThoughtSpot
Score 8.2 out of 10
N/A
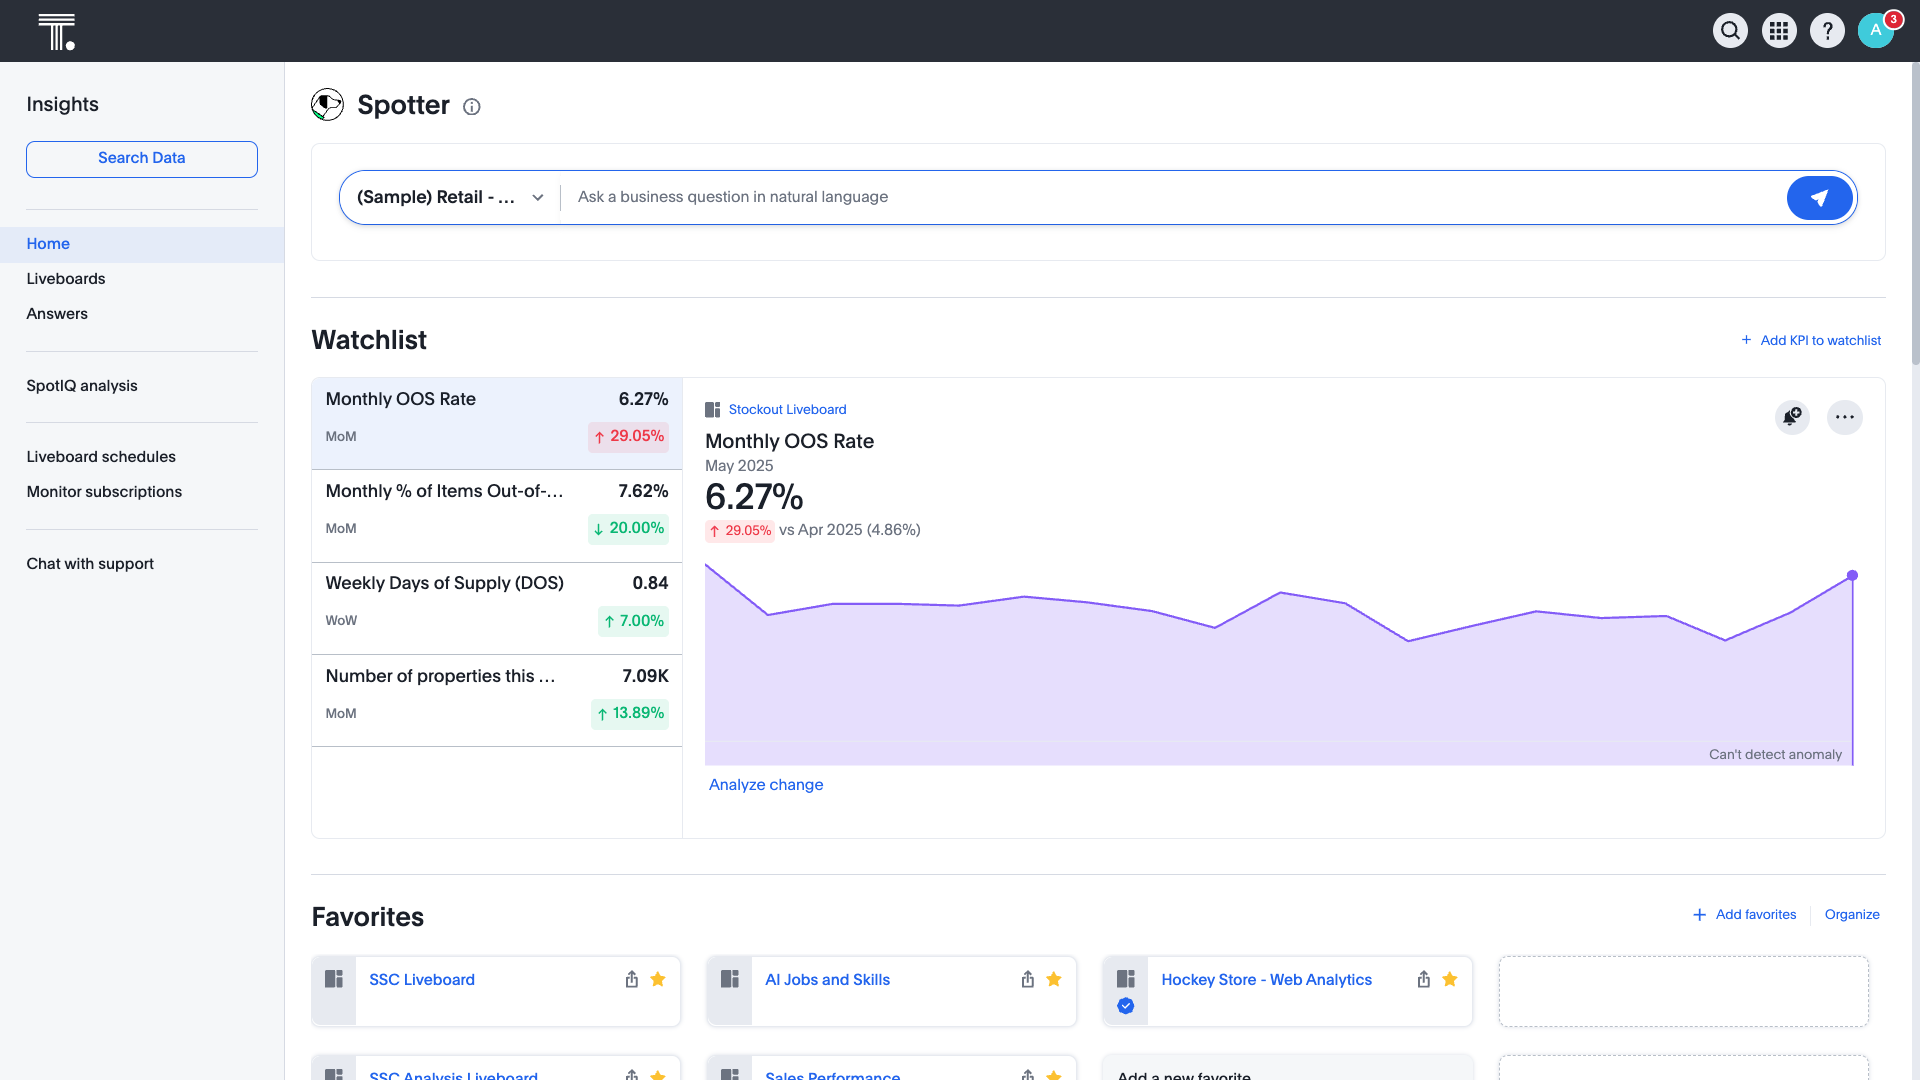
ThoughtSpot is an Agentic Analytics Platform for enterprises where users ask data questions using natural language and get answers with AI. Code-first for data teams and code-free for business users, ThoughtSpot can handle large, complex cloud data at scale.
$50
per month (billed annually) per user (25-1000 users)
Pricing
OpenText Magellan BI & Reporting
ThoughtSpot
Editions & Modules
No answers on this topic
Thoughtspot Analytics - Pro
$50
per month (billed annually) per user (25-1000 users)
Our instance of iHub does not stack up against the other larger BI tools out today. It is a good place to store reports in a central location that allows users to run very specific reports on demand, but it is not a place I would want to store all of my "dashboards". As far …
I think PBI was terribly slow and clunky. UI was outdated. Solution was expensive for what we needed. ThoughtSpot was worlds different (in a better way).
It is more flexible and PowerBI, easier work online, and share information with many users. Also the dashboards and beautiful, and the user experience is better. Performance used to be faster.
We use Looker for different use cases but, when it comes to reporting and sharing …
ThoughtSpot's user friendly interface, faster and accurate results, low-code support for building insights and vast availability of native charts, AI powered dashboards helps in faster decision making and helps in driving better business results. The mobile APP that ThoughtSpot …
It is more cost effective when compared to Tableau and more easy to use. ThoughtSpot integrates well with modern cloud data platforms like Snowflake, Google, and Bigquery, making it easy to analyze large datasets in real time. Sync insights into cloud tools. Users can sync …
ThoughtSpot is easy to build charts and it is probably the easiest tool to build things quickly. The quality of the charts is middle if not lower pack compared to others. The dbt integration is wildly oversold and does not add any value.
Thoughtspot is a fairly new tool when compared to Tableau. I'll just list the benefits of each one of threse below - Tableau - 1. Much more customizable the Thoughtspot
ThoughtSpot is the leader in embedded analytics and is much easier to work with massive volumes of data. None of the other tools listed had both of those functionalities, which were most important to us. There are other features that they have such as easier drill down, …
Compare to Kibana, which was we used previously, ThoughtSpot is definitely better in terms of UI, visualizations, usability, and the SpotIQ/ML components. The only disadvantage for ThoughtSpot is the lack of drill-down function/click-on filters.
We have been using tableau as the enterprise reporting tool and felt sending data to external people had few restrictions hence we tried with ThoughtSpot.
We liked the support we were getting in the sales process (this has continued to be fantastic), I personally knew several people in the company. In the pilot we ran, our devs enjoyed working with ThoughtSpot.
We selected ThoughtSpot with the promise that it would evolve into a Google search for business insights. To date, it has not gotten close in my opinion.
iHub is a decent enough environment that it serves our needs. We can have unlimited users and it can tie into AD although we do not use that feature currently. It is a decent place to store all of the reports in one location, even though for us it is not visually appealing to the end users. iHub is not a place where you want to create robust/interactive dashboards for end users to drill through and follow a "story".
By using the power of cloud platforms like bigquery or snowflake, ThoughtSpot can deliver performance at scale ensuring that even the largest organization can quickly analyze and visualize data. The ability to seamlessly share live dashboards fosters collaborations, ensuring everyone in the organization is working from the same data source and aligned in decision making.
Beautiful visualizations. The visuals are distinct, clean, and easy to discern from one another.
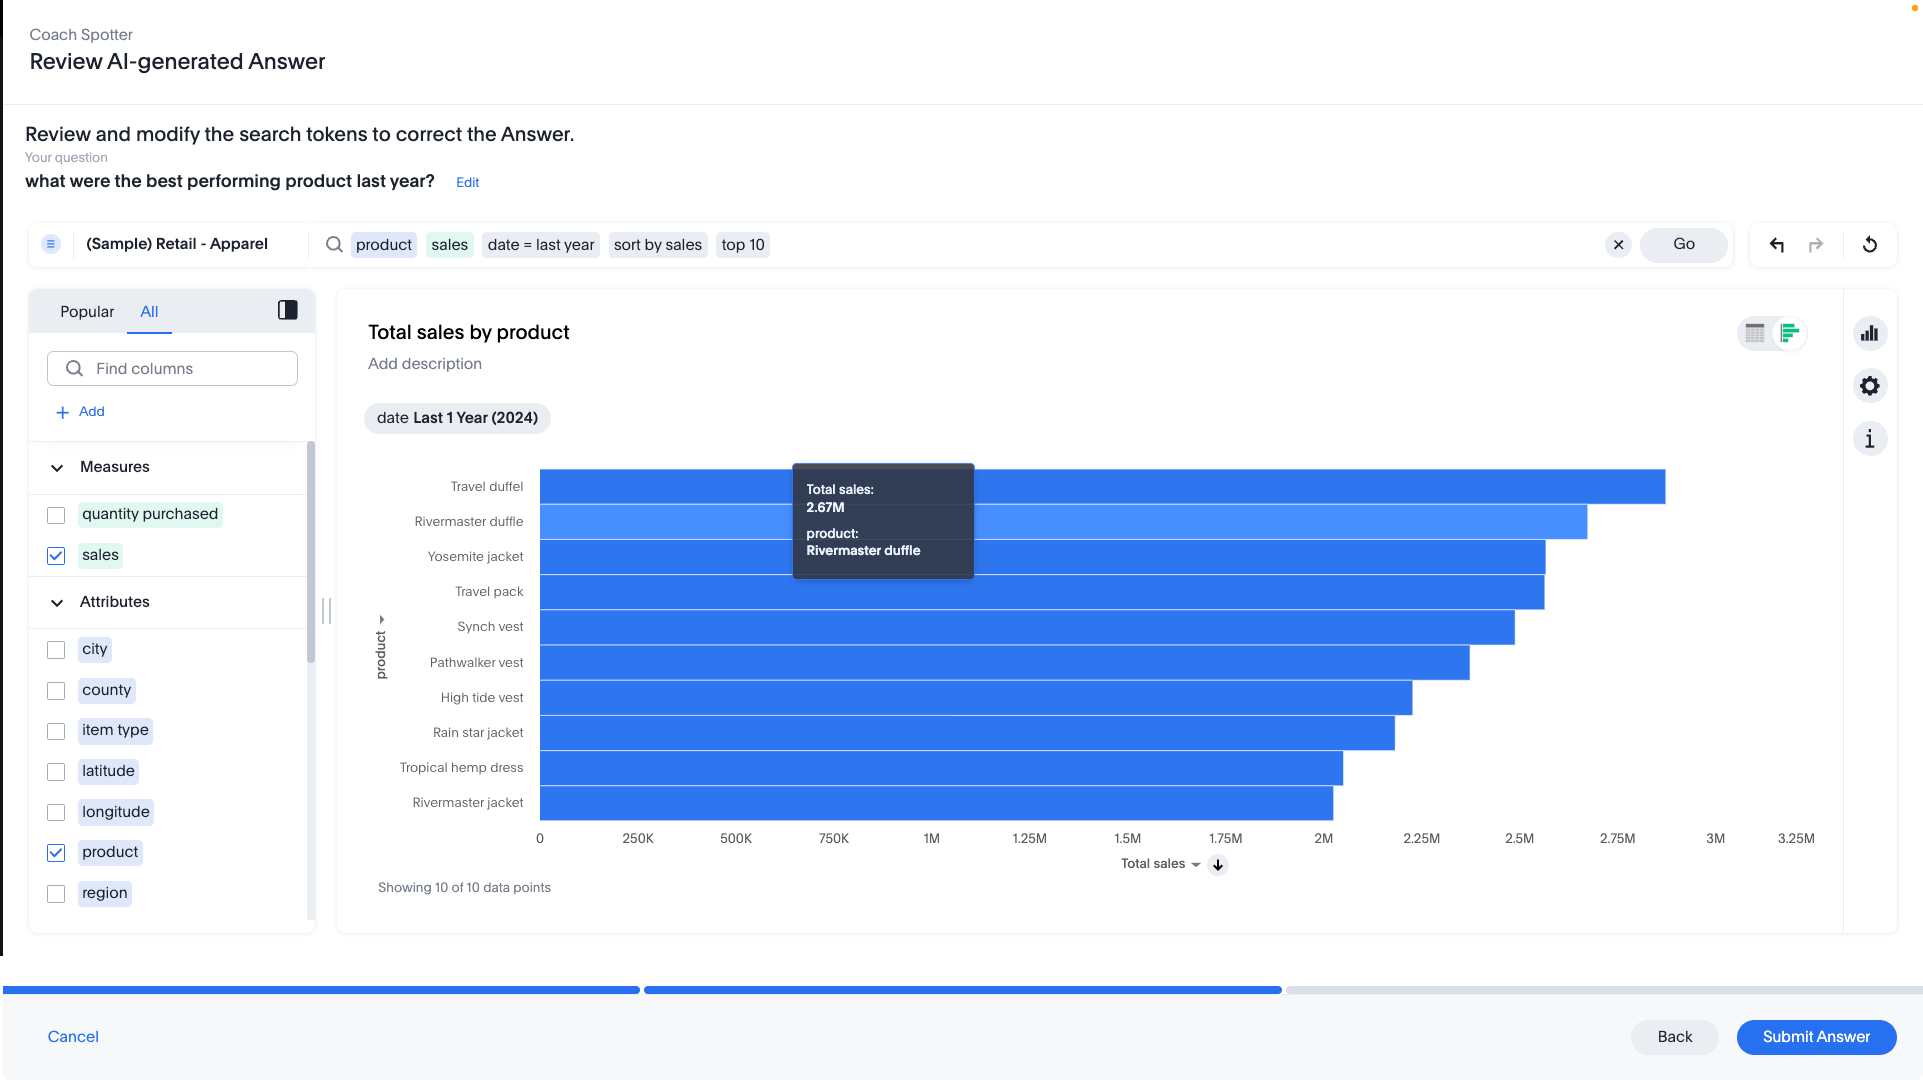
Intelligent querying functionality. When looking to manipulate the data, the search function makes it easy to manipulate the features in the data, along with aggregating them in the way you'd like.
Embedding! It has been a smooth process thus far for our product & technical teams to work with ThoughtSpot and bring it into our product.
Setting up a "dashboard" is extremely lacking in functionality. The different chart widgets you place on the page do not interact with each other. When you select an item from one do not expect it to highlight or filter another.
The speed and stability are not great, but maybe that is just our environment not being up to snuff...even though we are above the "recommended" settings.
The main GUI for a user is TERRIBLE. You log into a File Tree format where you have to navigate folders to reach the correct dashboard. There are ways around this, but it would either require an expensive payment to the Professional Services team to revamp to UI or another option they gave us was to create the "Default Dashboard" and provide that link to users and in that Dashboard, you use a new tab to include the navigation back to the main screen so that at least on the initial load the user is taken to a friendly looking dashboard instead of a file tree.
It would be great if ThoughtSpot can add the feature to filter by clicking on visualizations. i.e if I click on a particular data point in the chart if the full dashboard can filter just for that particular data point.
Color coding the heatmap with different colors like green to orange to red.
We have had success with the initial use cases and there are more use cases that can receive return on investment. I don't give it a 10 because other products like Tableau are building functionality that may start to compete in the coming years.
The tool is easy to use if you know what you are doing and looking for. I know as they work towards improvements and simple language it will become even easier, but as of now they are doing a great job but there is room for improvement.
I give it this meeting because the team is not only help able to help us in the current solutions but also amazing and taking feedback and feeding it back to their development team which includes more products and features into ThoughtSpot
Our instance of iHub does not stack up against the other larger BI tools out today. It is a good place to store reports in a central location that allows users to run very specific reports on demand, but it is not a place I would want to store all of my "dashboards". As far as holding individual reports that are specific to an individual need, it is a great tool. If you want to create a report that will be used as a Template for a Form or a Label, iHub is a good choice to store and schedule the report or call it via API to generate it and return it to your calling app.
It is more flexible and PowerBI, easier work online, and share information with many users. Also the dashboards and beautiful, and the user experience is better. Performance used to be faster. We use Looker for different use cases but, when it comes to reporting and sharing information, ThoughSpot is much better.
Because it is very reliable, inside the situation, we need strong internet connection to access a lot of data but easily never had any downtime except during the upgrades
Time to market ROI is massive vs hiring the full-time dedicated team to build and maintain a frontend multi-tenant SaaS data viz product.
It will be interesting to see over time how the advanced features play out in terms of usability and end value, such as Natural Search, which we are very excited about, and the machine learning tools.