11Ants vs. Board
11Ants vs. Board
| Product | Rating | Most Used By | Product Summary | Starting Price |
|---|---|---|---|---|
 11Ants | N/A | 11Ants SaaS data insights solution helps retailers truly understand customer behavior to make better decisions faster. Retail data gold tends to be well hidden. Yet most retailers count on shallow metrics like sales, units sold and margins that reveal little. 11Ants digs deeper, with the goal of improving margin revenue stream by commercializing data and insights to suppliers. | N/A | |
 Board | Enterprise companies (1,001+ employees) | Board is presented as an enterprise planning platform, offered as a solution to accelerate business performance and enable continuous planning with greater forecast accuracy to drive confident, aligned decisions. | N/A |
| 11Ants | Board | |||||||||||||||
|---|---|---|---|---|---|---|---|---|---|---|---|---|---|---|---|---|
| Editions & Modules | No answers on this topic | No answers on this topic | ||||||||||||||
| Offerings |
| |||||||||||||||
| Entry-level Setup Fee | No setup fee | No setup fee | ||||||||||||||
| Additional Details | — | — | ||||||||||||||
| More Pricing Information | ||||||||||||||||
| 11Ants | Board |
|---|
| 11Ants | Board | ||||||||||||||||||||||||
|---|---|---|---|---|---|---|---|---|---|---|---|---|---|---|---|---|---|---|---|---|---|---|---|---|---|
| BI Standard Reporting |
| ||||||||||||||||||||||||
| Ad-hoc Reporting |
| ||||||||||||||||||||||||
| Report Output and Scheduling |
| ||||||||||||||||||||||||
| Data Discovery and Visualization |
| ||||||||||||||||||||||||
| Access Control and Security |
| ||||||||||||||||||||||||
| Mobile Capabilities |
| ||||||||||||||||||||||||
| Budgeting, Planning, and Forecasting |
| ||||||||||||||||||||||||
| Consolidation and Close |
| ||||||||||||||||||||||||
| Financial Reporting and Compliance |
| ||||||||||||||||||||||||
| Analytics and Reporting |
| ||||||||||||||||||||||||
| Integration |
|
| 11Ants | Board | |
|---|---|---|
| Likelihood to Recommend | - (0 ratings) | 6.2 (0 ratings) |
| Likelihood to Renew | - (0 ratings) | 9.1 (0 ratings) |
| Usability | - (0 ratings) | 7.7 (0 ratings) |
| Availability | - (0 ratings) | 9.1 (0 ratings) |
| Performance | - (0 ratings) | 9.1 (0 ratings) |
| Support Rating | - (0 ratings) | 8.0 (0 ratings) |
| In-Person Training | - (0 ratings) | 7.3 (0 ratings) |
| Implementation Rating | - (0 ratings) | 7.2 (0 ratings) |
| Configurability | - (0 ratings) | 9.1 (0 ratings) |
| Ease of integration | - (0 ratings) | 9.1 (0 ratings) |
| Product Scalability | - (0 ratings) | 9.1 (0 ratings) |
| Vendor post-sale | - (0 ratings) | 9.1 (0 ratings) |
| Vendor pre-sale | - (0 ratings) | 9.1 (0 ratings) |
| 11Ants | Board | |
|---|---|---|
| Likelihood to Recommend |  No answers on this topic | 
 Christos Socratous Marketing and Branding |
| Pros | No answers on this topic |
|
| Cons | No answers on this topic |
|
| Likelihood to Renew | No answers on this topic |
 Gaurav Suri Finance Business Partner - Business Intelligence Developer |
| Usability | No answers on this topic |
 Jeff Lynn Finance Director |
| Performance | No answers on this topic |
|
| Support Rating | No answers on this topic |
|
| In-Person Training | No answers on this topic |
Gaurav Suri Finance Business Partner - Business Intelligence Developer |
| Implementation Rating | No answers on this topic |
|
| Alternatives Considered | No answers on this topic |
|
| Return on Investment | No answers on this topic |
|
| ScreenShots | Board Screenshots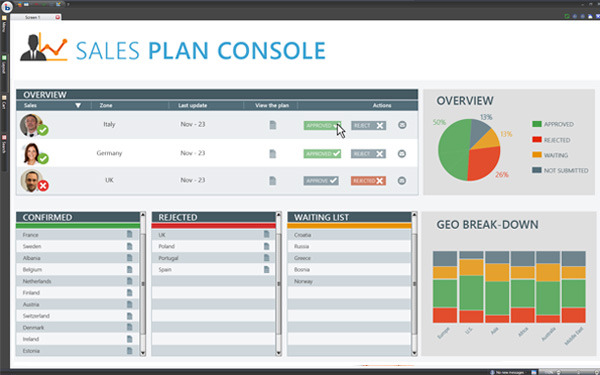  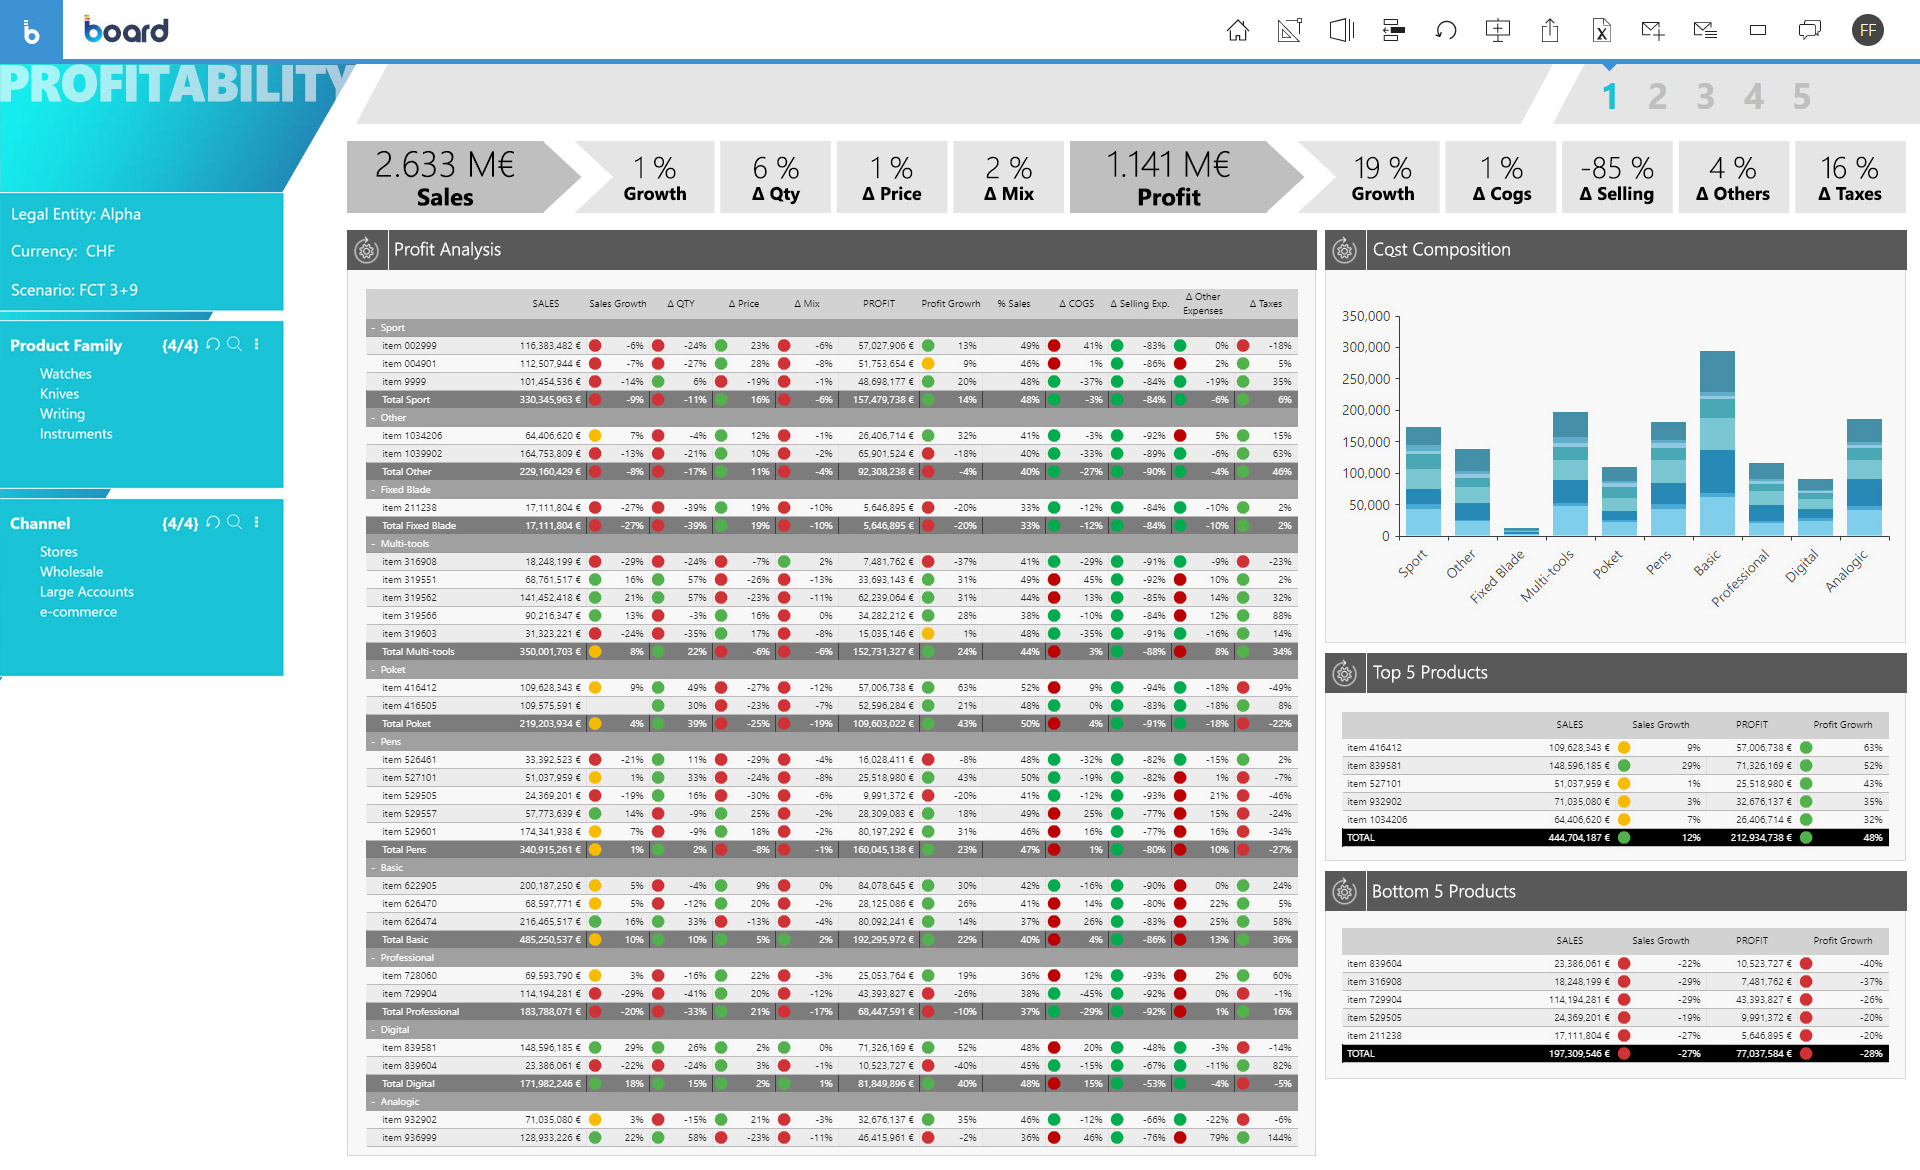 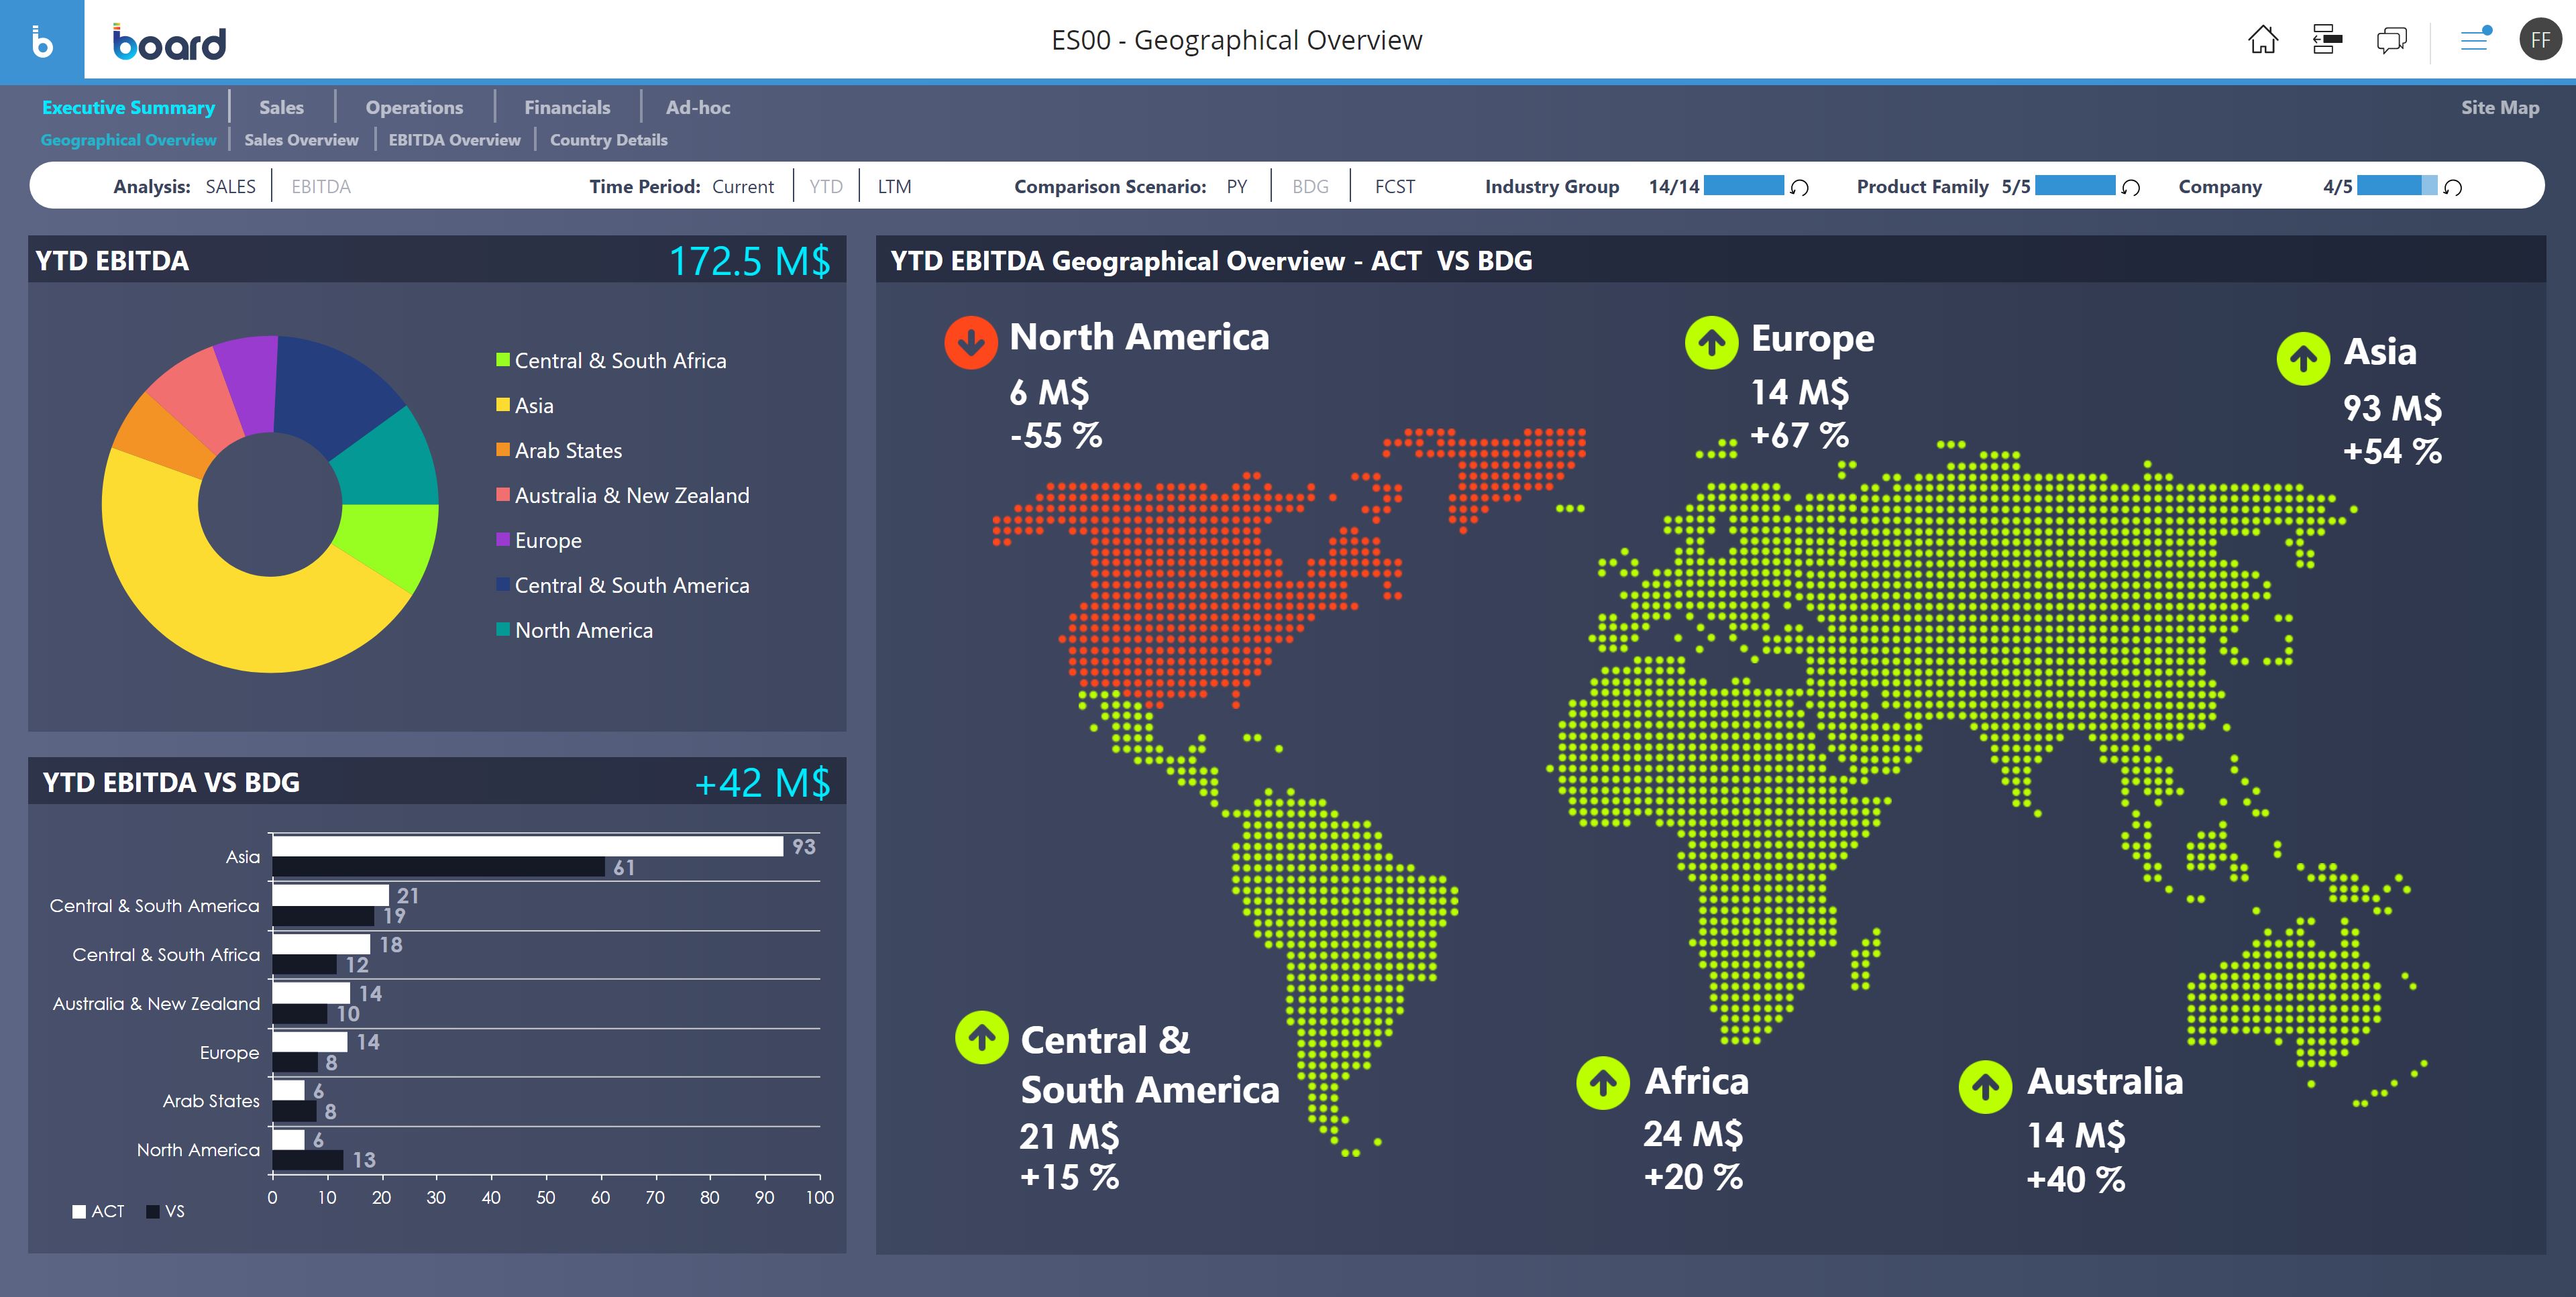   |