
Eileen Wilson
Owner
Chose BrightGauge
BrightGauge is part of the ConnectWise suite, we use PSA and CPQ. We have BG integrated with PSA and QBO.

| Product | Rating | Most Used By | Product Summary | Starting Price |
|---|---|---|---|---|
 BrightGauge | N/A | BrightGauge is a BI tool from ConnectWise that puts essential information in one place, providing visibility for more informed decisions. The user can customize BrightGauge dashboards and sync other business tools in its BI dashboard software for ultimate visibility. Users can also display data with embeddable gauges on public sites. | $325 per month | |
 OpenText Magellan | N/A | OpenText Magellan Analytics Suite leverages a comprehensive set of data analytics software to identify patterns, relationships and trends through data visualizations and interactive dashboards. | N/A |
| BrightGauge | OpenText Magellan | |||||||||||||||
|---|---|---|---|---|---|---|---|---|---|---|---|---|---|---|---|---|
| Editions & Modules |
| No answers on this topic | ||||||||||||||
| Offerings |
| |||||||||||||||
| Entry-level Setup Fee | $499 one-time fee | No setup fee | ||||||||||||||
| Additional Details | Set up fee is waived for Enterprise+ customers. A discount is offered for annual billing. | — | ||||||||||||||
| More Pricing Information | ||||||||||||||||
| BrightGauge | OpenText Magellan | |
|---|---|---|
| Considered Both Products |  BrightGauge Eileen Wilson Owner Chose BrightGauge BrightGauge is part of the ConnectWise suite, we use PSA and CPQ. We have BG integrated with PSA and QBO.  Dale Bradford Network Administrator Chose BrightGauge We looked very briefly at Solar Winds, but due to Connectwise the reporting was not very accurate and was conflicted.  Ian Hansen IT Services Director Chose BrightGauge I'm not aware of any other competitors to Bright Gauge that we selected. They seem to be very close to managed IT service providers and have been great at tailoring their support to the PSAs like ConnectWise, AutoTask, etc. I can see Bright Gauge getting more and more popular …  Karl Fulljames VP of Operations Chose BrightGauge BG support is amazing. Connectsmart support is so bad, that's why I changed |  OpenText Magellan  Martin Rubens IT solutions Manager Chose OpenText Magellan OpenText Magellan can produce reports that are much more elaborate than PowerBI, which is ideal for users that just need to see a report. On the other hand, PowerBI seems to be better at allowing users to interact with data.  Christopher Noyes Director Advertising Technology Chose OpenText Magellan It is vastly superior to these in many ways, for complex reporting it is a much more sophisticated solution. Visualizations are very good. Javascript extensibility is very powerful, others don't support this or as well. Pentaho and MS are both OLAP oriented. Pentaho is moving …  Bri Gipson Sr. Systems Engineer Chose OpenText Magellan Actuate has been in the industry a while and the open source community make going with Actuate's BIRT a stable decision. Changing report engines can be expensive, so going with a company with a good reputation helps long-term.  Shawn Thomas Sr Business Systems Analyst Chose OpenText Magellan Actuate has a larger learning curve than other products.  Todd Bellamy Systems Analyst Chose OpenText Magellan Actuate has a HUGE number of features that can tie nicely into almost any ERP but it takes some time to learn and the development community was relatively small compared to the Crystal Reports alternative. Crystal was far easier to learn and had a massive support base. Probably … |
| BrightGauge | OpenText Magellan | |||||||||||||||||||||
|---|---|---|---|---|---|---|---|---|---|---|---|---|---|---|---|---|---|---|---|---|---|---|
| BI Standard Reporting |
| |||||||||||||||||||||
| Ad-hoc Reporting |
| |||||||||||||||||||||
| Report Output and Scheduling |
| |||||||||||||||||||||
| Data Discovery and Visualization |
| |||||||||||||||||||||
| Access Control and Security |
| |||||||||||||||||||||
| Mobile Capabilities |
| |||||||||||||||||||||
| Application Program Interfaces (APIs) / Embedding |
|
| BrightGauge | OpenText Magellan | |
|---|---|---|
| Small Businesses |  Yellowfin Score 8.0 out of 10 | BrightGauge Score 9.1 out of 10 |
| Medium-sized Companies |  Reveal Score 10.0 out of 10 | Reveal Score 10.0 out of 10 |
| Enterprises |  Kyvos Semantic Intelligence Layer Score 9.9 out of 10 | Kyvos Semantic Intelligence Layer Score 9.9 out of 10 |
| All Alternatives | View all alternatives | View all alternatives |
| BrightGauge | OpenText Magellan | |
|---|---|---|
| Likelihood to Recommend | 9.2 (0 ratings) | 9.0 (0 ratings) |
| Likelihood to Renew | - (0 ratings) | 3.9 (0 ratings) |
| Usability | 8.4 (0 ratings) | 9.0 (0 ratings) |
| Support Rating | 10.0 (0 ratings) | 9.0 (0 ratings) |
| BrightGauge | OpenText Magellan | |
|---|---|---|
| Likelihood to Recommend |
 Jeremy Herman Security Engineer |
Bri Gipson Sr. Systems Engineer |
| Pros |
|
Martin Rubens IT solutions Manager |
| Cons |
|
|
| Likelihood to Renew | No answers on this topic |
Todd Bellamy Systems Analyst |
| Usability |
|
|
| Support Rating |
|
 Jeffrey Fischer Business and Channel Development Director |
| Alternatives Considered |
Ian Hansen IT Services Director |
Christopher Noyes Director Advertising Technology |
| Return on Investment |
 Ali Gaeta Manager of Managed Services |
|
| ScreenShots | OpenText Magellan Screenshots   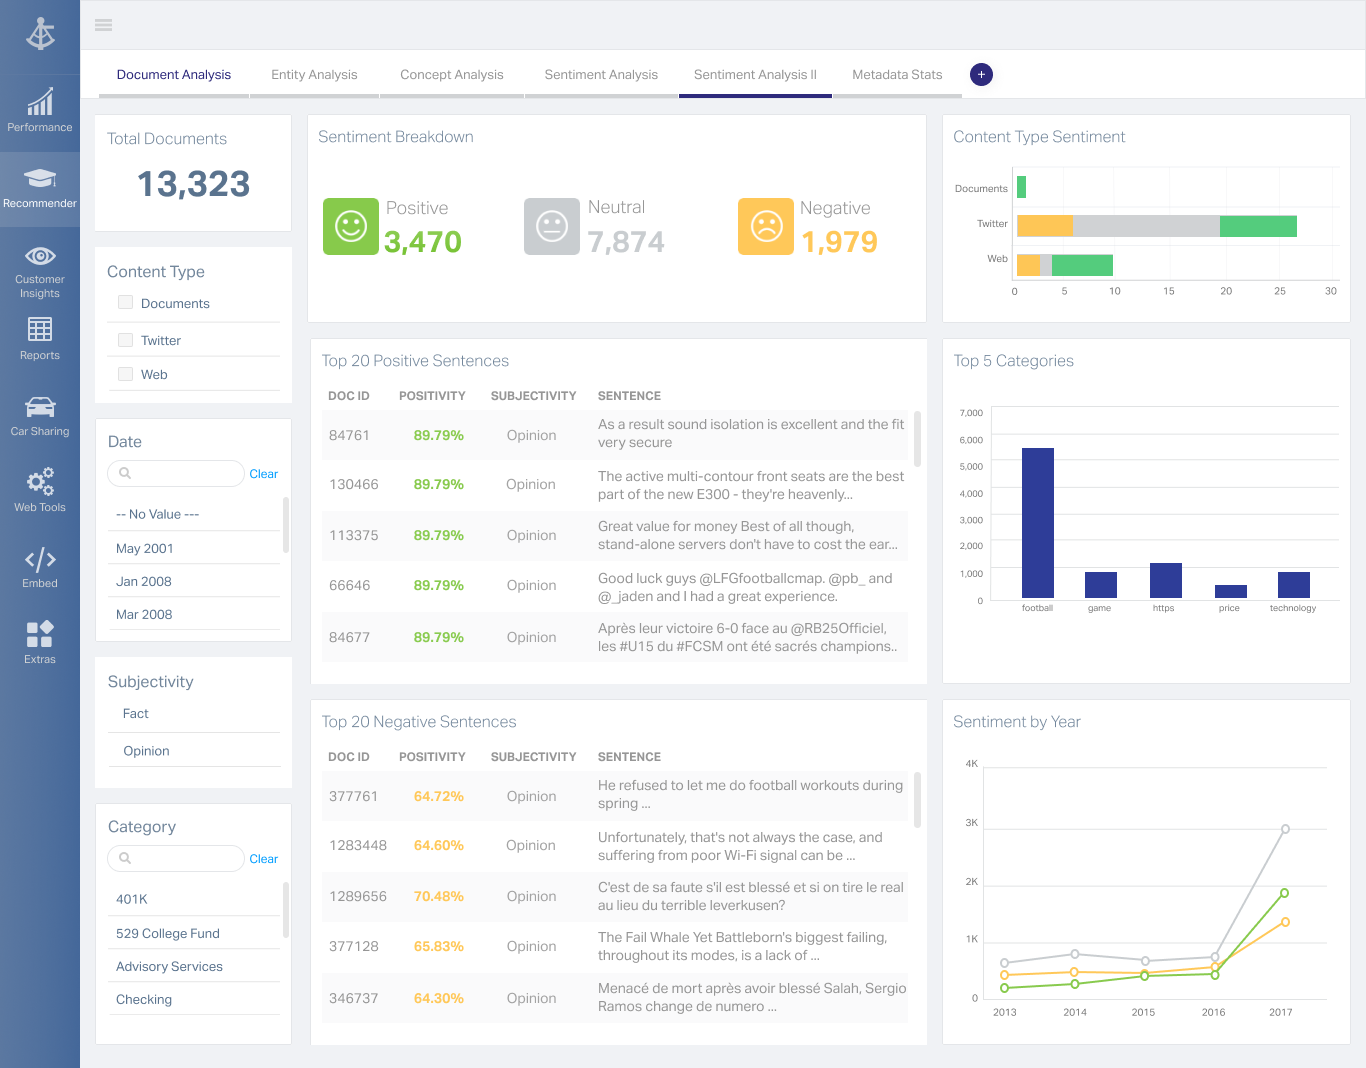 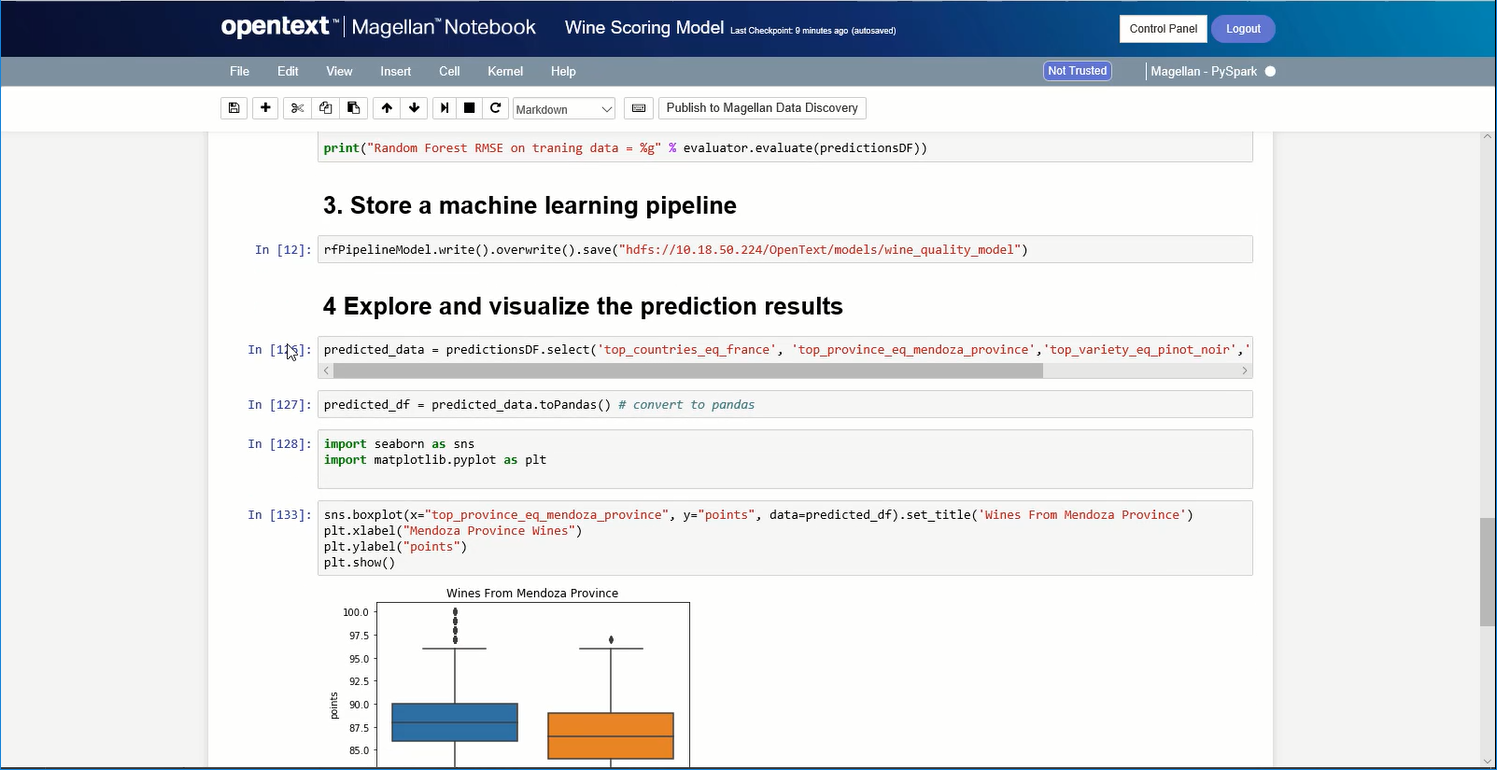 |