Chartbeat delivers real-time analytics, insights, and transformative tools for content teams around the world, to help improve audience engagement, inform editorial decisions, and increase loyalty.
N/A
WhatUsersDo
Score 9.6 out of 10
N/A
WhatUsersDo is a web analytics solution built around using real user testing to optimize desktop, tablet, and mobile experiences.
N/A
Pricing
Chartbeat
WhatUsersDo
Editions & Modules
No answers on this topic
No answers on this topic
Offerings
Pricing Offerings
Chartbeat
WhatUsersDo
Free Trial
Yes
No
Free/Freemium Version
No
No
Premium Consulting/Integration Services
No
No
Entry-level Setup Fee
No setup fee
No setup fee
Additional Details
Chartbeat pricing is based on monthly site page views. Discounts are applied to multi-year contracts. The Basic Plan includes the Real-time Dashboard, Historical Dashboard, Heads Up Display, Reports, Big Board, iOS and Android app, and Real-time API endpoints.
The Plus Plan includes all of the Basic Plan features, plus ONE of the following Premium features: Headline Testing, Advanced Queries, or Multi-Site View.
The Premium Plan includes all of the Basic Plan features, plus ALL Premium features: Headline Testing, Advanced Queries, Multi-Site View, and enterprise-level support and custom trainings.
It is well suited to keeping me toward a specified goal, and gives me concrete numbers and gives me an idea of what we need to do to meet our goals. It's less appropriate if you want something more than pageviews, and doesn't really do a lot for video views.
If you want to watch a user journey through your website with commentary, this tool is the perfect one to use, even if it does take quite a few hours for responses. I think if you want to test specific functions, quickly, there are better tools for doing this. Reviewers are very honest and can be quite harsh, so you need to have an open mind to criticism, as what they say is very useful.
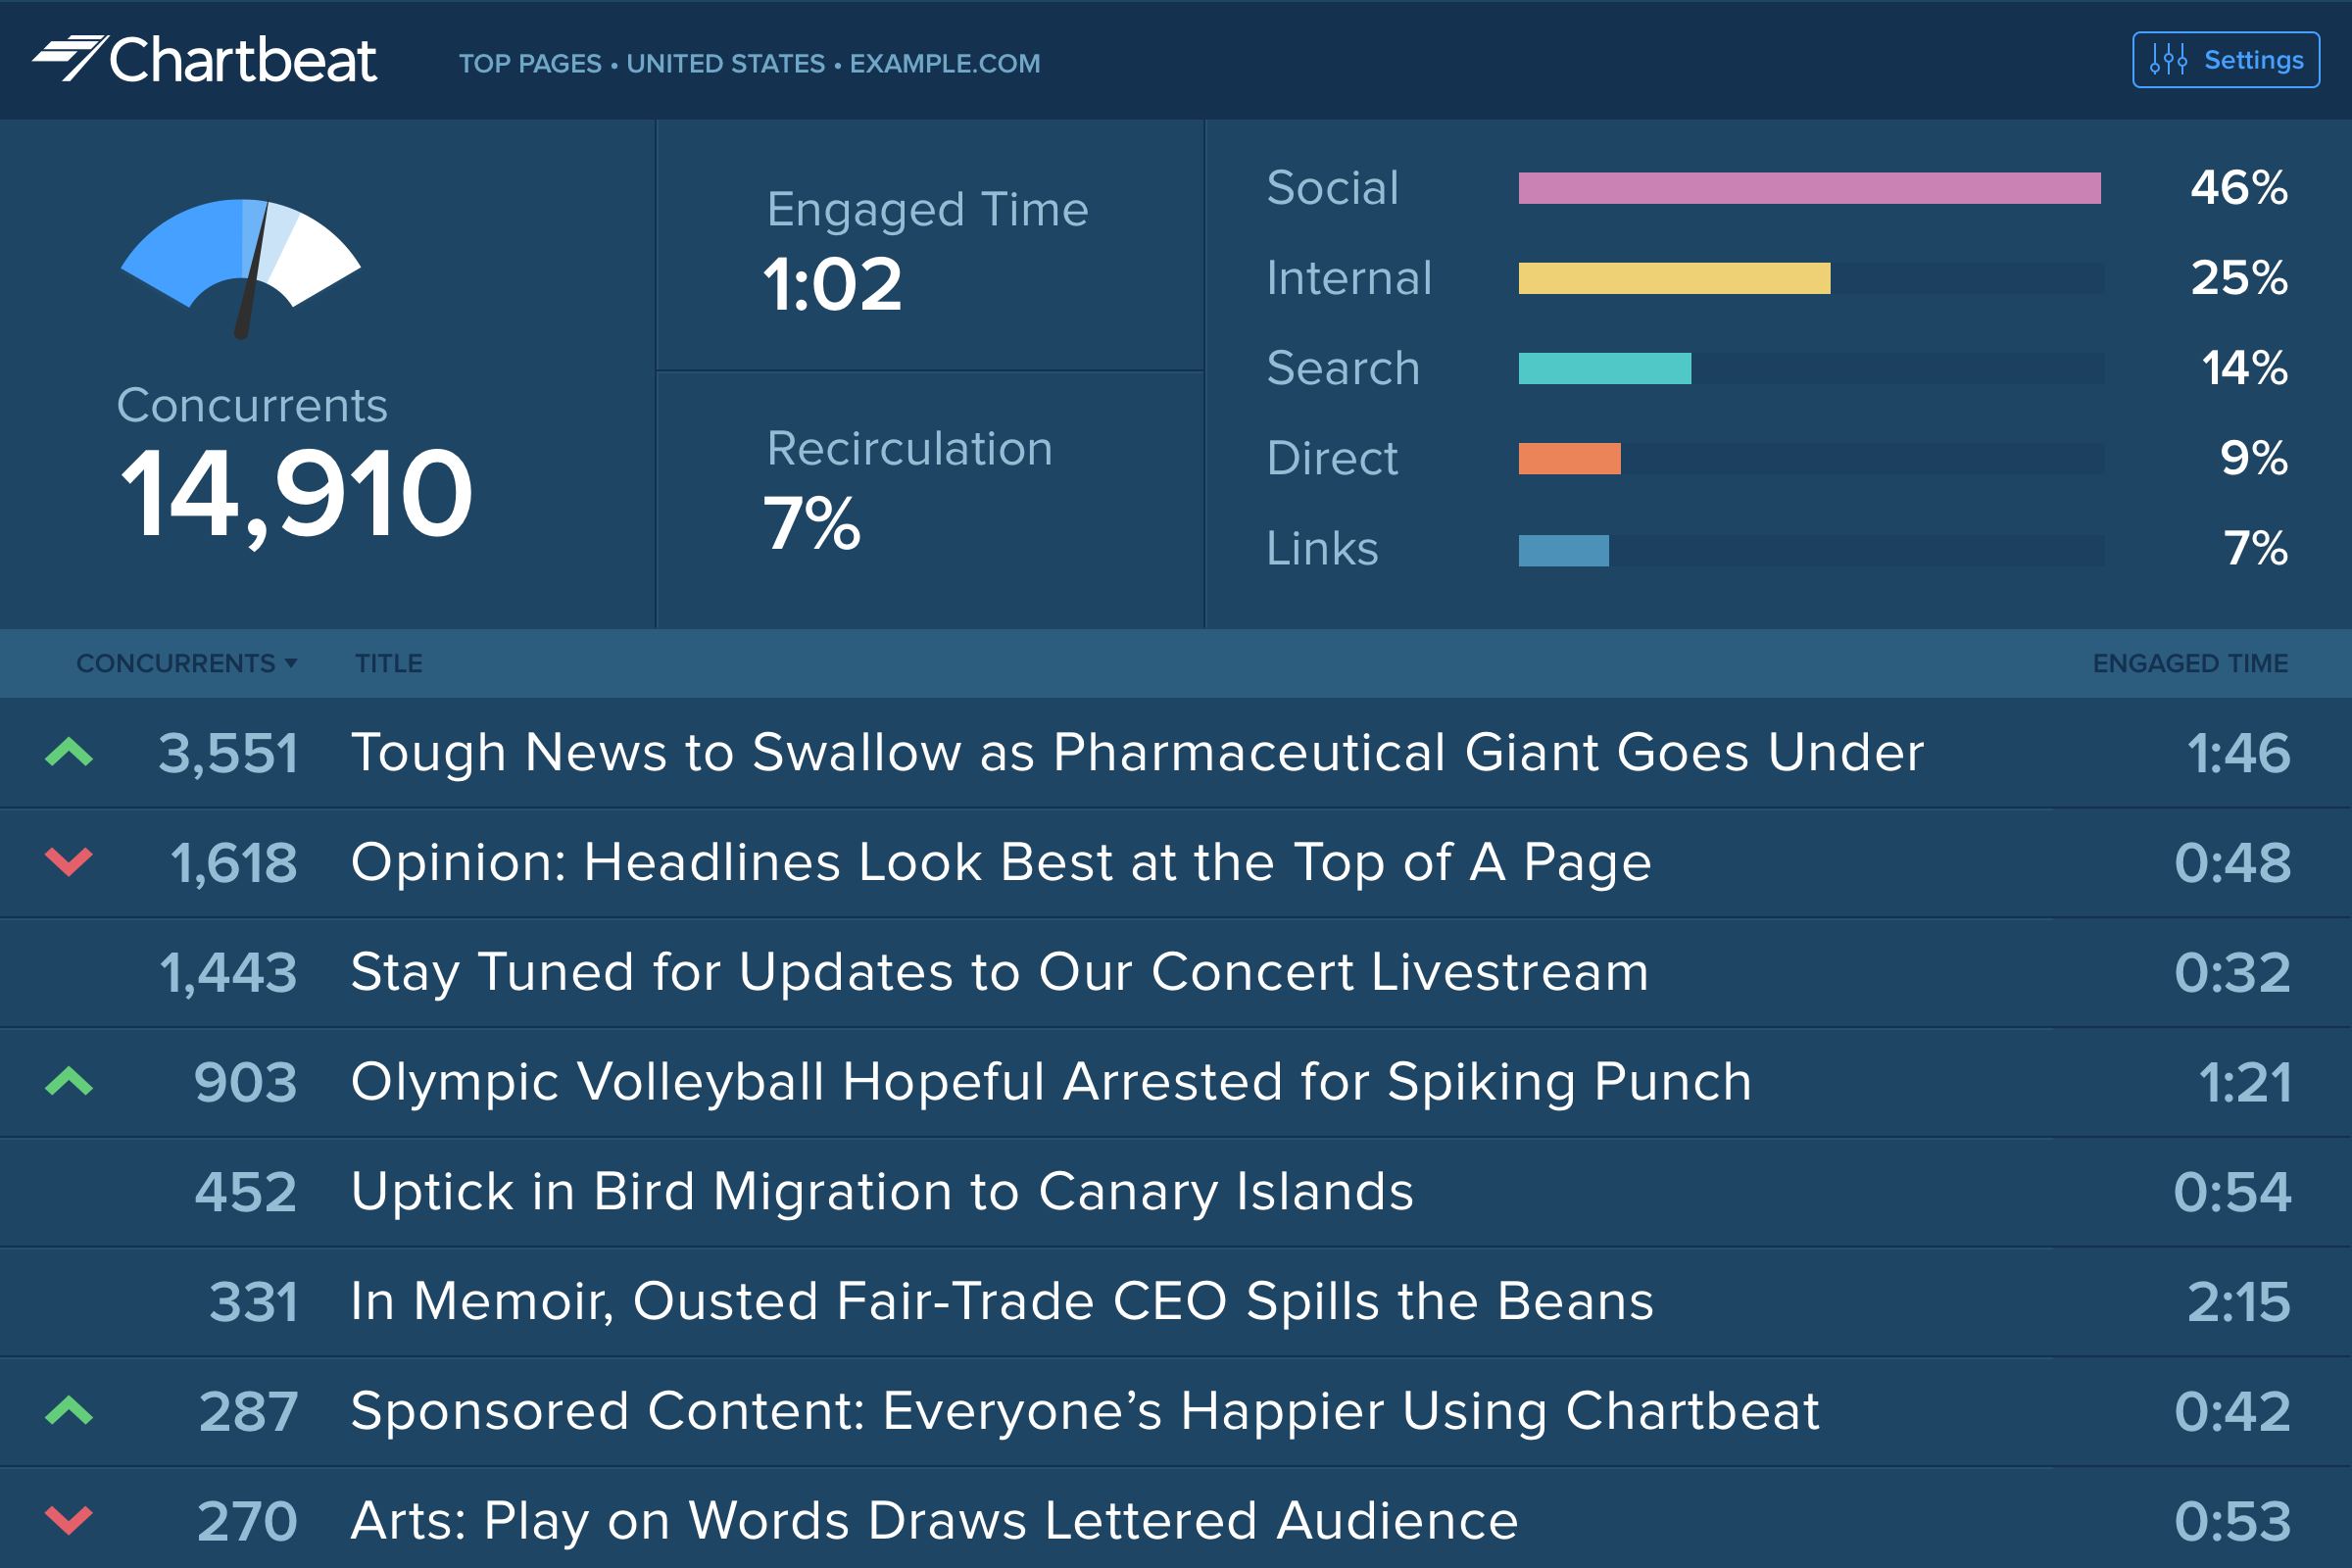
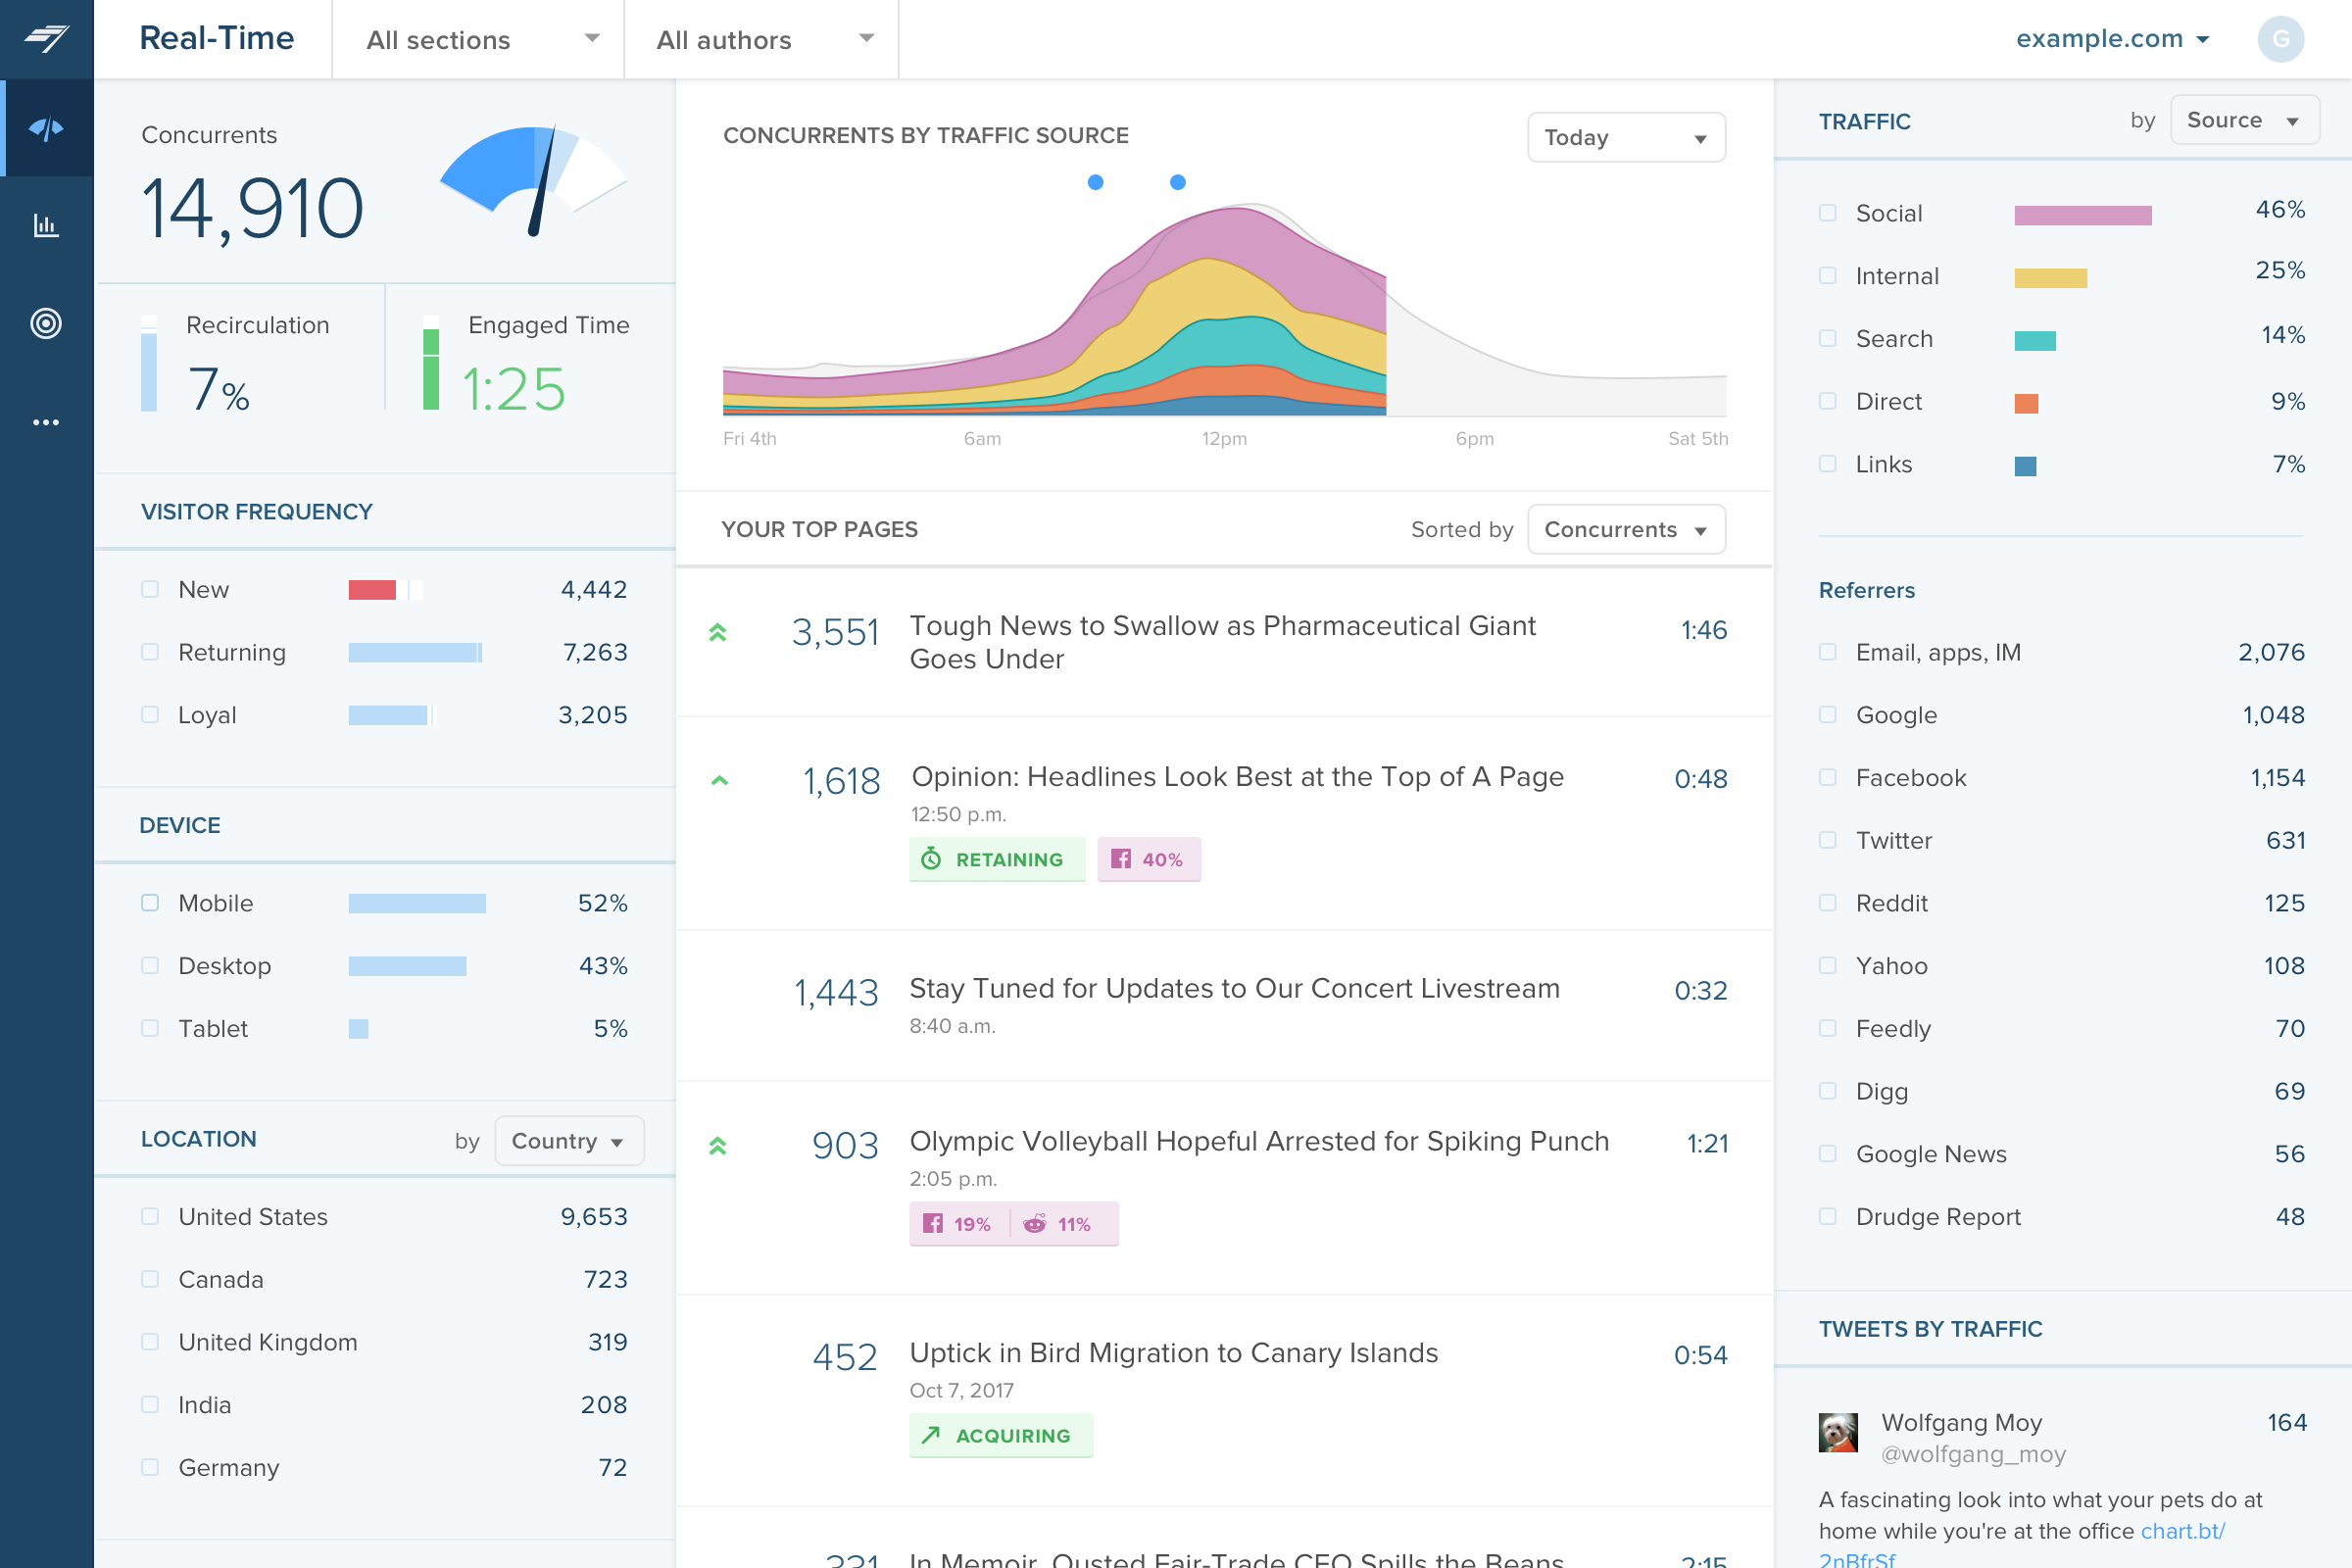
Source of traffic needs improvement. Search and social make sense, but "internal" and "links" is a grey area. It would be helpful to define those with an organization and provide an information icon so users can easily remember what each of those buckets is tracking.
More ways to customize the real-time board. For example, with video content, that's great that I can see a user has started a video, but what is the completion rate, was that only on O&O or can that track Facebook, too?
Would like to see demo (age) information included as a way to slice the data so I can see what's working with my older and younger demo.
I gave Chartbeat a 5 for a renewal rating, because, while it delivers clear and understandable content, Google Analytics also provides many of the same features for free. For a small to medium website, I believe it would be more cost effective to use Google Analytics. A website with a high amount of traffic, however, could merit spending the money on Chartbeat to maximize their potential.
Chartbeat is really pretty straightforward. The only things that may cause confusion are the string of sidebar features and tools at the left of the screen. I mostly use the big leader board in real-time and the historical feature (looking at the monthly or weekly performance of my team's content) and then generate reports automatically from there.
I have had limited experience of support for Chartbeat but whenever I have needed help it has been there. Recently there was an issue of seeing different forms of data in real time - app and otherwise effectively, and the issue was being clearly dealt with and communicated back to us.
Google Analytics has gradually become much more difficult to use, and much slower in its realtime reporting. It was the changes that came in with Google Analytics 4 that gave us the final push to work with Chartbeat - a product some of us were already familiar with from previous jobs. Things are just much harder to find in GA, and when time is always tight you can't afford to spend a long time looking for particular data - it should be quick and easy to locate
WhatUsersDo provides more detailed and opinion based responses. It can take a few hours more than competitors because of this. I would recommend it if you want to know more about the user journey through your website. I would not recommend it if you want quick feedback about a specific feature, image or copy, as there are tools better suited to this.
It has helped us to improve our website copy to see how much users understood about our service and what was memorable about it.
We have changed the information given on certain pages, as we realised users' opinions about our company became more positive after visiting secondary pages. So for example, we moved project examples to the homepage.
We realised that our website did not load properly when using an Internet Explorer browser, so made corrections to this.