Grafana vs. Qlik Sense

Overview
ProductRatingMost Used ByProduct SummaryStarting Price
Grafana
Score 8.7 out of 10
N/A
Grafana is a data visualization tool developed by Grafana Labs in New York. It is available open source, managed (Grafana Cloud), or via an enterprise edition with enhanced features. Grafana has pluggable data source model and comes bundled with support for popular time series databases like Graphite. It also has built-in support for cloud monitoring vendors like Amazon Cloudwatch, Microsoft Azure and SQL databases like MySQL. Grafana can combine data from many places into a single dashboard.
$8
per month up to 1 active user
Qlik Sense
Score 7.4 out of 10
N/A
Qlik Sense® is a self-service BI platform for data discovery and visualization. It supports a full range of analytics use cases—data governance, pixel-perfect reporting, and collaboration. Its Associative Engine indexes and connects relationships between data points for creating actionable insights.
$200
per month
Pricing
GrafanaQlik Sense
Editions & Modules
Grafana Cloud - Pro
$8
per month up to 1 active user
Grafana Cloud - Free
Free
10k metrics + 50GB logs + 50GB traces up to 3 active users
Grafana Cloud - Advanced
Volume Discounts
custom data usage custom active users
Grafana - Enterprise Stack
Custom Pricing
Starter
$200
per month
Standard
$825
per month
Premium
$2,750
per month
Qlik Sense Enterprise on Windows
Contact Sales
Enterprise
Custom Quote
Offerings
Pricing Offerings
GrafanaQlik Sense
Free Trial
YesNo
Free/Freemium Version
YesNo
Premium Consulting/Integration Services
NoNo
Entry-level Setup FeeNo setup feeNo setup fee
Additional Details
More Pricing Information
Community Pulse
GrafanaQlik Sense
Considered Both Products
Grafana
Chose Grafana
Easy to use
Easy to configure
Cost efficient
Chose Grafana
Grafana is more flexible, readily adopts other tools frameworks instead of forcing you to use their agent, doesn't force you into Vendor lock-in, and embraces open source, self-hosted, and Enterprise. Similar companies would like you to use their specific tooling and don't …
Chose Grafana
Grafana gives more flexibility to explore its features. A new user can explore experiment and work with free Grafana account and find if it is suitable for them.Other platforms don't have the features in their freemium version that Grafana has. It lets us try features of …
Chose Grafana
Grafana has a direct plugin to Icinga monitoring solution and allowed for easy configuration for us. At the time of implementation, other services did not have such an integration. As we already had a very customized and heavily introduced monitoring solution in place, we …
Chose Grafana
Grafana blows Nagios out of the water when it comes to customization. The ability to feed almost any data source makes it very versatile and the cost is great.
Qlik Sense
Chose Qlik Sense
We use both Qlik Sense and QlikView. Both bring valué. However, due to simpler development Qlik Sense is the main tool.
Chose Qlik Sense
Qlik Sense cost of licensing is cheaper compared with other tools which always gives an upper edge in analytics industry with good functionality. More enhanced level of security with better user community group available to discuss about new updates. Understanding of Qlik Sense …
Chose Qlik Sense
We use Microsoft Power BI too as a BI tool, in my point of view, Qlik Sense's ETL is much better than PowerBi. In another side, PowerBI learning curve is small than Qlik Sense, especially the PowerBI Desktop.
Chose Qlik Sense
Kibana is data visualization tool in Elastic Stack to visualize and analyze Real Time Logs Capture.
It captures Live Streaming data and helps to detect any anomalies, error and bugs, monitoring aspects of any service/ IOT Device.
Chose Qlik Sense
The customization of the platform opens up plenty of other options depending on the use cases. The API layer is incredibly rich and makes integration of Qlik based visualization into web pages a simple and effective pattern. It's been very easy to use with a great community …
Chose Qlik Sense
Both are good data visualisation platforms; with certain applications where one is better than the other
Chose Qlik Sense
Qlik Sense offers a broad variety of functions that are not easily achievable using PowerBi. However, I was not involved with the selection.
Chose Qlik Sense
Qlik Sense is a fast tool to implement; you can have a functional dashboard in a few days, and the ETL processes are quite easy to build it. You can have the ROI in a short period of time.
Chose Qlik Sense
Qlik Sense comes out as a superior product as well as more cost efficient than some of the other products we evaluated as a part of our Enterprise Business Intelligence stack. It offers unified view of our data and extensibility. Qlik Sense being the most interactive …
Chose Qlik Sense
Qlik Sense is relatively cheaper and more futuristic
Chose Qlik Sense
Qlik Sense is one of the best reporting systems. It is stronger than PBI and Tableau when speaking about complex KPIs. It is really similar to Microstrategy Analytics when you speak about obtained results, but it is easier to use, especially as it is more code-based. But is it …
Chose Qlik Sense
Qlik Sense can easily integrate multiple data models to visualize customer data. Tableau is easy to use—perhaps more manageable than Qlik—but expensive. Microsoft BI was chosen because it was similar to previously used
Chose Qlik Sense
We originally went with Qlik Sense because the desktop version used to be free for single users and was a very good proposition for us (we are a non-profit with a limited budget). However, from what I see, the functionality is comparable, and Qlik Sense stacks up well.
Chose Qlik Sense
As soon as you want to pull data from two or more separate tables, Qlik Sense leaves the rest in the dust, since it does not require joins or complex transformations. Zoho CRM analytics are limited to the data located in the product itself. No external tables can be combined.
Chose Qlik Sense
Other tools were not able to handle complex business requirements and performance was not too good with very huge volume data. we were required to maintain history, time-based data backups, and snapshots. Also, some of the tools were too costly compare to Qlik [Sense] solutions.
Chose Qlik Sense
We had a QlikView deployment and it made sense to utilize what was existing for our Qlik Sense use.
Chose Qlik Sense
When it comes to working with large datasets out of the box, Qlik in my opinion is unrivaled amongst the competitor. However, the overall user experience and customization options available to developers require a lot of work. When compared to other options on the market, …
Chose Qlik Sense
We thought we were getting a good (financial) deal. We had internal resources who were already familiar with Qlik.
Chose Qlik Sense
BI has some amazing features, but it requires a good understanding of DAX. It's not as user-friendly as Qlik Sense.
Features
GrafanaQlik Sense
BI Standard Reporting
Comparison of BI Standard Reporting features of Product A and Product B
Grafana
8.0
Ratings
5% below category average
Qlik Sense
8.5
Ratings
4% above category average
Pixel Perfect reports6.00 Ratings8.30 Ratings
Customizable dashboards10.00 Ratings8.90 Ratings
Report Formatting Templates8.00 Ratings8.20 Ratings
Ad-hoc Reporting
Comparison of Ad-hoc Reporting features of Product A and Product B
Grafana
6.8
Ratings
16% below category average
Qlik Sense
8.6
Ratings
7% above category average
Drill-down analysis6.00 Ratings8.90 Ratings
Formatting capabilities8.00 Ratings8.20 Ratings
Integration with R or other statistical packages5.10 Ratings8.40 Ratings
Report sharing and collaboration8.00 Ratings9.00 Ratings
Report Output and Scheduling
Comparison of Report Output and Scheduling features of Product A and Product B
Grafana
8.4
Ratings
0% below category average
Qlik Sense
8.8
Ratings
6% above category average
Publish to Web7.00 Ratings8.80 Ratings
Publish to PDF9.00 Ratings8.80 Ratings
Report Versioning9.00 Ratings8.80 Ratings
Report Delivery Scheduling8.00 Ratings8.80 Ratings
Delivery to Remote Servers9.00 Ratings8.80 Ratings
Data Discovery and Visualization
Comparison of Data Discovery and Visualization features of Product A and Product B
Grafana
7.7
Ratings
6% below category average
Qlik Sense
8.7
Ratings
9% above category average
Pre-built visualization formats (heatmaps, scatter plots etc.)9.00 Ratings8.50 Ratings
Location Analytics / Geographic Visualization9.00 Ratings8.80 Ratings
Predictive Analytics7.00 Ratings8.70 Ratings
Pattern Recognition and Data Mining6.00 Ratings00 Ratings
Access Control and Security
Comparison of Access Control and Security features of Product A and Product B
Grafana
-
Ratings
Qlik Sense
9.0
Ratings
6% above category average
Multi-User Support (named login)00 Ratings9.20 Ratings
Role-Based Security Model00 Ratings9.00 Ratings
Multiple Access Permission Levels (Create, Read, Delete)00 Ratings8.80 Ratings
Single Sign-On (SSO)00 Ratings8.90 Ratings
Mobile Capabilities
Comparison of Mobile Capabilities features of Product A and Product B
Grafana
-
Ratings
Qlik Sense
7.4
Ratings
6% below category average
Responsive Design for Web Access00 Ratings8.30 Ratings
Mobile Application00 Ratings8.20 Ratings
Dashboard / Report / Visualization Interactivity on Mobile00 Ratings8.20 Ratings
Application Program Interfaces (APIs) / Embedding
Comparison of Application Program Interfaces (APIs) / Embedding features of Product A and Product B
Grafana
-
Ratings
Qlik Sense
8.6
Ratings
10% above category average
REST API00 Ratings8.80 Ratings
Javascript API00 Ratings8.40 Ratings
iFrames00 Ratings8.50 Ratings
Java API00 Ratings8.60 Ratings
Themeable User Interface (UI)00 Ratings8.60 Ratings
Customizable Platform (Open Source)00 Ratings8.40 Ratings
Best Alternatives
GrafanaQlik Sense
Small Businesses
Supermetrics
Supermetrics
Score 10.0 out of 10
BrightGauge
BrightGauge
Score 9.1 out of 10
Medium-sized Companies
Supermetrics
Supermetrics
Score 10.0 out of 10
Reveal
Reveal
Score 10.0 out of 10
Enterprises
Dataiku
Dataiku
Score 7.6 out of 10
Kyvos Semantic Intelligence Layer
Score 9.9 out of 10
All AlternativesView all alternativesView all alternatives
User Ratings
GrafanaQlik Sense
Likelihood to Recommend
9.0
(0 ratings)
8.5
(0 ratings)
Likelihood to Renew
-
(0 ratings)
8.4
(0 ratings)
Usability
10.0
(0 ratings)
8.0
(0 ratings)
Support Rating
-
(0 ratings)
7.3
(0 ratings)
In-Person Training
-
(0 ratings)
9.1
(0 ratings)
Online Training
-
(0 ratings)
9.1
(0 ratings)
Implementation Rating
-
(0 ratings)
7.3
(0 ratings)
Vendor post-sale
-
(0 ratings)
9.1
(0 ratings)
Vendor pre-sale
-
(0 ratings)
9.1
(0 ratings)
User Testimonials
GrafanaQlik Sense
Likelihood to Recommend
Just about any organization with more than one server and more than one cluster as it scales very well. Configuration of the application takes time and finesse to fine tune to where the balance of load time and getting data quickly meets. The plugins add load time but fine tuning for the application to meet demand needs nailed down at implementation
Read full review
Qlik Sense is a program whose purpose is to greatly improve all your operations and use of all data in an organic way. The mission will always be to increase the economic and commercial processes of the company in a short time. I recommended it for its high technology, which was Created for this area, the results are successful. We have noticed how it has increased relationships with our clients thanks to the credibility and security that we provide.
Read full review
Pros
  • Alerting through many different medium as Slack, Email, Webhook etc
  • Beautiful and unlimited number of dashboards to view your metrics and tweak them as you please
  • Log aggregation and powerful Logql to filter and view your logs
  • Microservices monitoring
  • Large number of plugins and data sources to collect your metrics from almost anywhere
Read full review
  • Self-Service Visualization and Discovery
  • Fullstack BI from ETL to Visualization, its built-in ETL engine can transform disparate data sets into a common data structure
  • Uses HTML5 based responsive design which visualization automatically adapt to the screen size and orientation of the users device
  • Actively engaged community and resources to help you learn this software in the best possible manner
Read full review
Cons
  • Documentation needs to be more clarified since it can be confusing for beginners
  • Notification alert message templates need to be simplified
Read full review
  • Not a lot of room for customization as we were used to in QlikView
  • UI and default navigation can be very clunky and not user friendly
  • Although the backend is fantastic, the front end experience leaves a lot to be desired. As a developer you don't have a lot of options to customized your app unless you turn to Javascript, CSS and HTML. This is not a common stack you would find in most BI developers
Read full review
Likelihood to Renew
No answers on this topic
Qlik Sense is a constantly improving it's software and working with its' users to make it better. They are great at keeping their users informed of progress and care about delivering a quality product
Read full review
Usability
Great usage in terms of monitoring of any application from backend to frontend and even any AWS resource via cloud watch and other connectors. Easy to use and configure personalised dash boarding and alerting features. Cost efficient and easy to setup and run, no mazor scaling challenges in terms of managing and maintaining the stack, easy to configure via Prometheus, influx and other connectors
Read full review
Qlik Sense has a better and easy to learn user interface compared with other analytics tool which always help us to create regular and adhoc reports within the stipulated time frame and can be easily refreshed at a scheduled time and sent to multiple stakeholders for timely update regarding the Key metrics indicator.
Read full review
Support Rating
No answers on this topic
Not only can you ask the support team for help, but you can also ask the community. Also with the community there is a vast amount of problems that have already been solved. The problem you are encountering has a likely chance of already being discussed and even solved in the community section saving you time from reaching out.
Read full review
In-Person Training
No answers on this topic
The instructor was very knowledgeable.
Read full review
Online Training
No answers on this topic
The online instructor was very knowledgeable.
Read full review
Implementation Rating
No answers on this topic
Hire Qlik consultants. It's better done by them or with their aid.
Read full review
Alternatives Considered
Grafana is more flexible, readily adopts other tools frameworks instead of forcing you to use their agent, doesn't force you into Vendor lock-in, and embraces open source, self-hosted, and Enterprise. Similar companies would like you to use their specific tooling and don't offer nearly as much flexibility. The other thing I like about Grafana is their storage usage is much lower compared to similar tools and competitors
Read full review
The customization of the platform opens up plenty of other options depending on the use cases. The API layer is incredibly rich and makes integration of Qlik based visualization into web pages a simple and effective pattern. It's been very easy to use with a great community made up of professionals. Qlik Sense has introduces artificial Intelligence into my data visualization and reporting activity.
Read full review
Return on Investment
  • It has kicked out some of our paid monitoring and visualization tools.
  • Now Monitoring, Visualization and Alerting is being done in a single platform.
  • It made monitoring and visualization very easy for us.
Read full review
  • The impact has undoubtedly been positive, it is difficult to quantify it, however in terms of effectiveness or efficiency I give it a 90%.
  • I don't give it 100% because to use the complete package you have to pay, and it's not that cheap and on the other hand because it has some deficiencies, such as technical support and some issues like windows that are not so friendly and easy to work with.
  • Still, I can't stop using it.
Read full review
ScreenShots

Qlik Sense Screenshots

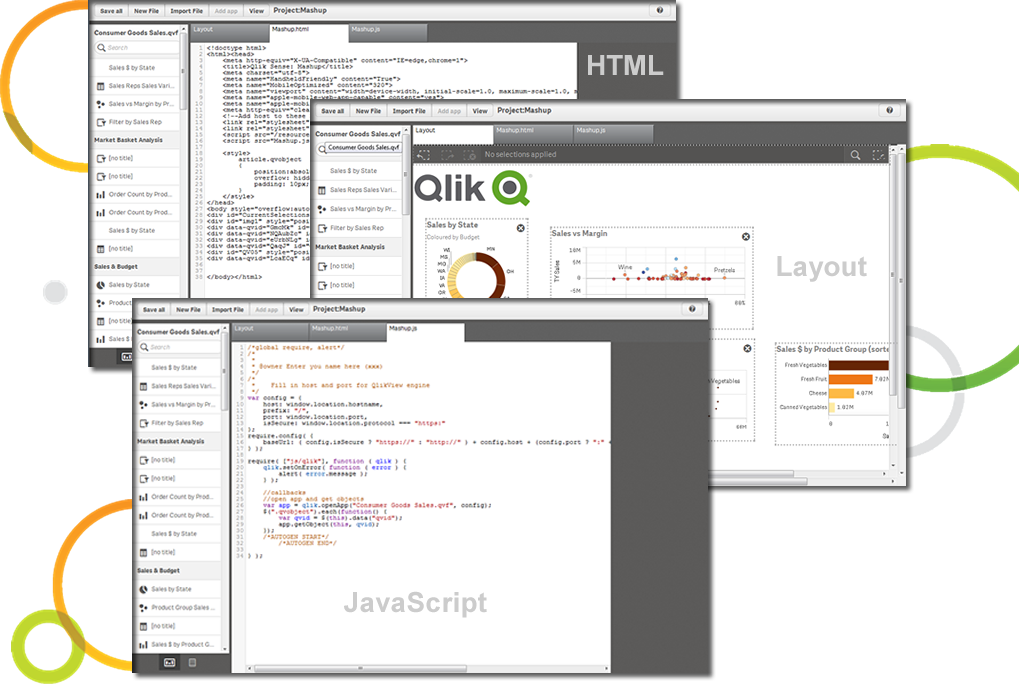
Screenshot of Qlik Sense Cash Flow DashboardScreenshot of Qlik Sense Global Smart SearchScreenshot of Qlik Sense Smart Data Compression - Get immediate insight on large dataScreenshot of Extend, mix and mash-up with our APIsScreenshot of Add "External data" with Qlik DataMarket - Data as a ServiceScreenshot of Visualization Bundle