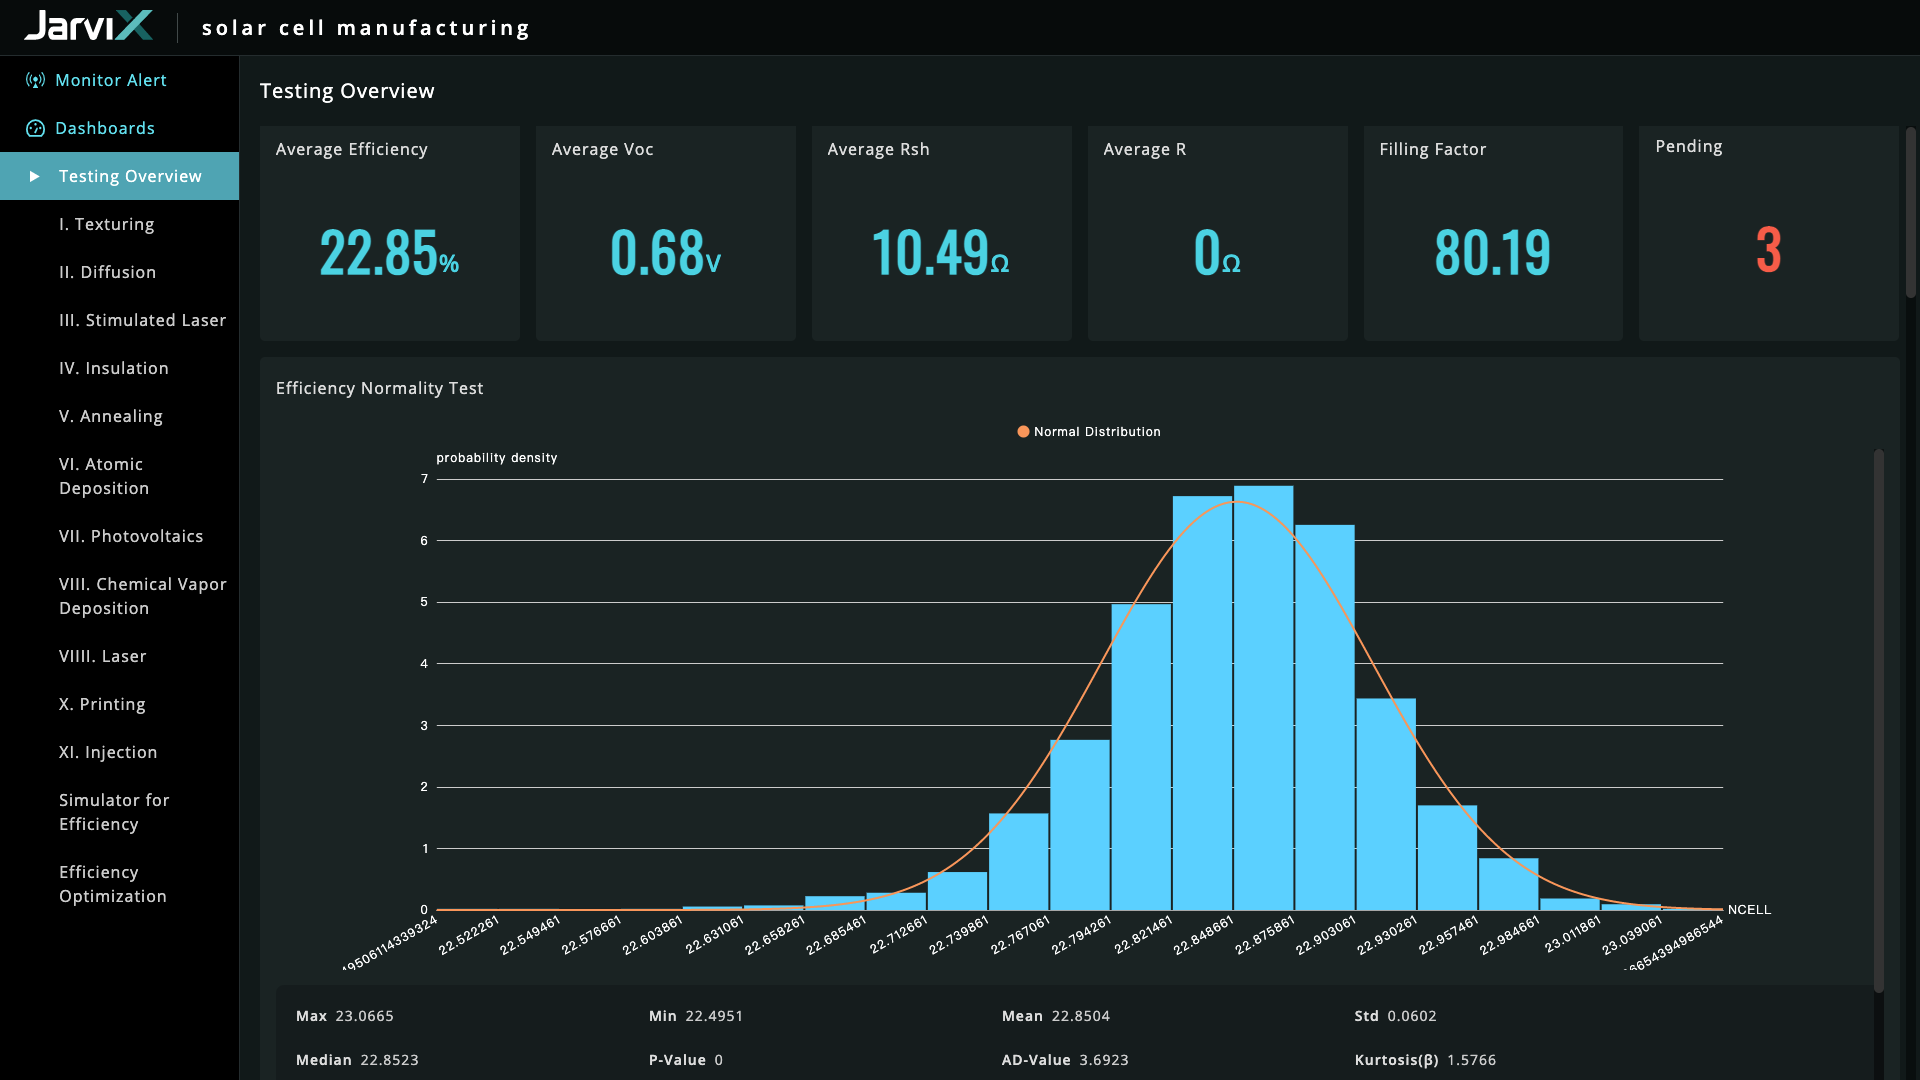
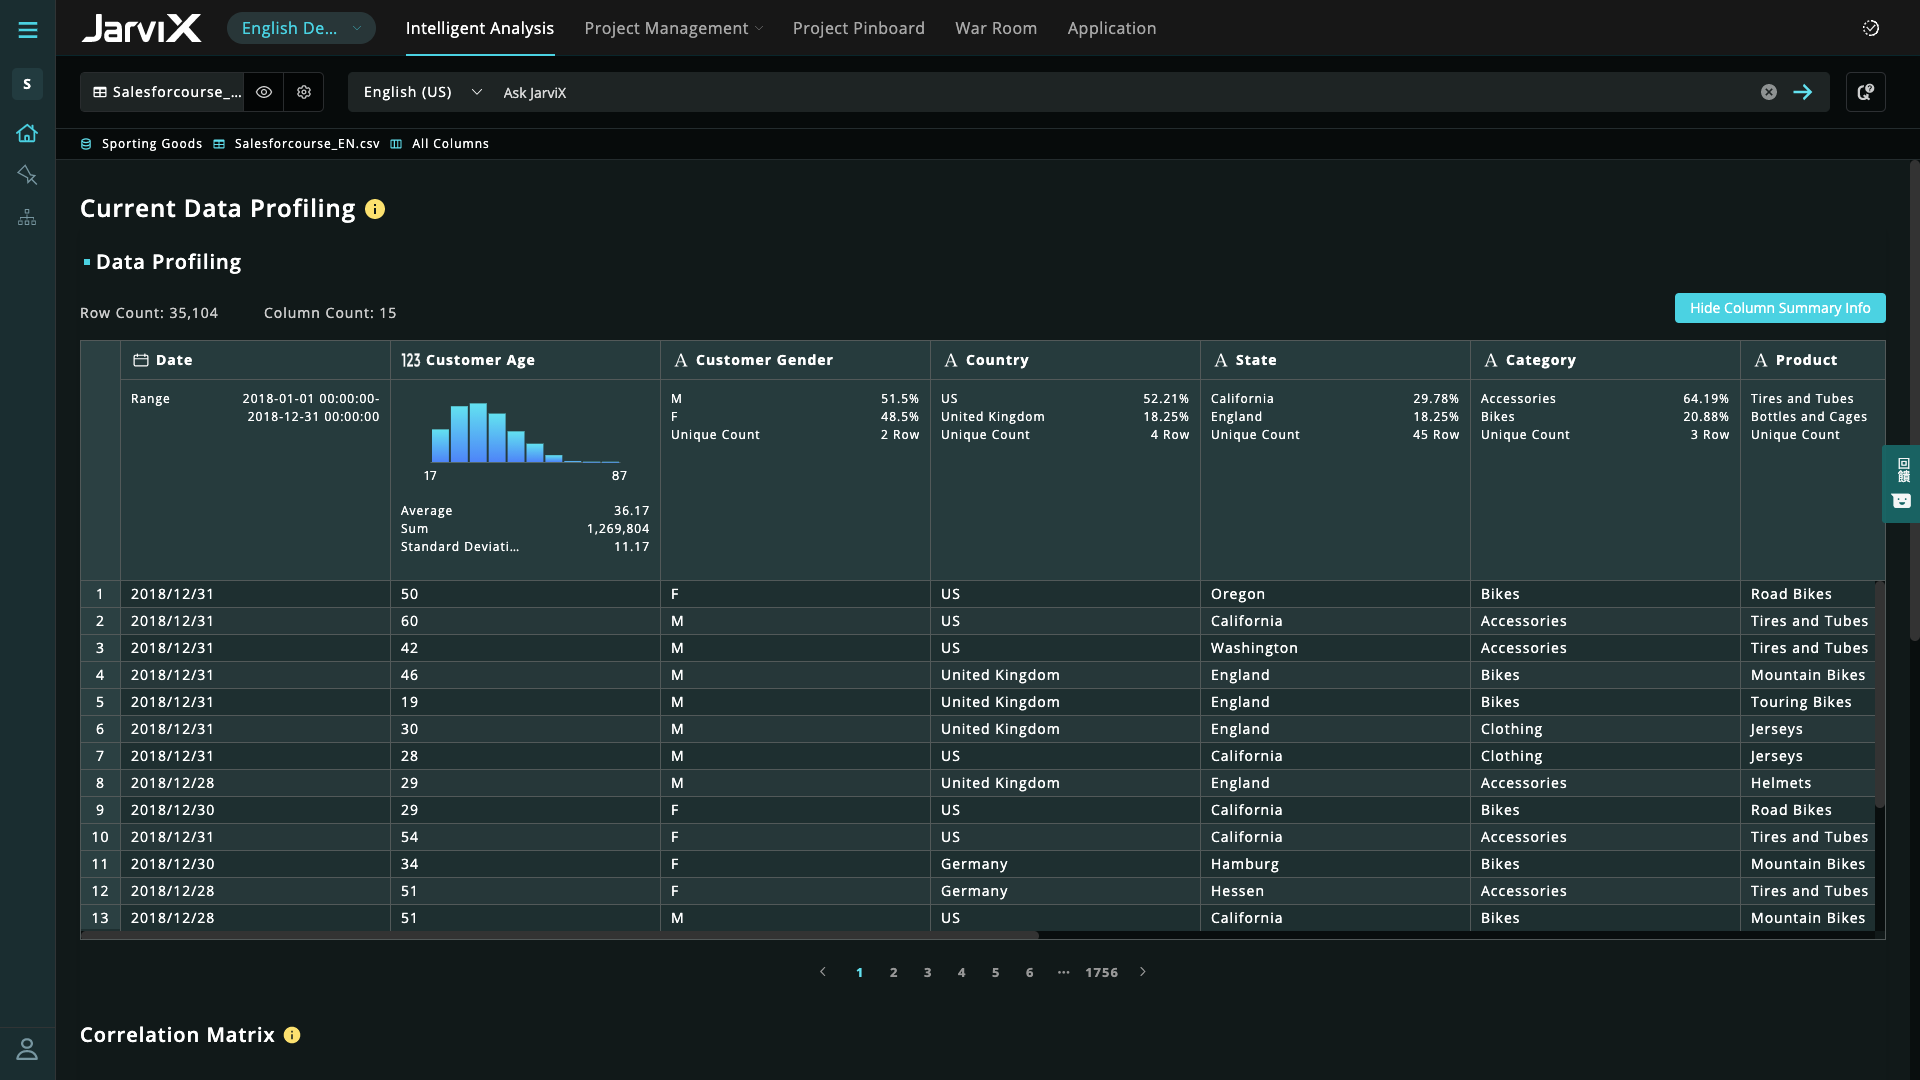
Synergies is a cognitive application service provider that combines business knowledge, artificial intelligence technology, and software development. Their mission is to help businesses through their digital transformation journey, become leaders and innovators in their industries by unlocking the power of data in the hands of business users and decision makers. Their product, JarviX, is an AnalyticOps Platform . JarviX uses NLP…
N/A
Qlik Sense
Score 7.4 out of 10
N/A
Qlik Sense® is a self-service BI platform for data discovery and visualization. It supports a full range of analytics use cases—data governance, pixel-perfect reporting, and collaboration. Its Associative Engine indexes and connects relationships between data points for creating actionable insights.
$200
per month
Pricing
JarviX
Qlik Sense
Editions & Modules
No answers on this topic
Starter
$200
per month
Standard
$825
per month
Premium
$2,750
per month
Qlik Sense Enterprise on Windows
Contact Sales
Enterprise
Custom Quote
Offerings
Pricing Offerings
JarviX
Qlik Sense
Free Trial
No
No
Free/Freemium Version
No
No
Premium Consulting/Integration Services
No
No
Entry-level Setup Fee
No setup fee
No setup fee
Additional Details
—
—
More Pricing Information
Community Pulse
JarviX
Qlik Sense
Features
JarviX
Qlik Sense
BI Standard Reporting
Comparison of BI Standard Reporting features of Product A and Product B
JarviX
7.6
Ratings
7% below category average
Qlik Sense
8.5
Ratings
4% above category average
Pixel Perfect reports
8.20 Ratings
8.30 Ratings
Customizable dashboards
7.30 Ratings
8.90 Ratings
Report Formatting Templates
7.30 Ratings
8.20 Ratings
Ad-hoc Reporting
Comparison of Ad-hoc Reporting features of Product A and Product B
JarviX
7.8
Ratings
3% below category average
Qlik Sense
8.6
Ratings
7% above category average
Drill-down analysis
7.10 Ratings
8.90 Ratings
Formatting capabilities
7.30 Ratings
8.20 Ratings
Integration with R or other statistical packages
9.10 Ratings
8.40 Ratings
Report sharing and collaboration
7.70 Ratings
9.00 Ratings
Report Output and Scheduling
Comparison of Report Output and Scheduling features of Product A and Product B
JarviX
7.8
Ratings
6% below category average
Qlik Sense
8.8
Ratings
6% above category average
Publish to Web
9.10 Ratings
8.80 Ratings
Publish to PDF
7.30 Ratings
8.80 Ratings
Report Versioning
6.40 Ratings
8.80 Ratings
Report Delivery Scheduling
8.20 Ratings
8.80 Ratings
Delivery to Remote Servers
8.20 Ratings
8.80 Ratings
Data Discovery and Visualization
Comparison of Data Discovery and Visualization features of Product A and Product B
For users with little data analytics knowledge, JarviX is the perfect tool to get started where there are fewer resources to build a data team but requires data to improve and innovate.
Qlik Sense is a program whose purpose is to greatly improve all your operations and use of all data in an organic way. The mission will always be to increase the economic and commercial processes of the company in a short time. I recommended it for its high technology, which was Created for this area, the results are successful. We have noticed how it has increased relationships with our clients thanks to the credibility and security that we provide.
There should be more flexibility in changing the data tables uploaded into JarviX. For example, it should enable users to edit the syntax of the table or change the data format of the columns without affecting the existing dashboard and charts already created using that data table.
Not a lot of room for customization as we were used to in QlikView
UI and default navigation can be very clunky and not user friendly
Although the backend is fantastic, the front end experience leaves a lot to be desired. As a developer you don't have a lot of options to customized your app unless you turn to Javascript, CSS and HTML. This is not a common stack you would find in most BI developers
Qlik Sense is a constantly improving it's software and working with its' users to make it better. They are great at keeping their users informed of progress and care about delivering a quality product
Qlik Sense has a better and easy to learn user interface compared with other analytics tool which always help us to create regular and adhoc reports within the stipulated time frame and can be easily refreshed at a scheduled time and sent to multiple stakeholders for timely update regarding the Key metrics indicator.
Not only can you ask the support team for help, but you can also ask the community. Also with the community there is a vast amount of problems that have already been solved. The problem you are encountering has a likely chance of already being discussed and even solved in the community section saving you time from reaching out.
In comparison to JarviX, Power BI offers a lot of customization for reporting purposes. However, JarviX has the advantage of saving time and built-in algorithmic analyses that integrate data visualization. JarviX’s also has a huge advantage in its natural language query function, which is very intuitive and sets a low barrier for entry-level users across our organization.
The customization of the platform opens up plenty of other options depending on the use cases. The API layer is incredibly rich and makes integration of Qlik based visualization into web pages a simple and effective pattern. It's been very easy to use with a great community made up of professionals. Qlik Sense has introduces artificial Intelligence into my data visualization and reporting activity.
I think the best part of JarviX is that we can get the analysis results in several minutes. We spent lots of time making reports and managing our data in the past. All in all, it helps us save the time, cost, and labor of managing data.
The impact has undoubtedly been positive, it is difficult to quantify it, however in terms of effectiveness or efficiency I give it a 90%.
I don't give it 100% because to use the complete package you have to pay, and it's not that cheap and on the other hand because it has some deficiencies, such as technical support and some issues like windows that are not so friendly and easy to work with.