Microsoft Power BI is a visualization and data discovery tool from Microsoft. It allows users to convert data into visuals and graphics, visually explore and analyze data, collaborate on interactive dashboards and reports, and scale across their organization with built-in governance and security.
N/A
SAP Crystal
Score 7.5 out of 10
N/A
SAP Crystal is an analytics and reporting software solution for SMBs. SAP Crystal comprises Crystal Reports for pixel-perfect reporting, and SAP Crystal Server for automated distribution and self-service access to reports, dashboards and data exploration.
$295
per single user license
Pricing
Microsoft Power BI
SAP Crystal
Editions & Modules
No answers on this topic
Upgrade Version to SAP Crystal Reports 2020
$295
per single user license
SAP Crystal Reports 2020 64-Bit
$495
per single user license
SAP Crystal Reports 2016 32-Bit
$495
per single user license
SAP Crystal Server 2020 1 NUL
$869
per user license + first year maintenance to be added
SAP Crystal Server 2020 5 CAL
$8,744
5 concurrent users + first year maintenance to be added
Offerings
Pricing Offerings
Microsoft Power BI
SAP Crystal
Free Trial
Yes
Yes
Free/Freemium Version
Yes
Yes
Premium Consulting/Integration Services
No
No
Entry-level Setup Fee
No setup fee
Optional
Additional Details
—
* SAP Crystal Reports 2020 Viewer allows you to view static data within a SAP Crystal Reports file.
* SAP Crystal Reports 2020 - Full version allows you to create powerful, richly formatted, and dynamic reports from virtually any data source, delivered in dozens of formats, in up to 28 languages. If you already have an older version of Crystal Reports, buy a license for SAP Crystal Reports 2020 - Upgrade at a discounted, upgrade price.
* SAP Crystal Server 2020, 1 NUL includes 1 license of: SAP Crystal Reports 2020 - SAP Crystal Server 2020.
* As an add-on to SAP Crystal Server 2020 1 NUL, SAP Crystal Server 2020 5 CAL allows you to support a wider, intermittent audience of end users, up to five logged on at the same time.
More Pricing Information
Community Pulse
Microsoft Power BI
SAP Crystal
Features
Microsoft Power BI
SAP Crystal
BI Standard Reporting
Comparison of BI Standard Reporting features of Product A and Product B
Microsoft Power BI
8.8
Ratings
8% above category average
SAP Crystal
9.3
Ratings
13% above category average
Pixel Perfect reports
8.50 Ratings
8.00 Ratings
Customizable dashboards
10.00 Ratings
10.00 Ratings
Report Formatting Templates
8.00 Ratings
10.00 Ratings
Ad-hoc Reporting
Comparison of Ad-hoc Reporting features of Product A and Product B
Microsoft Power BI
8.2
Ratings
2% above category average
SAP Crystal
9.6
Ratings
18% above category average
Drill-down analysis
7.00 Ratings
10.00 Ratings
Formatting capabilities
9.00 Ratings
10.00 Ratings
Integration with R or other statistical packages
8.00 Ratings
8.60 Ratings
Report sharing and collaboration
9.00 Ratings
10.00 Ratings
Report Output and Scheduling
Comparison of Report Output and Scheduling features of Product A and Product B
Microsoft Power BI
8.6
Ratings
4% above category average
SAP Crystal
9.4
Ratings
12% above category average
Publish to Web
8.00 Ratings
9.20 Ratings
Publish to PDF
9.00 Ratings
10.00 Ratings
Report Versioning
9.00 Ratings
9.00 Ratings
Report Delivery Scheduling
8.00 Ratings
9.00 Ratings
Delivery to Remote Servers
9.00 Ratings
10.00 Ratings
Data Discovery and Visualization
Comparison of Data Discovery and Visualization features of Product A and Product B
Microsoft Power BI is great for sales tracking, financial reporting, and real-time operations monitoring. It integrates data from multiple sources, creating interactive dashboards for better decision-making. However, it's less ideal for real-time big data processing, offline access, or when deep customization is needed. It works best for structured reporting but struggles with highly complex data models.
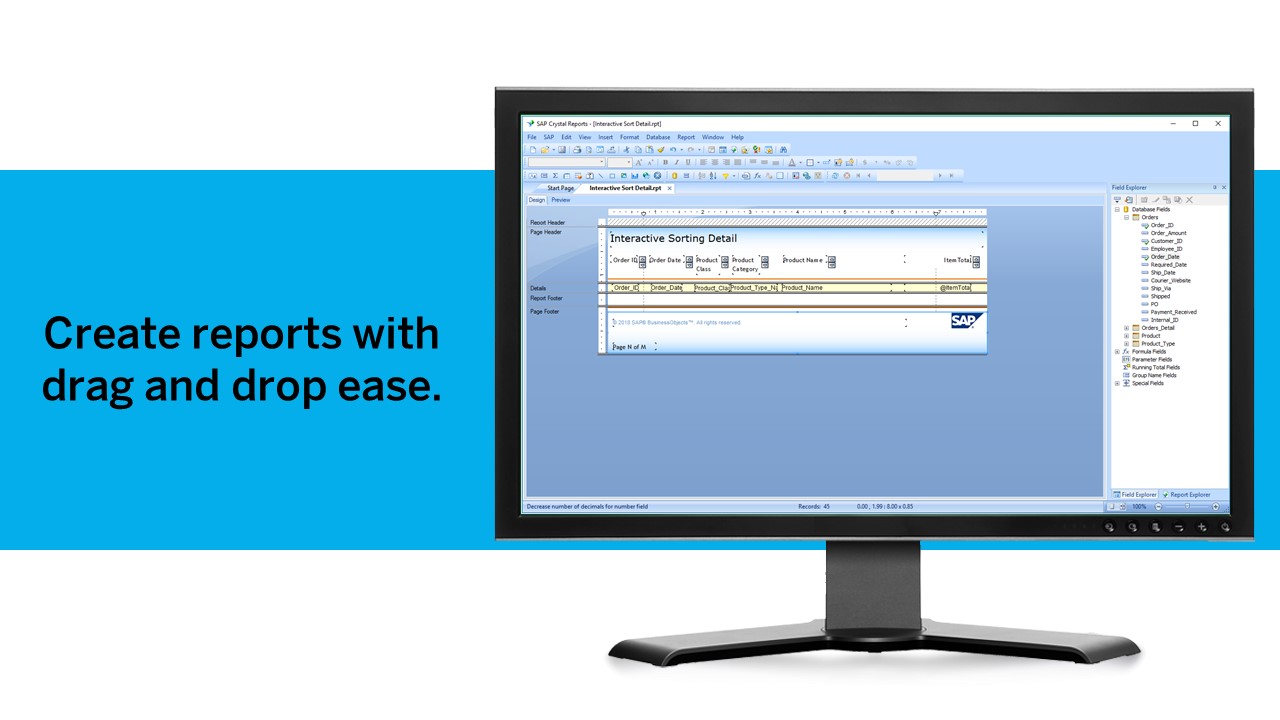
Generation of templated reports is the strong suit of SAP Crystal. Allows users to change formats in templates bases on requirement with minimal effort. Automated report delivery requires the user to be aware of sql which cannot be expected from all users. Should support more document export formats and improve the UI for SAP B1 Users
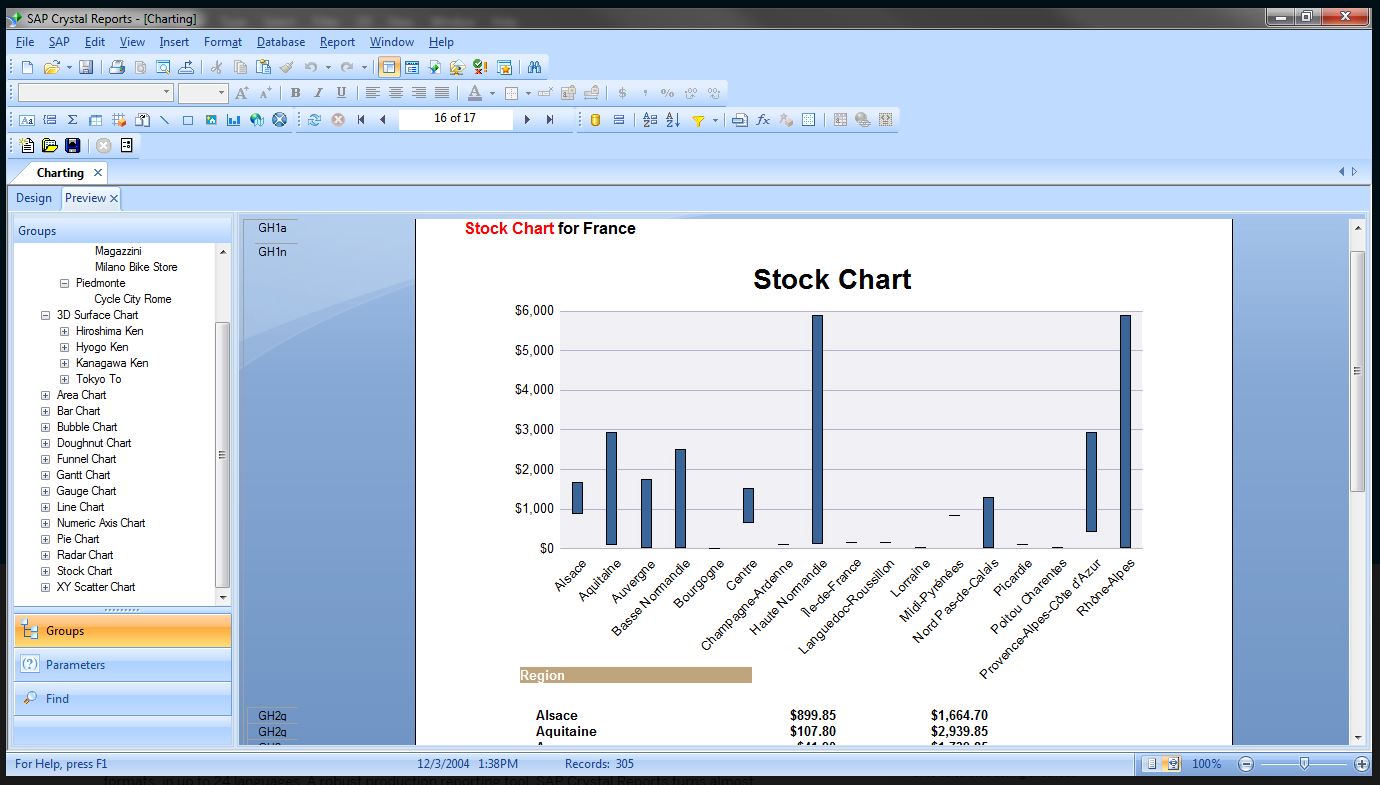
Great visualization for static format & precise tasks: For presentation to senior management /ex-co/vendors where concise decisions need to be made, Crystal is a nice choice to slide data into presentable views.
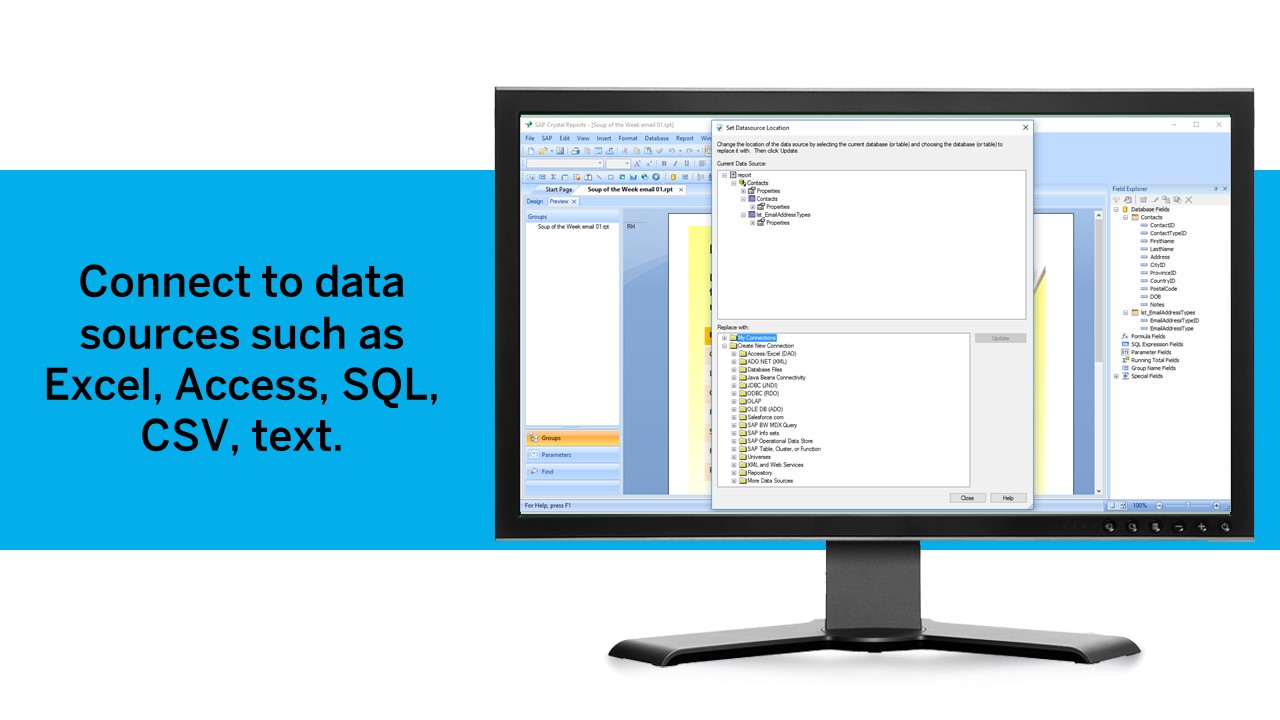
Diverse data source connect: We have used it to write reports using data from DB2, SQL, Progress, Excel spreadsheets, XML data, Access, and Lotus Notes databases. It can also be used to join different database types together in one report.
It uses the "recurring bands" structure for page layout which is efficient and fungible for generating different types of reports. Crystal doesn't require that we set up a metadata layer before creating reports and provides direct access to tables and dimensions.
Microsoft Power BI is an excellent and scalable tool. It has a learning curve, but once you get past that, the sky is the limit and you can build from the most simple to the most complex dashboards. I have built everything from simple reports with only a few data points to complex reports with many pages and advanced filtering.
We have been using this product for so many years and it has truly become a cornerstone to our business processes when it comes to developing and distributing information via reports. We currently have over 500 reports developed to date over about 30 systems and that will continue to grow as user needs change.
Takes a little bit to get used to it. Not natively intuitive but fairly straight forward to pick up. Also docking it a few points because you can create a really clean, simple UI in Claude very quickly that's faster than building all of this yourself in Microsoft Power BI.
Being able to get up and running quickly is a key asset. There's plenty of advanced features to master that are surprisingly difficult in others tools (or just missing from other tools altogether). The UI can feel a bit dated at times but its usability isn't affected. Any issue you have can usually be resolved by searching in the user community
It is a fantastic tool, you can do almost everything related with data and reports, it is a perfect substitutive of Power Point and Excel with a high evolution and flexibility, and also it is very friendly and easy to share. I think all companies should have Power BI (or other BI tool) in their software package and if they are in the MS Suite, for sure Power BI should be the one due to all the benefits of the MS ecosystem.
SAP Crystal report is very supportive in daily need of reports or any organization. Basic functionality of operational reports detailing the Sales Order details or PO in a manner which can be used very easily. A readily available solution for delivering any customized need in terms of pixelated reporting can be met easily with the tool
Just like any other implementation: When designing the differing reports, get end users' input, make sure to design the reports so that they display the information that the company requires, in the best and clearest way possible.
Test, test, test, revise when needed, and, particularly, do sufficient training so users are comfortable using Crystal Reports!
All others apps are enablers and Microsoft Power BI is the visual that end user sees which often adds more value to the end user to make strategic decisions from this. All are equally great but Microsoft Power BI is the end result
For standard pixel perfect reporting, our company still uses Crystal Reports. It allows us to continually provide standard reporting to our clients. For dashboards, we are moving towards Microsoft Power BI. Power BI allows similar collaboration, but generally has better features for dashboards. Power BI also allows us to publish multiple reports and dashboards into a single app for our end users.
We're still early in the adoption process at this company, but we've illustrated how bad data keeps us from being more productive. ~25% of a team's work week was dedicated to effectively cleaning up entries, but it was always seen as a normal to them.