AB Tasty is a SAAS application created for e-marketers that enables them to optimize their website and conversion rate without technical knowledge. They can test several versions of their pages to identify which one has the biggest impact on their business objectives, e.g. click-through rate on a call to action button, add-to-cart rate, global conversion rate of their website.
N/A
Chartbeat
Score 6.9 out of 10
N/A
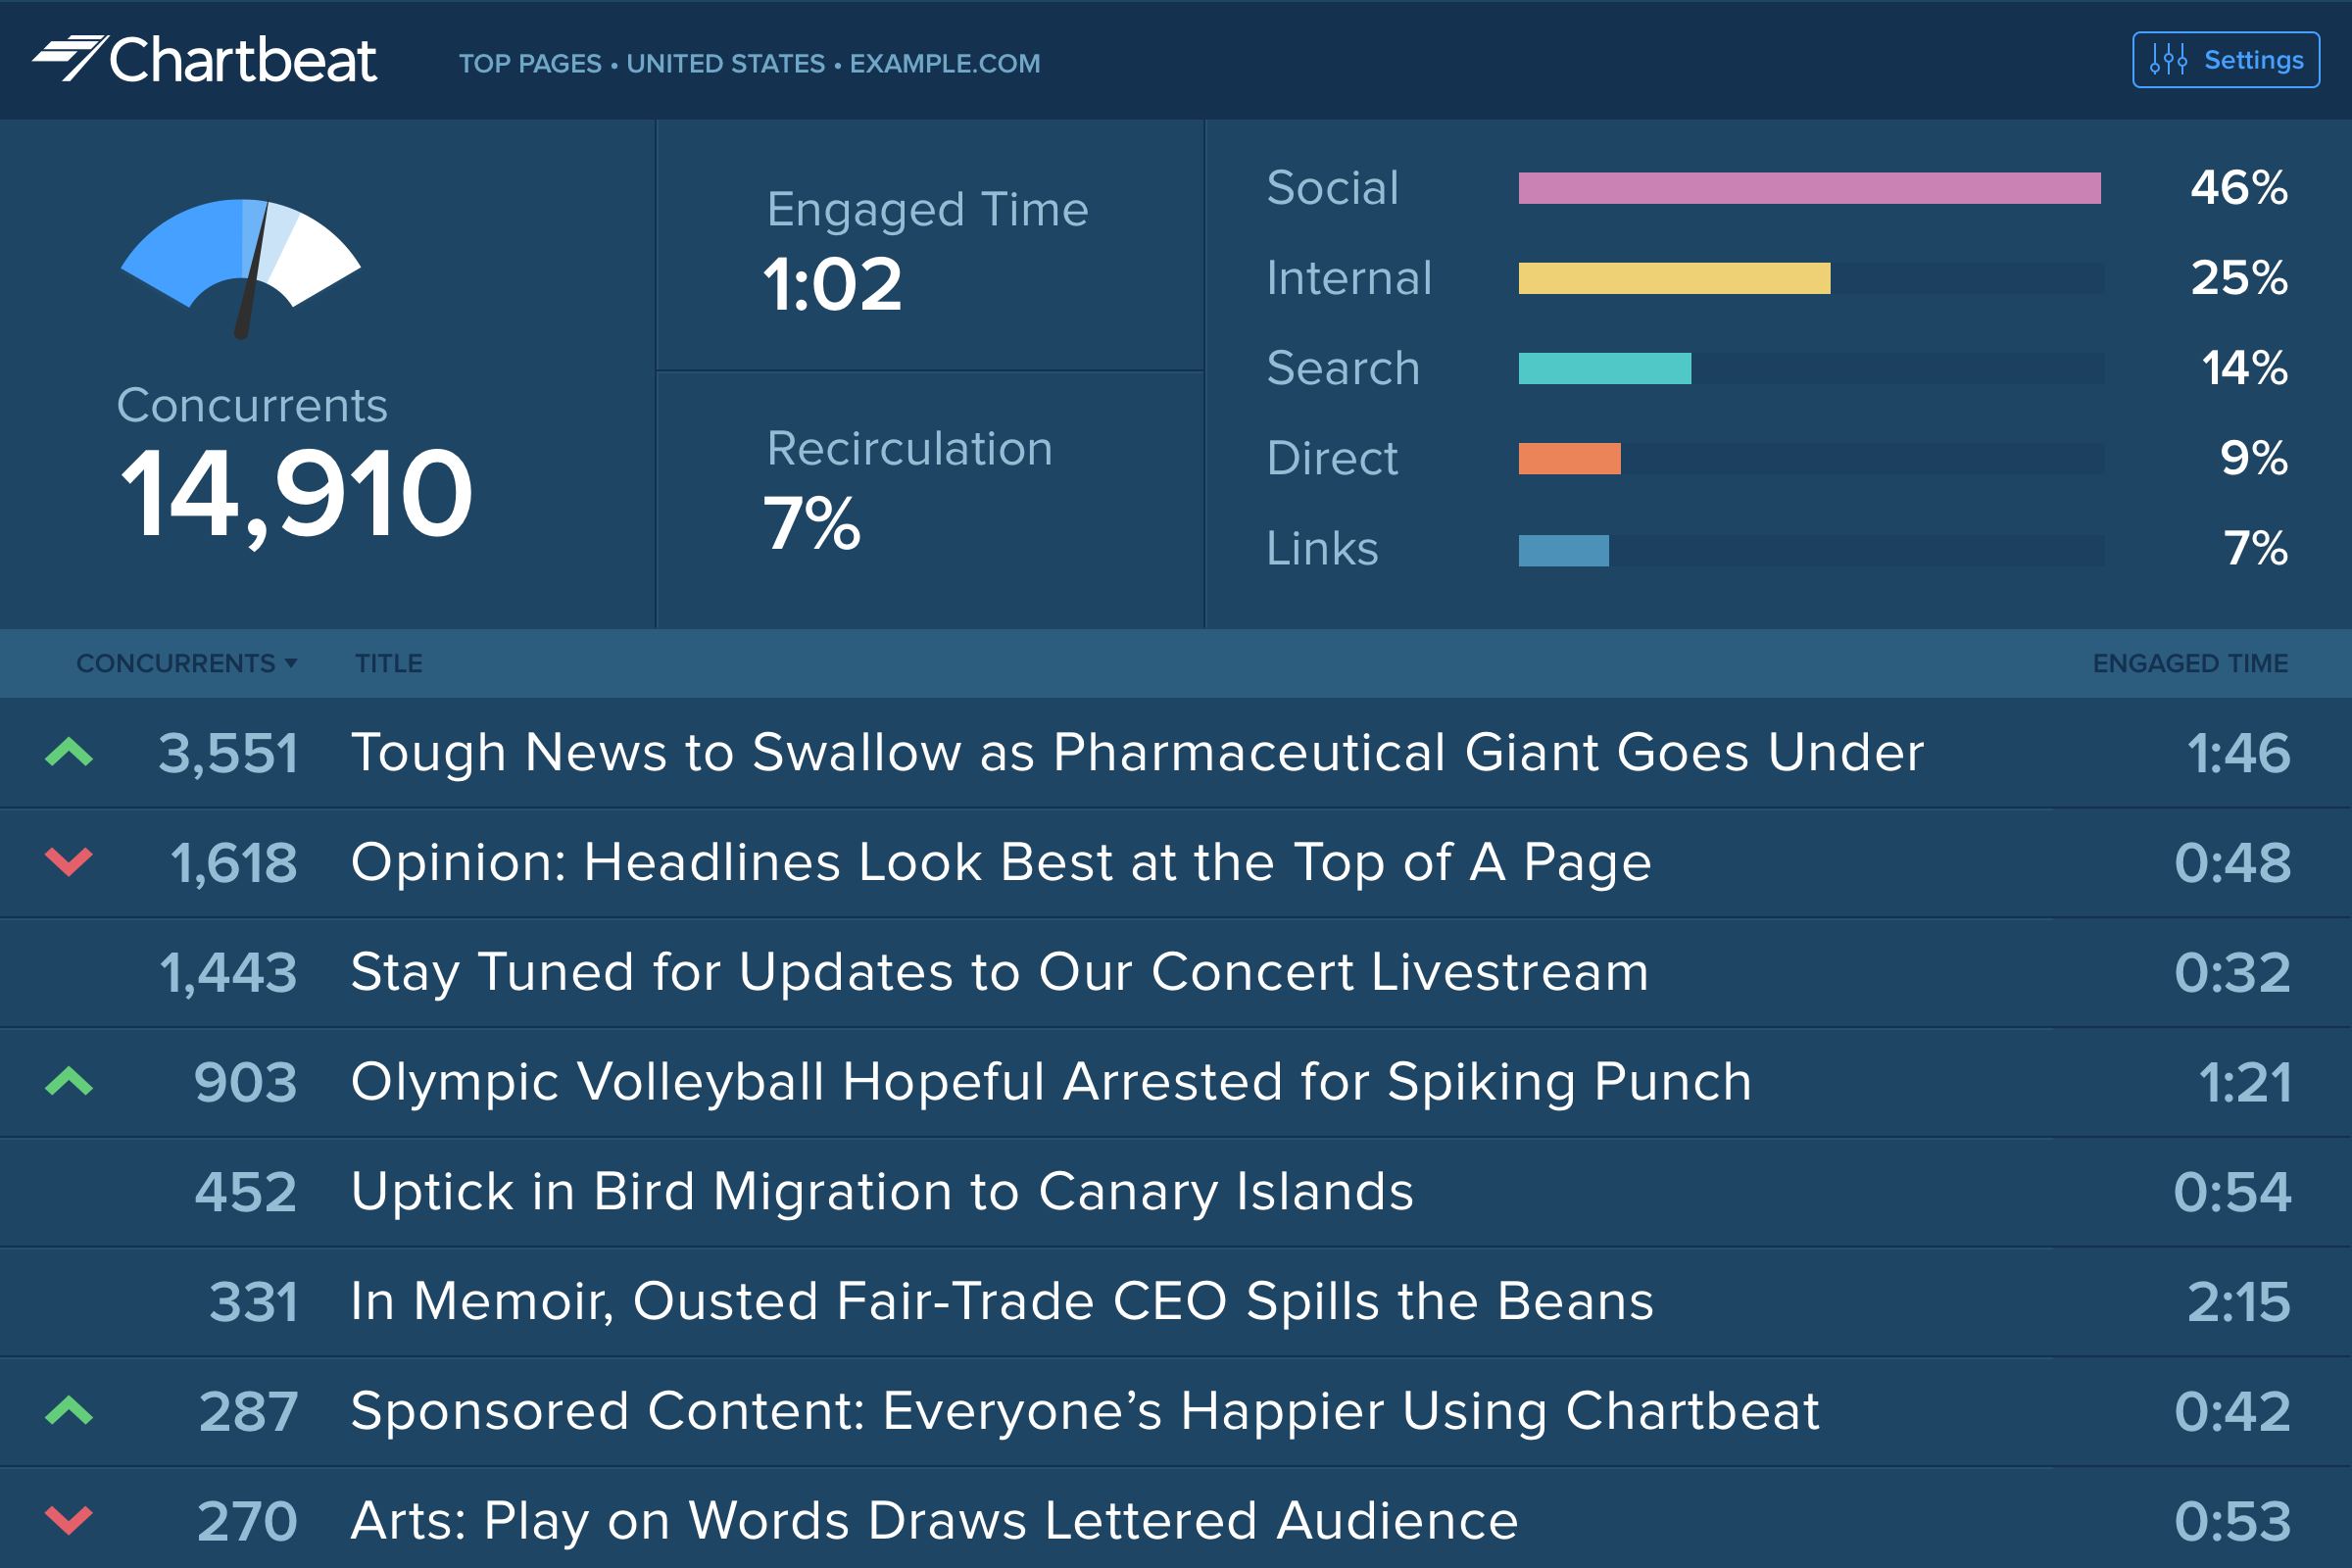
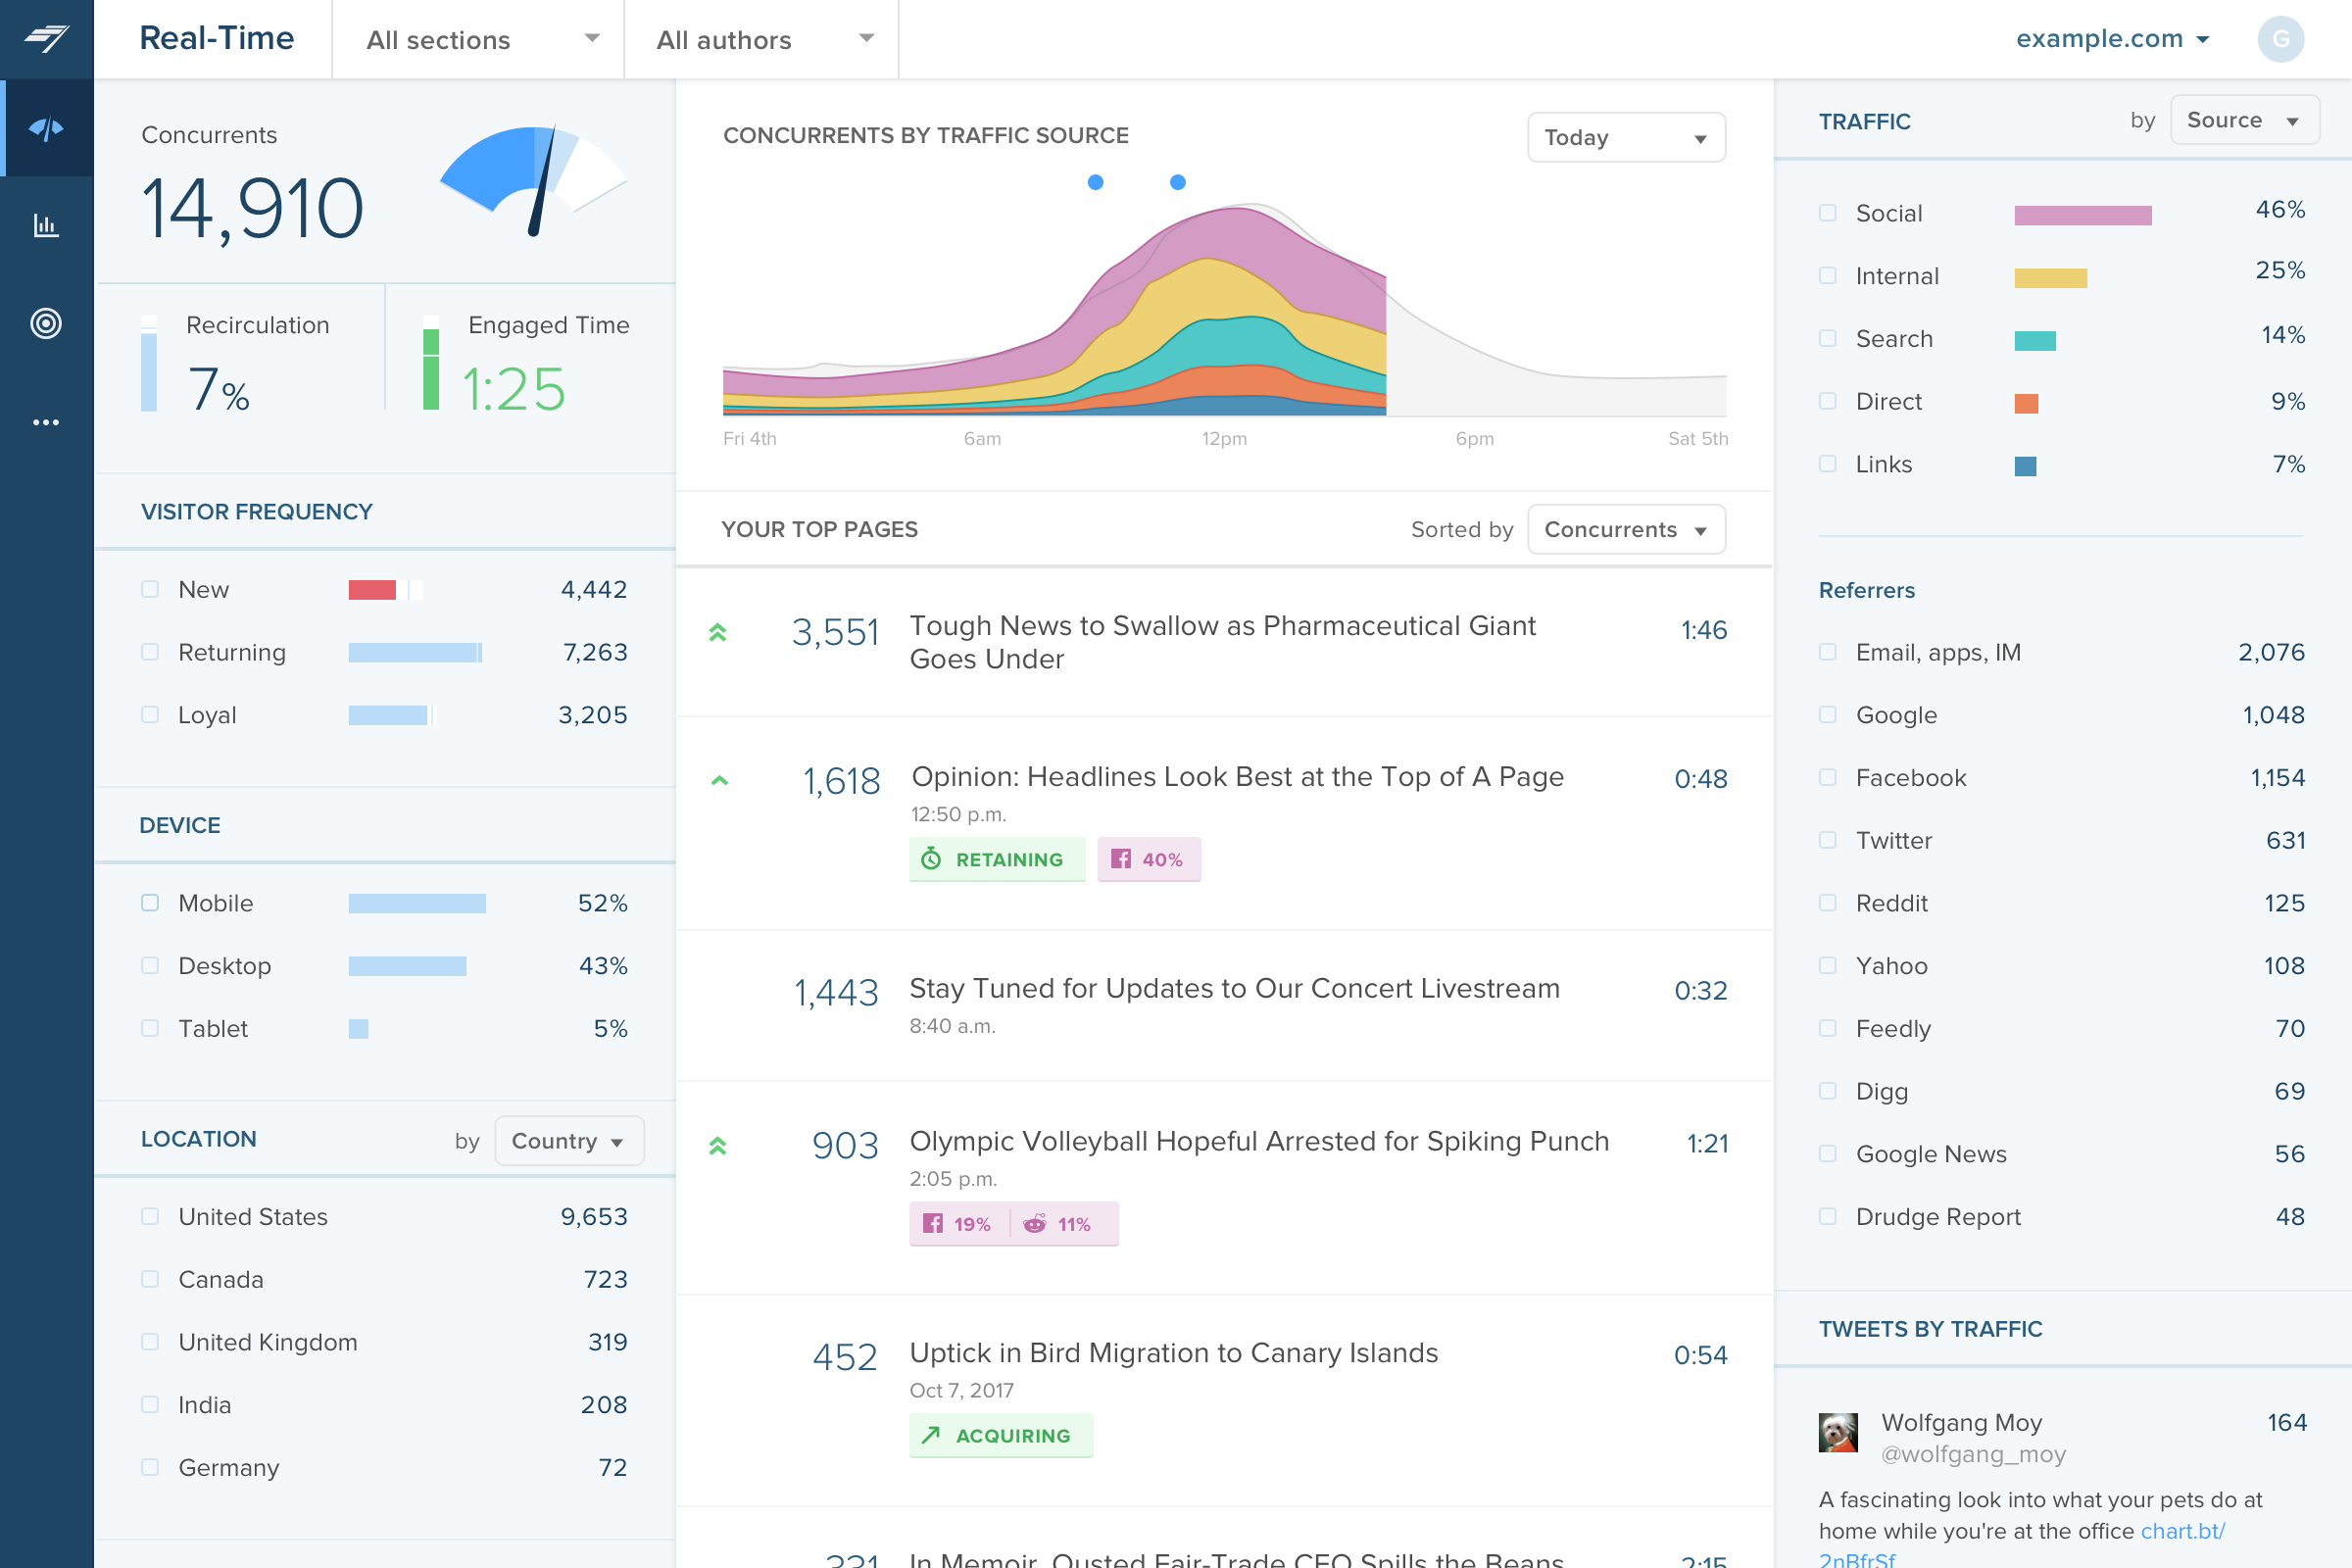
Chartbeat delivers real-time analytics, insights, and transformative tools for content teams around the world, to help improve audience engagement, inform editorial decisions, and increase loyalty.
N/A
Pricing
AB Tasty
Chartbeat
Editions & Modules
No answers on this topic
No answers on this topic
Offerings
Pricing Offerings
AB Tasty
Chartbeat
Free Trial
No
Yes
Free/Freemium Version
No
No
Premium Consulting/Integration Services
No
No
Entry-level Setup Fee
No setup fee
No setup fee
Additional Details
—
Chartbeat pricing is based on monthly site page views. Discounts are applied to multi-year contracts. The Basic Plan includes the Real-time Dashboard, Historical Dashboard, Heads Up Display, Reports, Big Board, iOS and Android app, and Real-time API endpoints.
The Plus Plan includes all of the Basic Plan features, plus ONE of the following Premium features: Headline Testing, Advanced Queries, or Multi-Site View.
The Premium Plan includes all of the Basic Plan features, plus ALL Premium features: Headline Testing, Advanced Queries, Multi-Site View, and enterprise-level support and custom trainings.
A/B Tasty tool allows us do easy testing without burdening our limited developer resources all the time. Reports are simple enough to interpret. Support has been excellent and proactive, also the onboarding was successful. It is also an advantage that we have the possibility to drive all our traffic to the test versions rather than being limited to specific user amount per month. We can recommend A/B Tasty for testing purposes, as the platform keeps it’s promises, doesn’t require too much technical knowledge and the support is excellent.
It is well suited to keeping me toward a specified goal, and gives me concrete numbers and gives me an idea of what we need to do to meet our goals. It's less appropriate if you want something more than pageviews, and doesn't really do a lot for video views.
Easy setup - Simple script insertion into site header.
Intuitive interface - It took very little training for our team to understand how to start running A/B tests. The reporting is much more comprehensive, yet easily digestible than other platforms we have used or considered. Confidence scores, flexible KPI inclusions/tracking allow us to understand the results or non-result quickly and with clarity to make decisions on next steps.
Customer support - Our CSM and tech support are always helpful and proactive when a question or issue arise. Our CSM keeps us on track when an idea might have dropped off the map due to other priorities, and brings great ideas to the table. We enjoy our monthly touchbases with her when we get to see new functionalities, how other clients successfully used them, and brainstorm ways we can use them for our experience.
Sometimes when you're preparing a test the editor "crashes" and you need to re open it. It's just a matter of having to go back to the main dashboard a few times during your preparation.
Maybe to have the option to have pre-build templates of pages, buttons and assets that we can use to test experiments.
Source of traffic needs improvement. Search and social make sense, but "internal" and "links" is a grey area. It would be helpful to define those with an organization and provide an information icon so users can easily remember what each of those buckets is tracking.
More ways to customize the real-time board. For example, with video content, that's great that I can see a user has started a video, but what is the completion rate, was that only on O&O or can that track Facebook, too?
Would like to see demo (age) information included as a way to slice the data so I can see what's working with my older and younger demo.
AB Tasty's tool as well as the support team completely met my goals on A/B Testing. Editing a test is really easy and AB Tasty made the marketing team free to launch nearly any test. Reporting is also easy to set up and give us the information needed to keep improving transformation on landing pages and forms
I gave Chartbeat a 5 for a renewal rating, because, while it delivers clear and understandable content, Google Analytics also provides many of the same features for free. For a small to medium website, I believe it would be more cost effective to use Google Analytics. A website with a high amount of traffic, however, could merit spending the money on Chartbeat to maximize their potential.
The tool’s usability is excellent, with a smooth and intuitive interface. It is continuously updated with new features and improvements aimed at enhancing the user experience. Setting up experiments and personalizations is straightforward, thanks to a well-structured process that even less experienced users can easily follow. There are sometimes small issues with the QA section which slows the QA process but it is so much better now compared to 2024.
Chartbeat is really pretty straightforward. The only things that may cause confusion are the string of sidebar features and tools at the left of the screen. I mostly use the big leader board in real-time and the historical feature (looking at the monthly or weekly performance of my team's content) and then generate reports automatically from there.
Support is good, but it would be better if it was quicker or if AB Tasty provided a quicker SLA. At times, you require stuff urgently but AB Tasty support isn't as quick as I personally like it to be.
I have had limited experience of support for Chartbeat but whenever I have needed help it has been there. Recently there was an issue of seeing different forms of data in real time - app and otherwise effectively, and the issue was being clearly dealt with and communicated back to us.
There is a vast amount of training available on their online platform, including their university area of which you can get certified for (and then share this with your connections on platforms such as Linkedin). There is also specific hand created training which can be provided by your customer success manager if that is requested by yourself.
We selected AB Tasty mostly because we got a sense that their dev and customer service teams were going to go above and beyond to help us out. We were right! The cost was also a factor as they came in a small bit lower, but cost wasn't the only factor.
Google Analytics has gradually become much more difficult to use, and much slower in its realtime reporting. It was the changes that came in with Google Analytics 4 that gave us the final push to work with Chartbeat - a product some of us were already familiar with from previous jobs. Things are just much harder to find in GA, and when time is always tight you can't afford to spend a long time looking for particular data - it should be quick and easy to locate
This past year we improved our new visitor conversion rates by 73% with very little increases in our ad spend. We've been able to test quickly and infer how those experiments impacted lead generation. Experimentation is all about continually learning and testing.