BrightGauge is a BI tool from ConnectWise that puts essential information in one place, providing visibility for more informed decisions. The user can customize BrightGauge dashboards and sync other business tools in its BI dashboard software for ultimate visibility. Users can also display data with embeddable gauges on public sites.
$325
per month
Rational BI
Score 7.7 out of 10
Enterprise companies (1,001+ employees)
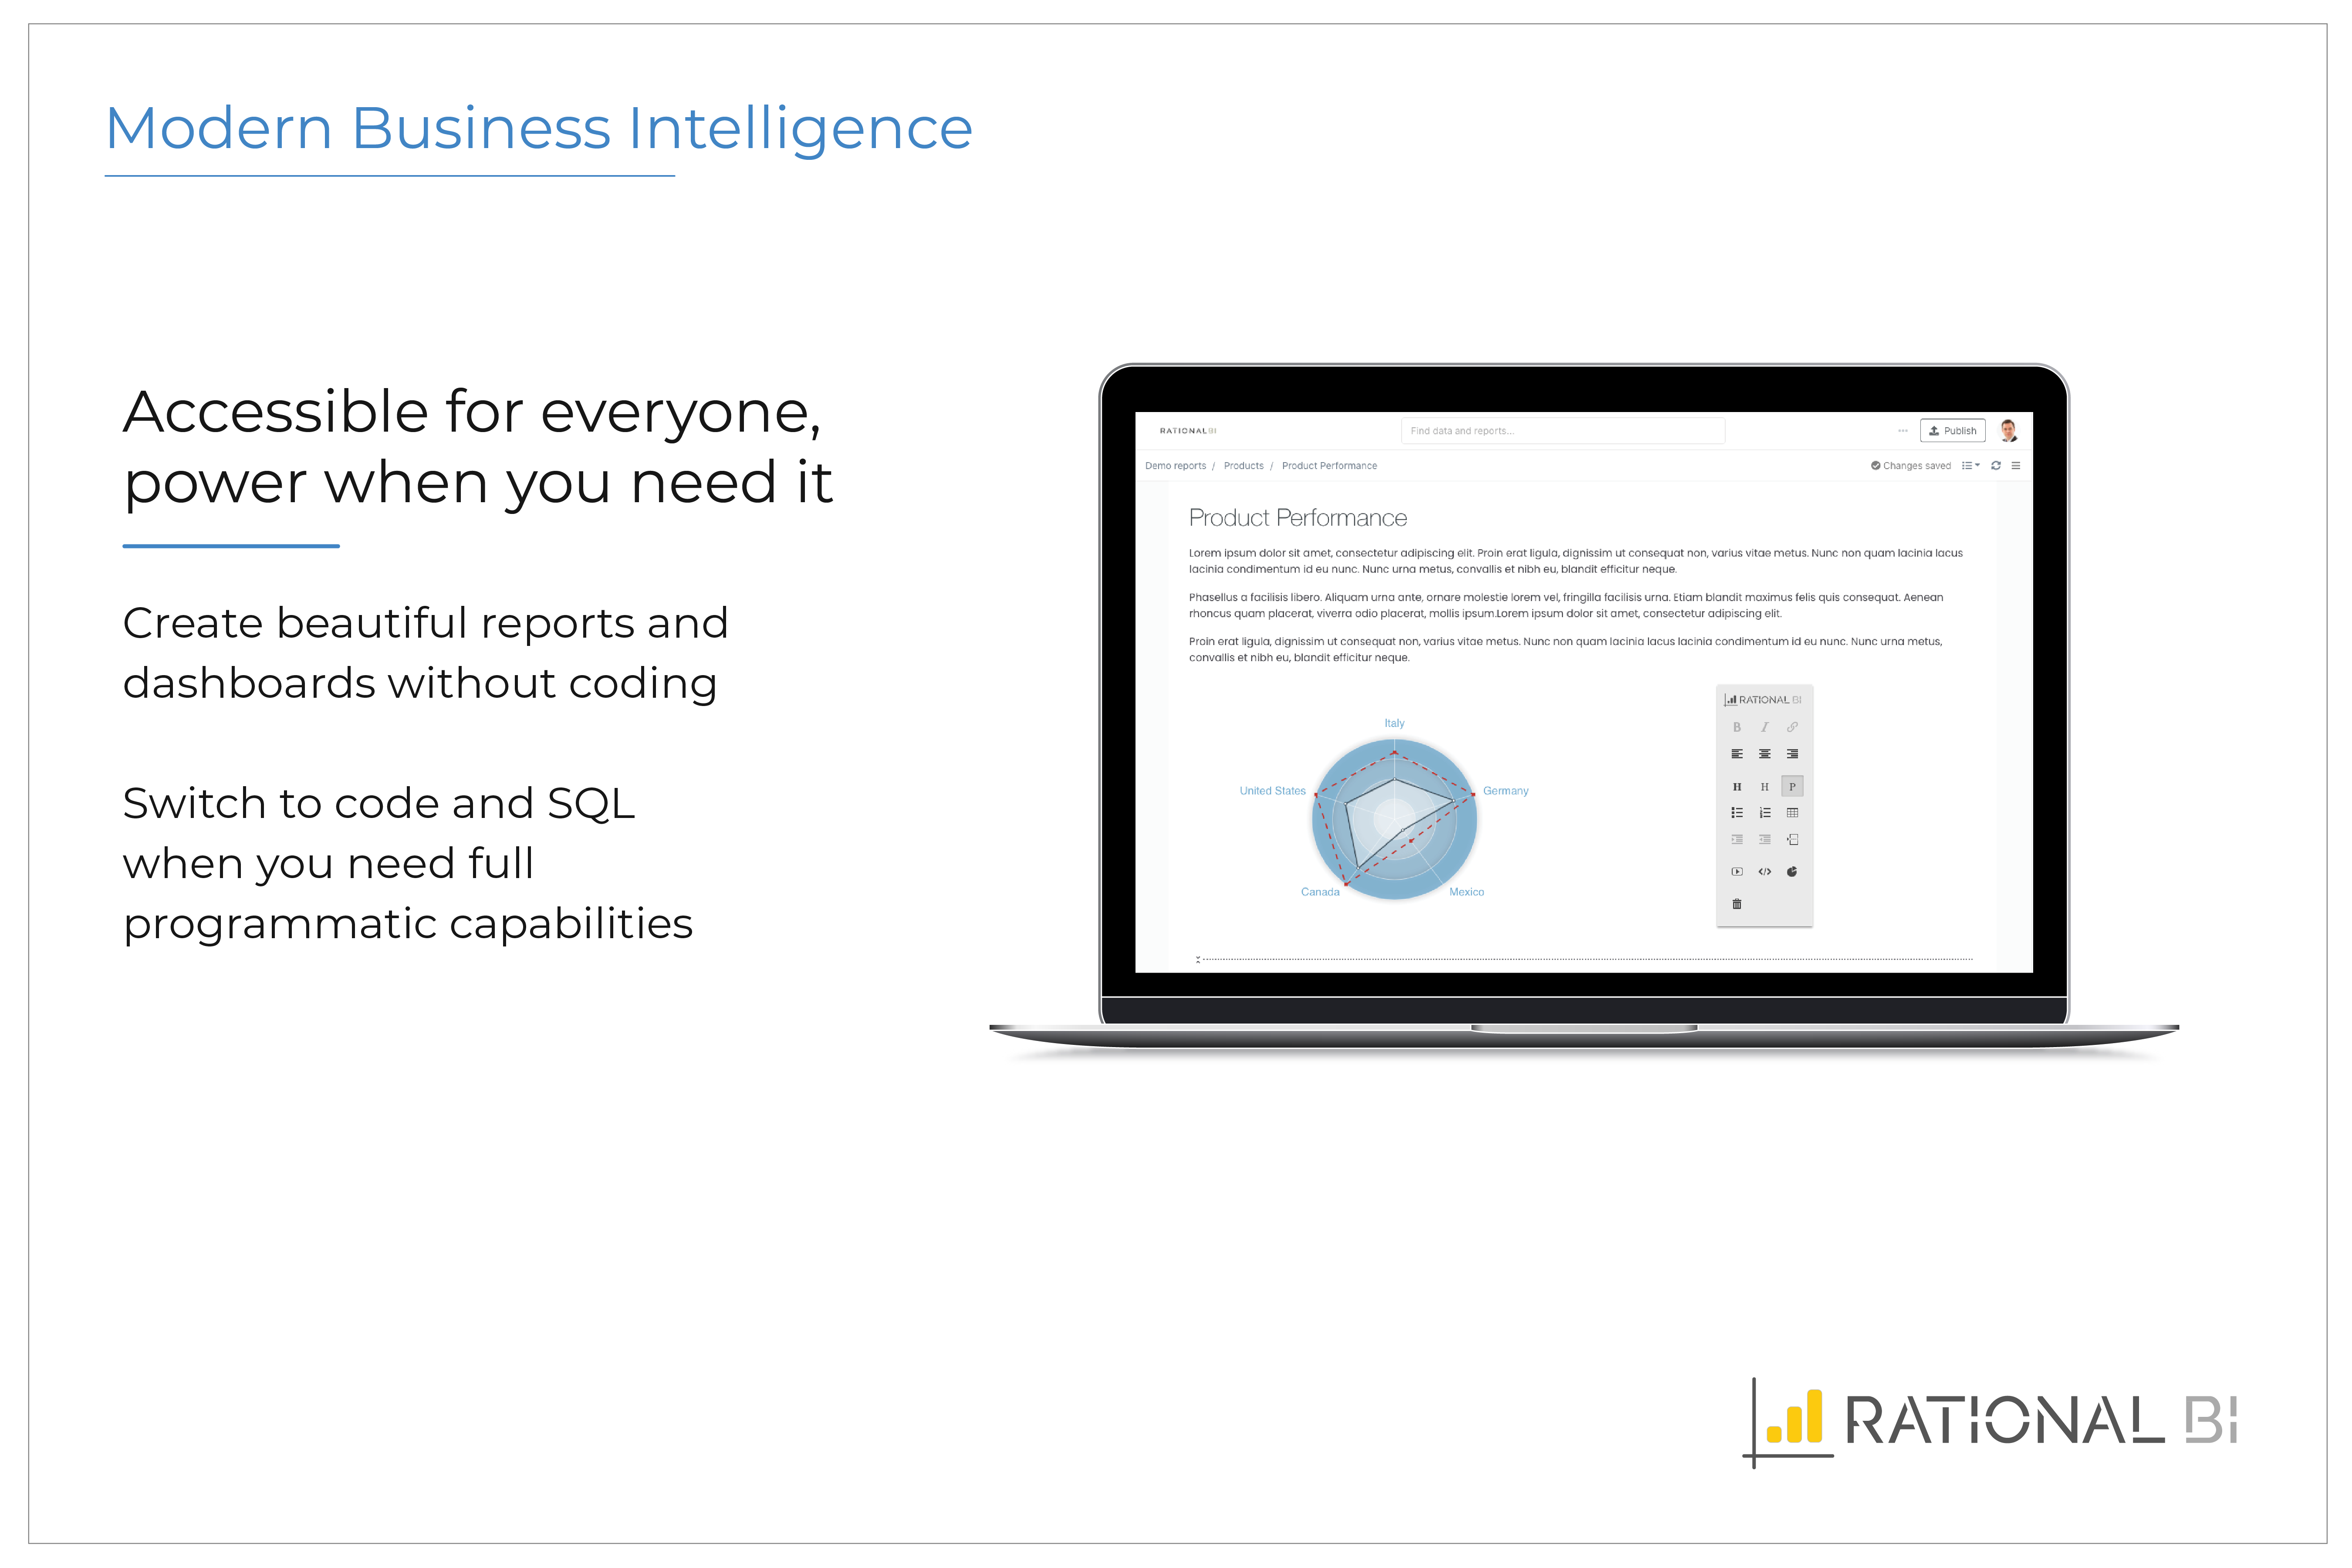
Rational BI provides analytics, data science and business intelligence in an analytical platform that connects to databases, data files and cloud drives including AWS and Azure data sources, enabling users to explore and visualize data. Users can build real-time notebook-style reports directly in a web browser with JavaScript and SQL with direct and live connections to data. Filter and query data with an SQL database embedded in the client, without network…
$0
single user
Pricing
BrightGauge
Rational BI
Editions & Modules
Standard
$325
per month
Enterprise
$449
per month
Enterprise+
$635
per month
Free
$0
single user
Professional
$129
single user
Enterprise
Varies
single user
Offerings
Pricing Offerings
BrightGauge
Rational BI
Free Trial
No
Yes
Free/Freemium Version
No
Yes
Premium Consulting/Integration Services
No
No
Entry-level Setup Fee
$499 one-time fee
Optional
Additional Details
Set up fee is waived for Enterprise+ customers. A discount is offered for annual billing.
Additional cost per extra user (varies by edition)
More Pricing Information
Community Pulse
BrightGauge
Rational BI
Features
BrightGauge
Rational BI
BI Standard Reporting
Comparison of BI Standard Reporting features of Product A and Product B
BrightGauge
8.1
Ratings
1% below category average
Rational BI
8.3
Ratings
1% below category average
Pixel Perfect reports
8.20 Ratings
7.60 Ratings
Customizable dashboards
8.80 Ratings
8.70 Ratings
Report Formatting Templates
7.20 Ratings
8.50 Ratings
Ad-hoc Reporting
Comparison of Ad-hoc Reporting features of Product A and Product B
BrightGauge
7.7
Ratings
5% below category average
Rational BI
8.3
Ratings
4% above category average
Drill-down analysis
8.40 Ratings
7.70 Ratings
Formatting capabilities
8.50 Ratings
8.20 Ratings
Integration with R or other statistical packages
4.70 Ratings
8.00 Ratings
Report sharing and collaboration
9.20 Ratings
9.20 Ratings
Report Output and Scheduling
Comparison of Report Output and Scheduling features of Product A and Product B
BrightGauge
7.9
Ratings
5% below category average
Rational BI
9.0
Ratings
6% above category average
Publish to Web
9.40 Ratings
9.00 Ratings
Publish to PDF
7.40 Ratings
9.00 Ratings
Report Versioning
5.00 Ratings
8.60 Ratings
Report Delivery Scheduling
9.20 Ratings
9.20 Ratings
Delivery to Remote Servers
8.50 Ratings
9.30 Ratings
Data Discovery and Visualization
Comparison of Data Discovery and Visualization features of Product A and Product B
BrightGauge lets us know when we have critical issues that need solving. A massive influx of tickets all at the same time triggers an investigation. Usually, it is tied to a server going down, which we can address. It would not be helpful for a small MSP or IT department with just a few daily tickets. The stats are better used to track a large amount of clients.
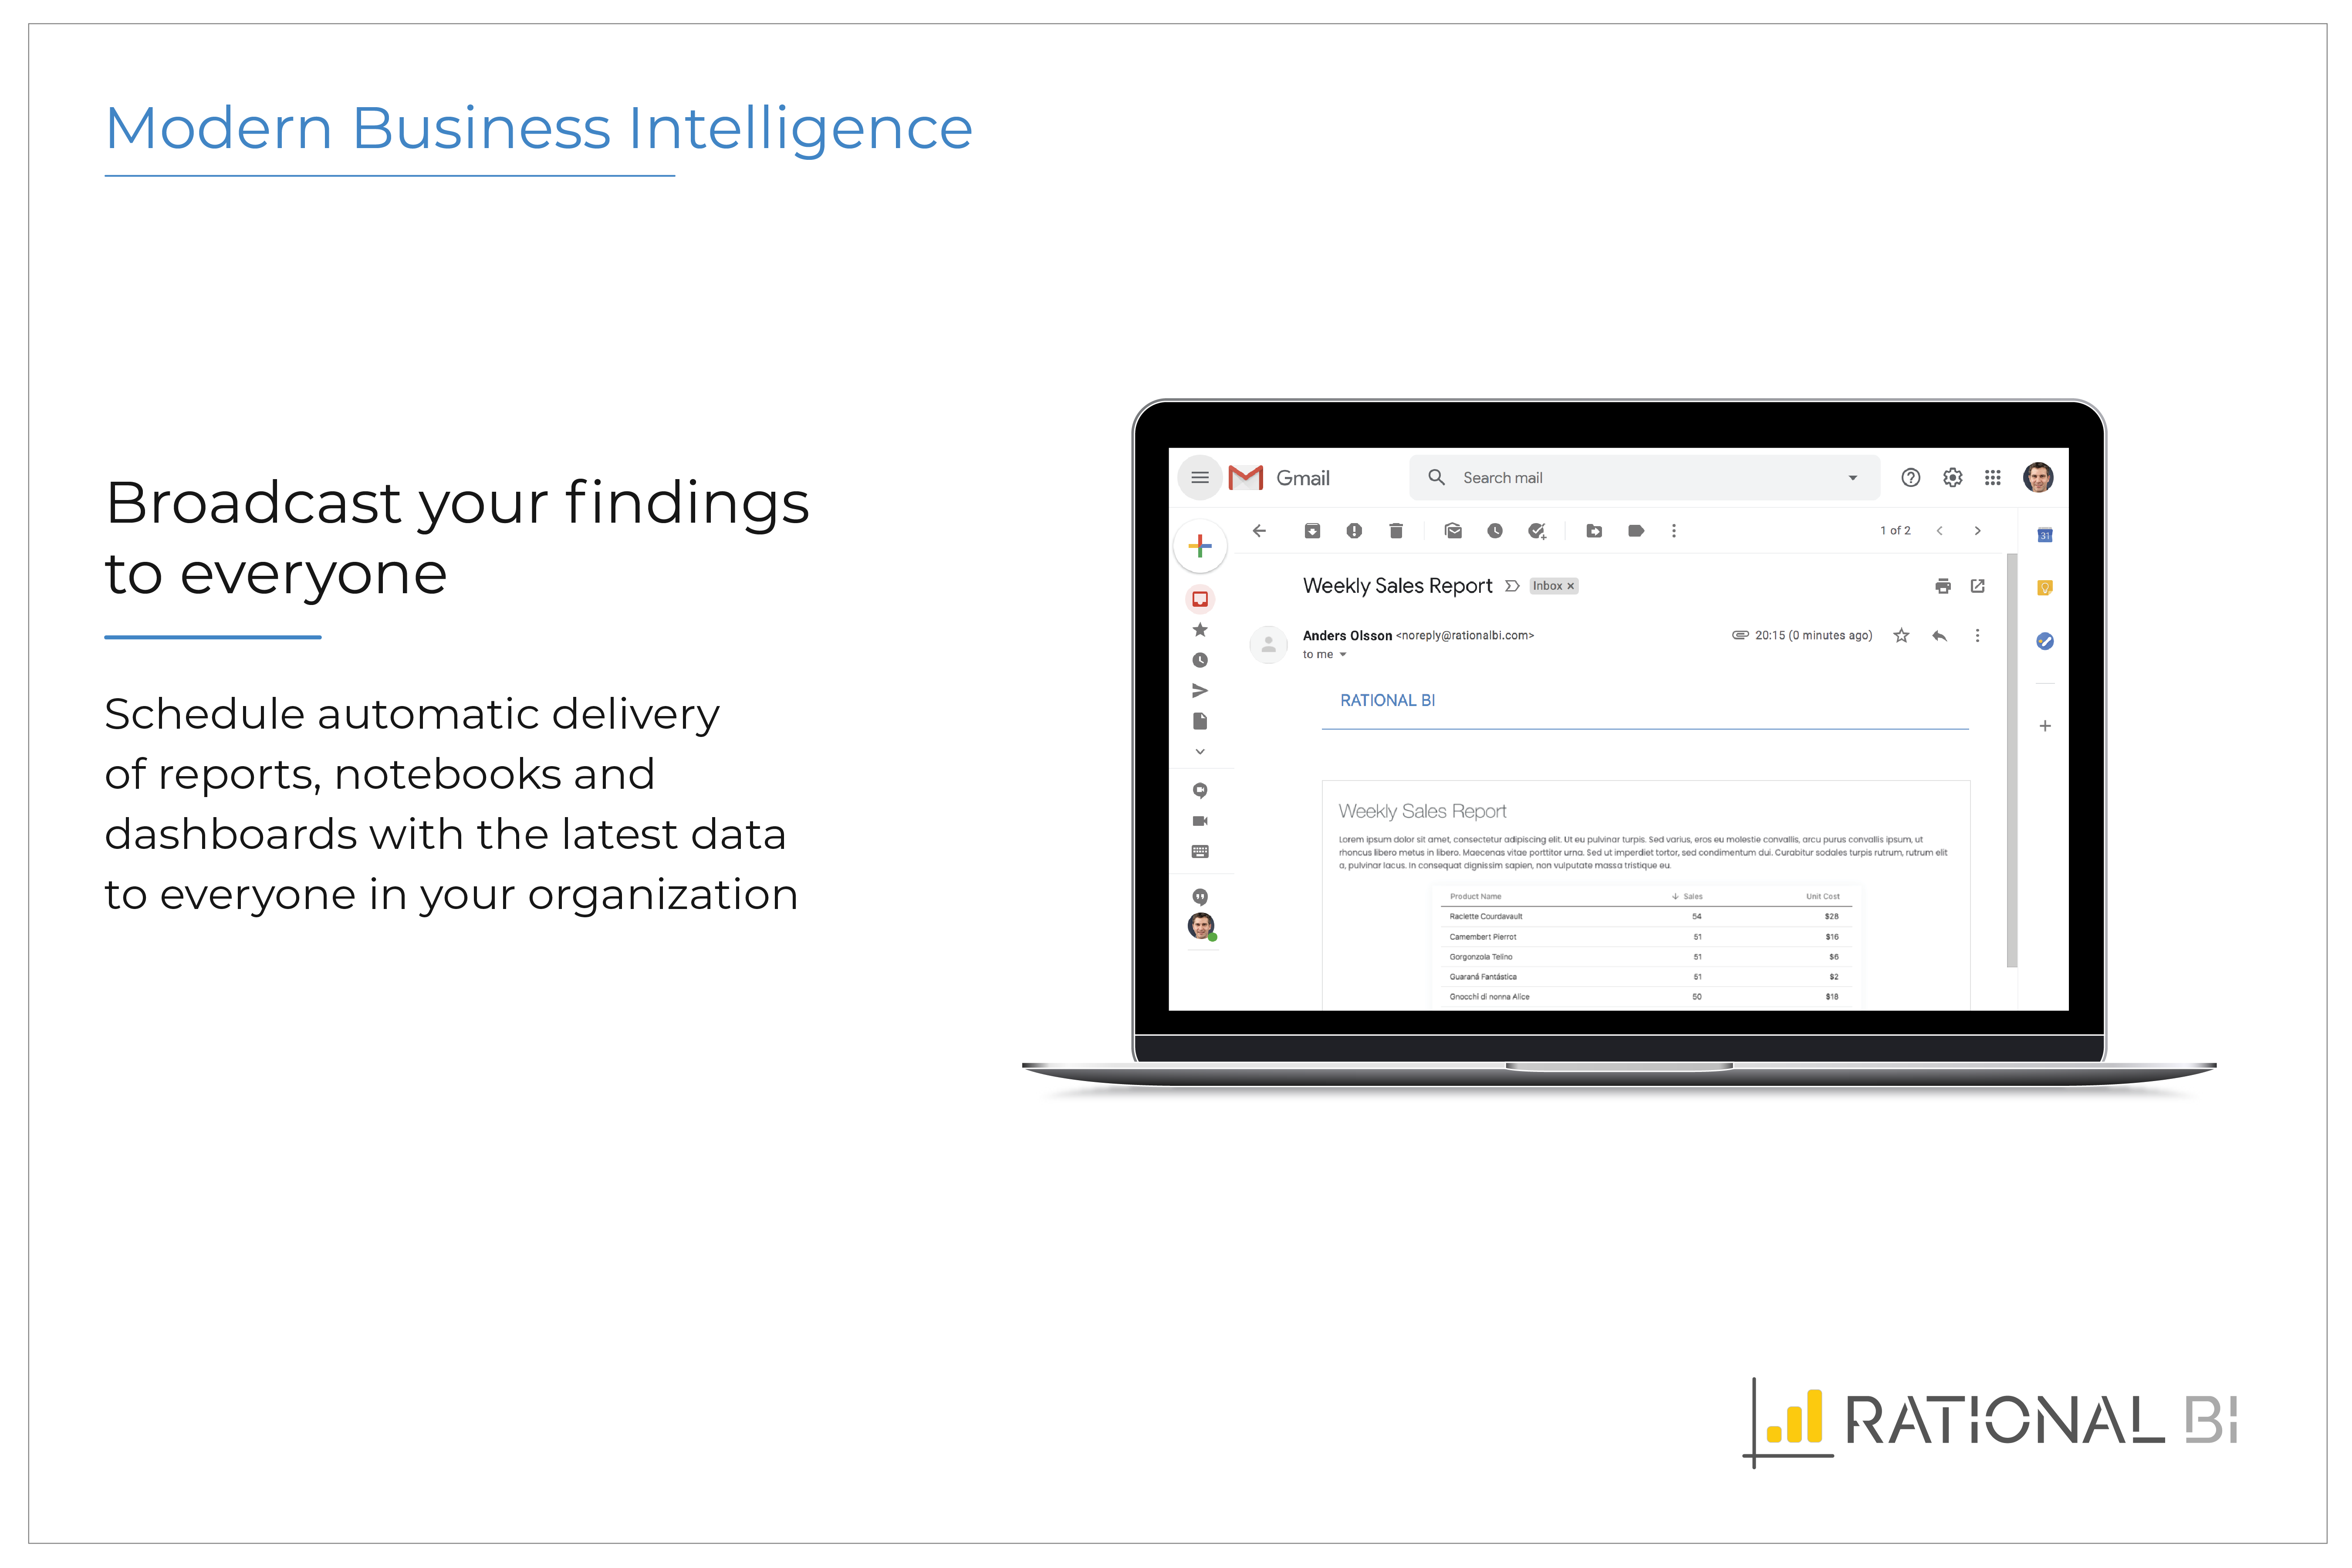
Rational BI allows managing data analysis coming from different projects in order to create useful reports and dashboards. I usually set up automatically scheduled reports. All the stakeholders can easily share a rational view with the possibility to filter between the interesting arguments. Sometimes different user profiles could be needed, optimize the view.
Documentation for new users could be better. Sometimes it's hard for my users that are not that skilled in IS/IT to set up data connectors are understand the dynamics of data sources.
I have used several other BI solutions as well, and their GUI is okay, but surely there is also room for improvement here. Not all things are made entirely logically.
Understanding their price structure. Generally, their website looks nice, but it's not very informative when it comes to pricing, and support options. I really miss some kind of transparency and overview.
Usability is BrightGauge's strength. Granting the ability of virtually any user to be able to create a dashboard is incredibly valuable. If an organization very simple and straight forward reporting needs then BrightGauge is a perfect fit for them. Connecting to the dataset we used was very quick and easy and I imagine it would be the same for any major data source you would like to pull from.
Rational BI allows managing data analysis coming from different projects. The outputs are one or more reports, that can be delivered automatically to the stakeholders or other communication media inside the organization. Nice dashboards help to describe and analyze data. Sometimes different user profiles could be needed, optimize the view.
We did not need to use BrightGauge's support for the entire time that we used it. Best support is always the one that isn't needed because nothing breaks.
I'm not aware of any other competitors to Bright Gauge that we selected. They seem to be very close to managed IT service providers and have been great at tailoring their support to the PSAs like ConnectWise, AutoTask, etc. I can see Bright Gauge getting more and more popular as time goes by
Today there are many companies providing BI solutions, and generally, I think Microsoft Power BI is the easiest go-to solution as it is part of the Office365 software. However all software solutions have their limitations, advantages, and disadvantages, but sometimes you don't need the perfect solution. You just need a solution that delivers 80-90 percent of the full potential to reach your goal and in this scope, we were really happy with Rational BI.
For larger customers, the dashboarding has helped our customers to remain sticky and add services/revenue to our MSP. They want to add more fragments of their IT for the 1 pane rollup.
From a leadership perspective, BG has allowed me to make difficult staffing decisions with confidence. Detailed metric driven decisions on who is hitting KPIs/who isn't - as well as when data proved we were overstaffed and understaffed.