Chartbeat delivers real-time analytics, insights, and transformative tools for content teams around the world, to help improve audience engagement, inform editorial decisions, and increase loyalty.
N/A
Kissmetrics
Score 9.6 out of 10
Mid-Size Companies (51-1,000 employees)
Kissmetrics is a customer engagement automation platform. This solution includes behavioral analytics, segmentation, and email campaign automation.
$500
Monthly Tracked People
Pricing
Chartbeat
Kissmetrics
Editions & Modules
No answers on this topic
Growth
$500
Monthly Tracked People
Power
$850
Monthly Tracked People
Enterprise
Custom
Monthly Tracked People
Offerings
Pricing Offerings
Chartbeat
Kissmetrics
Free Trial
Yes
Yes
Free/Freemium Version
No
No
Premium Consulting/Integration Services
No
No
Entry-level Setup Fee
No setup fee
$1,500 per installation
Additional Details
Chartbeat pricing is based on monthly site page views. Discounts are applied to multi-year contracts. The Basic Plan includes the Real-time Dashboard, Historical Dashboard, Heads Up Display, Reports, Big Board, iOS and Android app, and Real-time API endpoints.
The Plus Plan includes all of the Basic Plan features, plus ONE of the following Premium features: Headline Testing, Advanced Queries, or Multi-Site View.
The Premium Plan includes all of the Basic Plan features, plus ALL Premium features: Headline Testing, Advanced Queries, Multi-Site View, and enterprise-level support and custom trainings.
What are Monthly Tracked People?
Monthly Tracked People are unique visitors that engage in an Event on your website or with your product, that gets tracked by you in Kissmetrics.
Monthly Tracked People can be anonymous or identified.
It is well suited to keeping me toward a specified goal, and gives me concrete numbers and gives me an idea of what we need to do to meet our goals. It's less appropriate if you want something more than pageviews, and doesn't really do a lot for video views.
[Kissmetrics is well suited for the] abandon cart scenario to re-engage users on the purchase journey. Engaging users to personalized content using the visit metrics derived from the data captured at each digital touch points. [Implementing] website campaign and journey orchestration is easy. You get visitor profile to segment upon using different visit metrics and action.
Kissmetrics has a fantastic dashboard where you can see all relevant metrics immediately after login.
Kissmetrics was extremely easy to implement in our site and it works across different platforms.
After the initial setup, managing and creating new events to track is super simple.
You can monitor live usage. This feature allows you to monitor user interactions as they are happening and as events you are tracking are triggered. You can see exactly what users are doing real time, which is really a very cool feature. At the time, this kind of realtime monitoring was not possible with Google Analytics.
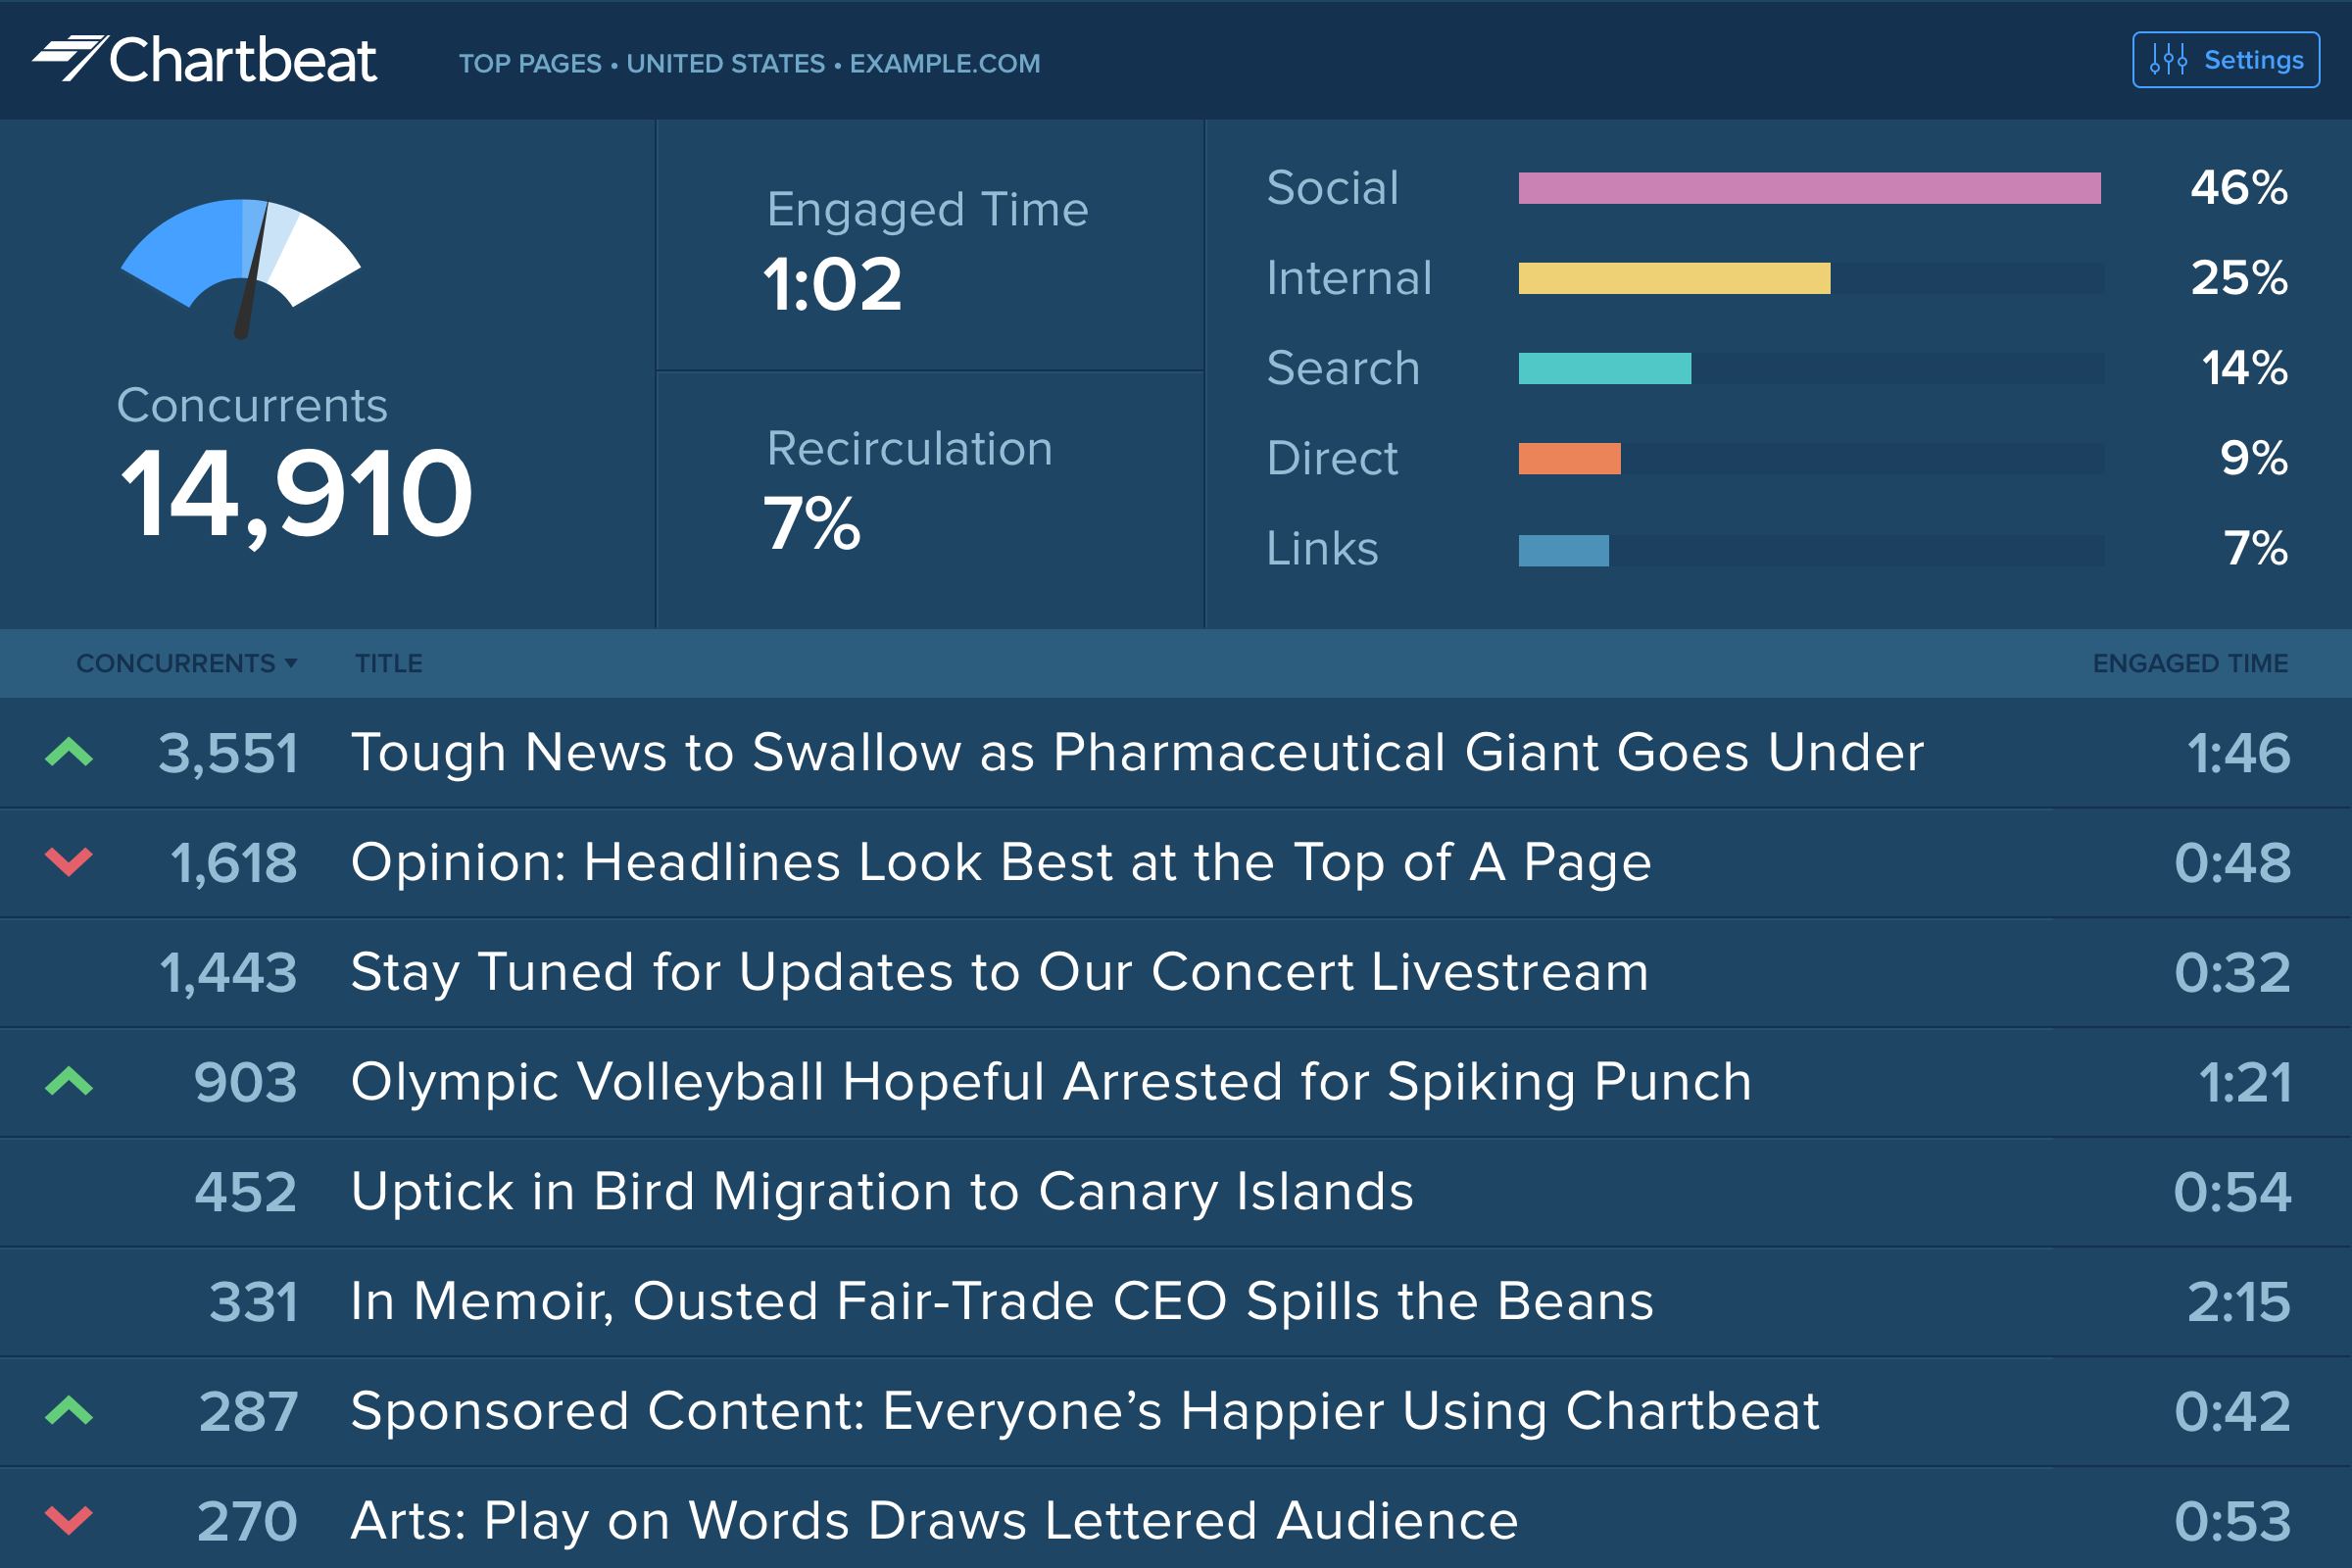
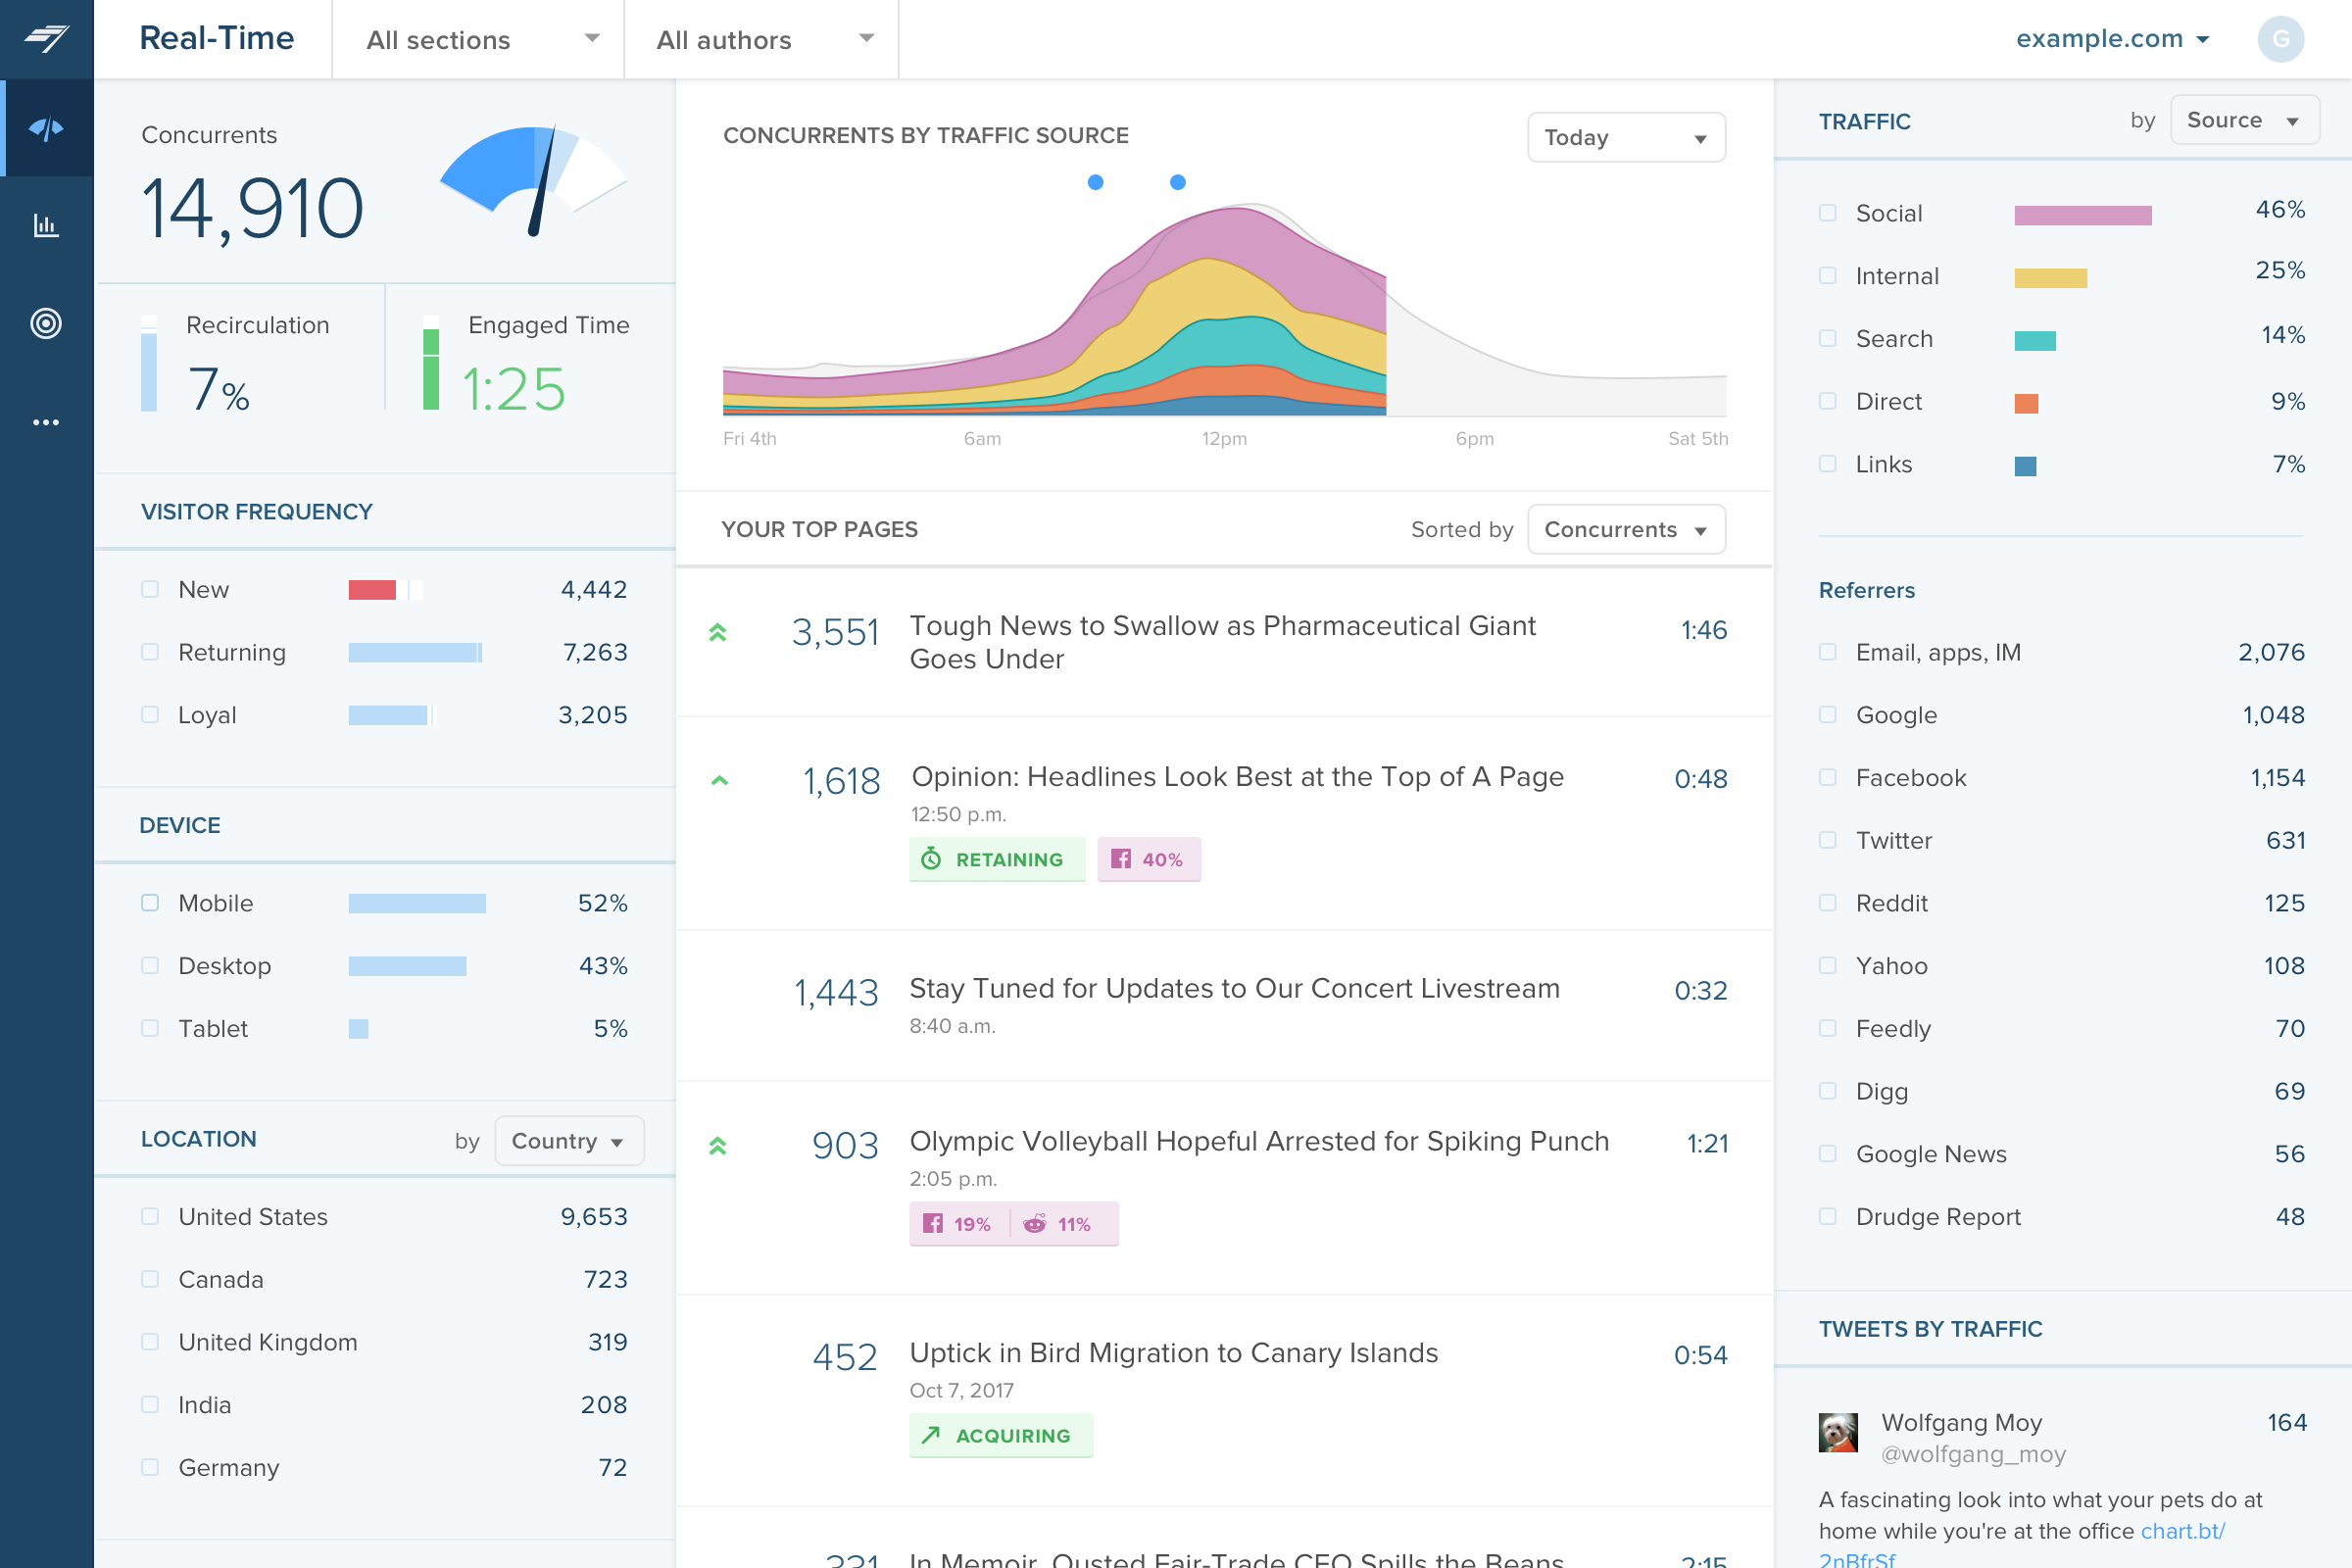
Source of traffic needs improvement. Search and social make sense, but "internal" and "links" is a grey area. It would be helpful to define those with an organization and provide an information icon so users can easily remember what each of those buckets is tracking.
More ways to customize the real-time board. For example, with video content, that's great that I can see a user has started a video, but what is the completion rate, was that only on O&O or can that track Facebook, too?
Would like to see demo (age) information included as a way to slice the data so I can see what's working with my older and younger demo.
The biggest issue, is that I have lost faith in the accuracy of the data.
There have been a few examples of the system producing what looks like spurious data. I triangulate the data using Google Analytics, and on a few occasions, there have been very wide discrepancies that indicate a potentially serious problem. For example, Google might indicate 1,000 page views, while KISSmetrics indicates 5,000.. This is not a constant problem, but it has happened enough where my faith in the data is shaken.
It really doesn't matter how good the front-end functionality is if my faith in data accuracy is not 100%.
A/B testing is much more difficult than it needs to be. It is possible to structure the product to enable A/B testing, but this involves reading a bunch of help files and writing some code. I would have expected this to work out-of-the-box. In Google Analytics, for example.you only have to enter two URLs and then it works. This was a surprise.
I gave Chartbeat a 5 for a renewal rating, because, while it delivers clear and understandable content, Google Analytics also provides many of the same features for free. For a small to medium website, I believe it would be more cost effective to use Google Analytics. A website with a high amount of traffic, however, could merit spending the money on Chartbeat to maximize their potential.
I used KISSmetrics on a daily basis whilst a summer analyst at a language-learning software startup company called Voxy. To my knowledge, the company continued to use KISSmetrics. I am no longer at Voxy but we were pleased with KISSmetrics.
Chartbeat is really pretty straightforward. The only things that may cause confusion are the string of sidebar features and tools at the left of the screen. I mostly use the big leader board in real-time and the historical feature (looking at the monthly or weekly performance of my team's content) and then generate reports automatically from there.
For basic operations, the product is relatively user-friendly, considering how complicated a topic data and analytics can be. The engineering integration work is very straightforward, and building standard report types is pretty easy. However, there were a few rough spots. Event mapping and some of the deeper account settings are not well explained. And the Power Reports functionality is just utterly, impossibly confusing
In a year, we had trouble logging-in just once. But even then all tracking data was later available once the site came back up. also, the system down notices were very informative - they explained the reason for the downtime and were constantly updated with progress in getting the problem resolved.
Speed improved dramatically as the service matured. Early iterations of the publicly-released application would occasionally provide slow processing of results, but those delays became much rarer occurrences during the last year that we used KISSmetrics. One of the more impressive views (which started out feeling more like a toy) is the live view of visits. Knowing that you could see, in real time, what events a user triggered, was gratifying and instructive.
I have had limited experience of support for Chartbeat but whenever I have needed help it has been there. Recently there was an issue of seeing different forms of data in real time - app and otherwise effectively, and the issue was being clearly dealt with and communicated back to us.
Everytime that I've needed or contacted support, I've received a quick response and timely help! There was even a major issue we had with connecting Unbounce into Kissmetrics. They brought in multiple people and worked with us for hours to make sure we could figure out the issue and get everything running! I have no complaints about the support team!
Again, we were fortunate to work with KISSmetrics as they built their application, but Hiten, their CEO and founder, was incredibly helpful to me personally, and to our metrics-driven business as a whole, as we adopted their tool.
I loved this aspect of the product. It wasn't just that the documentation and online tutorials are great - which they are - the on-boarding process though was really stellar. Once you have set everything up, you get a welcome message followed by a step-by-step guide to get you started that is built right into the product interface. For example, the UI asks you to first do X, and then copy this code snippet and send it to your developer who will know what to do with it. When you come back after the first interaction with the product, it continues the process by explaining right in the UI how to track events etc. This kind of step-by-step approach is incredibly efficient. Although there are various forms of supporting documentation (PDFs videos etc) to support every step, you don't really need them. This approach means that you are up and running very quickly with virtually no training time or documentation consultation. Highly efficient process.
In order to build trackability down to revenue, there was quite a lot of work to integrate Kissmetrics with our software and internal process. We had to build the hooks so that Kissmetrics could call back into our software and billing system, etc.. However, we didn't need additional expertise to do this. Once you understand the API, and you own systems, making it work is not too difficult. We did not require an outside consultant or anything like that
Google Analytics has gradually become much more difficult to use, and much slower in its realtime reporting. It was the changes that came in with Google Analytics 4 that gave us the final push to work with Chartbeat - a product some of us were already familiar with from previous jobs. Things are just much harder to find in GA, and when time is always tight you can't afford to spend a long time looking for particular data - it should be quick and easy to locate
It has been a while since I demoed Heap and Optimizely but the main points that stick out in my head are that Kissmetrics had more transparent and cheaper pricing. Kissmetrics offered all the same functionality, and at least from my personal experience, the staff at Kissmetrics was easier to work with and nicer to interact with.