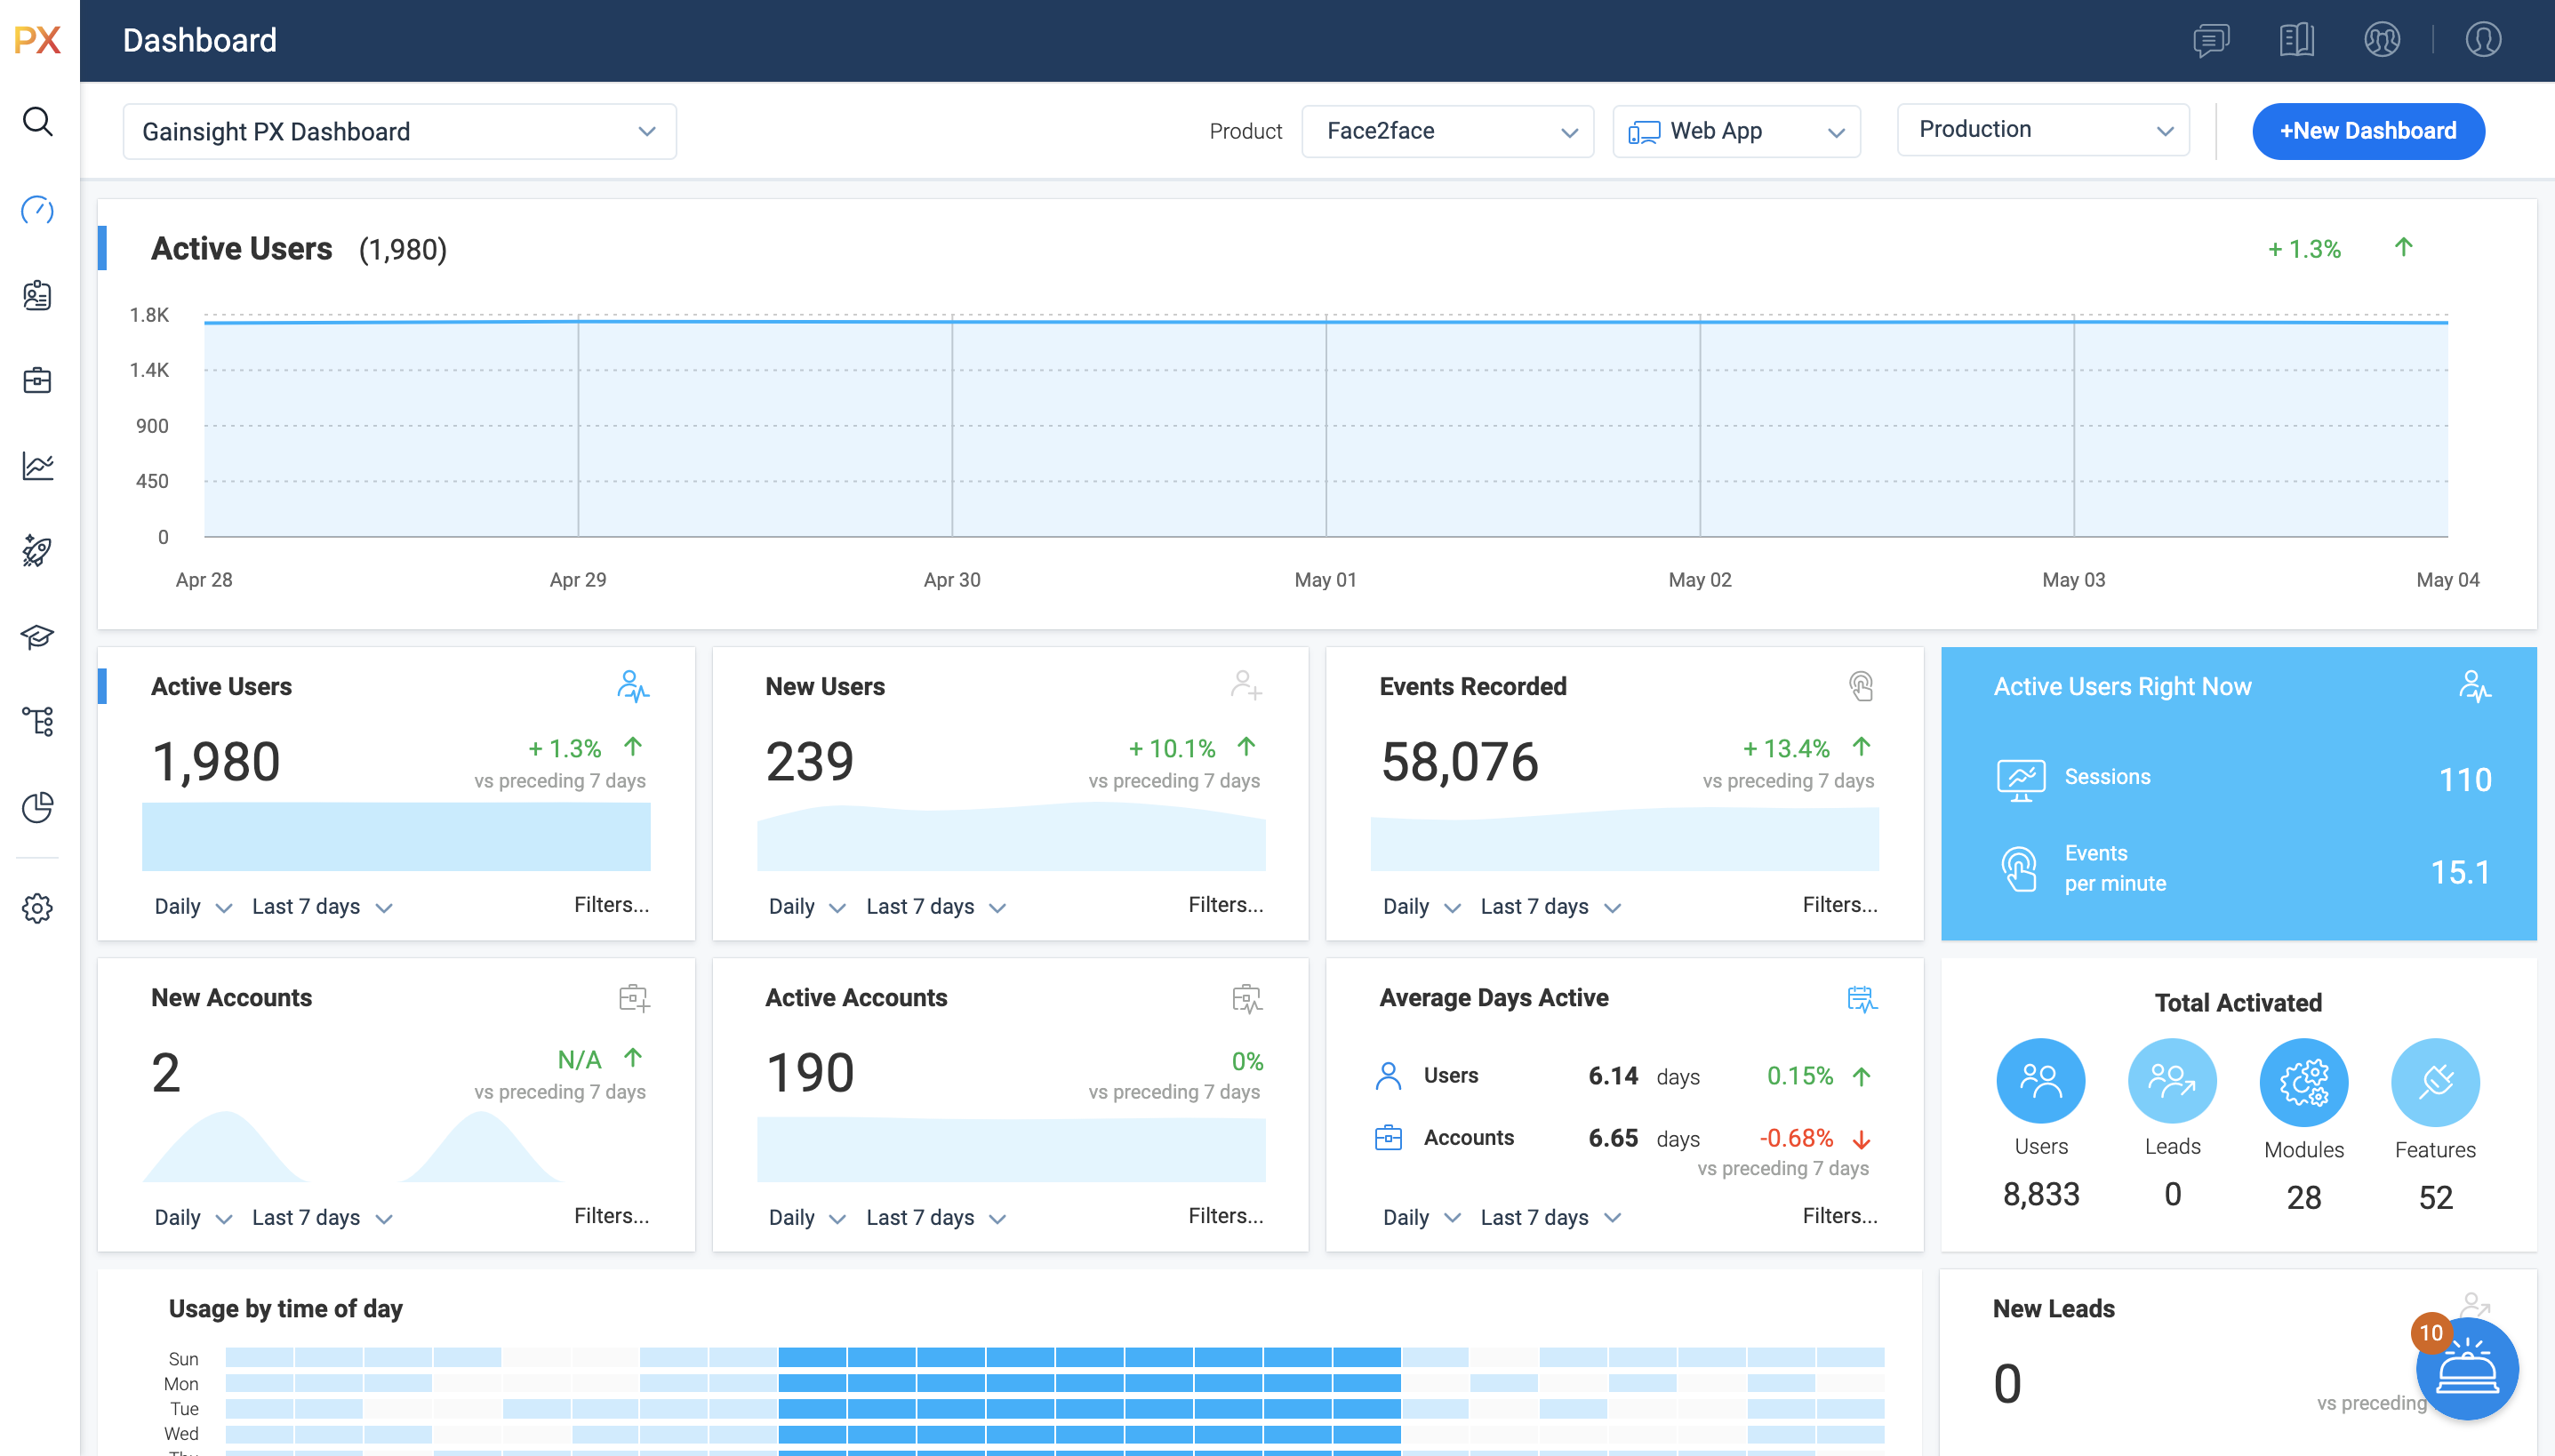
For SaaS products, Gainsight's product experience software enables companies to track every step of their user's journey and fully understand how they're interacting with a product over time.
$0
100 or less MAUs (Monthly Active Users)
Mixpanel
Score 8.7 out of 10
N/A
Mixpanel helps companies measure what matters, make decisions fast, and build better products through data. With self-serve product analytics solution, teams can analyze how and why people engage, convert, and retain—in real-time, across devices—to improve their user experience. Mixpanel serves over 26,000 companies from different industries around the world, including Expedia, Uber, Ancestry, DocuSign, and Lemonade. Headquartered in San Francisco, Mixpanel has offices in New York,…
$0
per month
Pricing
Gainsight PX
Mixpanel
Editions & Modules
Starter (Free)
$0
100 or less MAUs (Monthly Active Users)
Starter
Starting at $400/M
500+ MAUs (Monthly Active Users)
Growth
Custom
Per MAUs (Monthly Active Users) and more
Free
$0
per month
Growth
$17
per month
Enterprise
Contact sales
Offerings
Pricing Offerings
Gainsight PX
Mixpanel
Free Trial
Yes
No
Free/Freemium Version
Yes
Yes
Premium Consulting/Integration Services
No
No
Entry-level Setup Fee
No setup fee
No setup fee
Additional Details
—
Mixpanel uses MTU (Monthly Tracked User) pricing, which is designed to scale with your company. MTUs are roughly equivalent to the number of unique visitors on your product and each user is counted once per month, even if they use multiple devices. If Events based pricing makes more sense for your business, reach out to us and we can work with you!
It’s a robust tool that allows you to easily map and track key features and actions within your products. It also allows for in app communications to help guide the user through the path you want them to follow. The ability to connect with Gainsight CS also allows you to leverage that data to drive actions for the account team, incorporate it in health scoring, and use it to trigger digital programs. You do need a well thought out strategy for management of the platform, the data and how you will use it.
Mixpanel is a versatile platform that integrates features to connect every work team and get the best out of them in productivity and results. Moreover, it will improve the flow of information and interaction between all your company staff; it will unify and help promote collaboration between the different work areas. Without a doubt, I highly recommend this software
Mapping your product is easier with PX than with Google Analytics (mapping your product makes usage data appear as hits on mapped URLs, buttons, etc)
PX is good at showing simple messaging popups to customers.
PX Badge functionality—a persistent hover- and click-enabled popup launcher, positioned on select pages and attached to select elements—works well as a self-serve resource for users. It can be unobtrusive yet right there when needed.
PX modal content is fully editable HTML with plenty of flexibility.
Audience filters are really powerful. You can target users by many built-in and dev-configurable attributes, like device-type (which helped me work with mobile web users), browser, account, parts of the application visited/used in the last day, and many more.
Mixpanel's ease of use is easily their best feature, allowing you to quickly create graphs with a few point and clicks. Their UI is also fairly snappy and well-designed.
Tying together events with user attributes allows you to properly segment users into cohorts which can then be tracked individually. Proper segmentation is where most analytics solutions earn their keep.
Live view is a nice perk that gives you a good feel for who's on your site and what they're doing at any single point in time. This can be further filtered to focus on particular events of interest.
Mixpanel has flexible plans that work for smaller startups as well.
I didn't use the engagement features at all but it seems like they could have a better WYSIWYG editor for the emails for non-technical people using Mixpanel.
The custom reports feature seems to be really powerful but I wish they had more resources/templates for creating custom reports. I don't code so it was really hard for me to use this feature...BUT the reports I was able to get help with, were really powerful.
I wanted a dashboard area for all of my reports in one view. It seems like they were implementing this when I was moving jobs. If it's not available yet, they definitely need to add a master dashboard page for arranging saved reports.
It's not an all encompassing solution like Google Analytics tries to be, but MixPanel offers much easier to use and understandable data insights. That's valuable when juggling many responsibilities as startup life demands, so a renewal would be easily justified.
It is a good product, but like with every product, there is room for improvement or even just things I, as a user, would prefer, such as the ability to click on a company and have it go to Salesforce instead of Insight. It can also be difficult to find certain reports.
Relativity easy to use. Once you get the hang of it, very easy to create dashboards for different use cases. I split my dashboards between customers or use cases
I have not had to contact support frequently but when I have I used the chat and my questions were answered immediately. I've also used their knowledge center, help documentation and training videos which are all very thorough. The support we've received from our Customer Success Manager has been helpful as well.
There is no support at all for free-plan users. There used to be a good support but something changed. If everything had gone great we could've considered upgrading but it is so bad that we'll look for an alternative once we finish the current project. Given that the documentation is very poor, there are some aspects in which customer support could have helped a lot, but with no support, we are left with some needs unfulfilled.
Mixpanel has a great resource about their product, with videos on how to use it and real world examples from other companies on how they integrate Mixpanel into their business processes.
Mixpanel is a simple JS script installation. For adding events to track, its simply a matter of adding the code where you want it. Their API and documentation are easy to understand and use.
I have used and evaluated a few similar products to Gainsight PX, including Appcues, WalkMe, and Pendo. I found that Gainsight PX was the most comprehensive and user-friendly platform, offering features such as customizable onboarding flows, product usage tracking, and automated customer success workflows.
Datanomix is an excellent tool, with similar characteristics; however, Mixpanel has been our preference for two main reasons: one, to have customization and to be able to adapt the interface and tools to our use, and two, to be able to count on reports that it automates the work of sales analysis and being able to evaluate progress.
Customer Sentiment. Customers have been excited when we can show them data around usage and where we can improve.
Deciding to remove features. We have used PX to identify features that have little to no usage which allows us to get rid of unnecessary process and maintenance.
Identifying areas of improvement. We are able to find areas of our product that we need to focus on improving where previously we would have missed or had a tough time justifying spending time and resources.
User event data has helped us improve our product, which has increased subscriptions.
Being able to send helpful messages to some users who drop off after certain events has helped us reduce our churn.
We have been able to identify the Monthly super-active users, understand their usage of our product, which we use to conduct focus groups to help us shape the product.